Full Terms & Conditions of access and use can be found at
http://www.tandfonline.com/action/journalInformation?journalCode=cbie20
Download by: [Universitas Maritim Raja Ali Haji] Date: 18 January 2016, At: 19:57
Bulletin of Indonesian Economic Studies
ISSN: 0007-4918 (Print) 1472-7234 (Online) Journal homepage: http://www.tandfonline.com/loi/cbie20
PROSPECTS FOR SKILLS-BASED EXPORT GROWTH
IN A LABOUR-ABUNDANT, RESOURCE-RICH
DEVELOPING ECONOMY
Ian Coxhead & Muqun Li
To cite this article: Ian Coxhead & Muqun Li (2008) PROSPECTS FOR SKILLS-BASED EXPORT GROWTH IN A LABOUR-ABUNDANT, RESOURCE-RICH DEVELOPING ECONOMY, Bulletin of Indonesian Economic Studies, 44:2, 209-238, DOI: 10.1080/00074910802168998
To link to this article: http://dx.doi.org/10.1080/00074910802168998
Published online: 31 Jul 2008.
Submit your article to this journal
Article views: 158
View related articles
ISSN 0007-4918 print/ISSN 1472-7234 online/08/020209-30 © 2008 Indonesia Project ANU DOI: 10.1080/00074910802168998
* The authors are grateful to Ross McLeod, Thee Kian Wie, two anonymous referees and the series editor for helpful comments on earlier drafts. All remaining errors are our own.
Indonesia in Comparative Perspective Series
PROSPECTS FOR SKILLS-BASED EXPORT GROWTH
IN A LABOUR-ABUNDANT, RESOURCE-RICH
DEVELOPING ECONOMY
Ian Coxhead* Muqun Li* University of Wisconsin-Madison and University of Wisconsin-Madison Norwegian University of Life Sciences
In an integrated global economy, specialisation in trade is an increasingly promi-nent strategy. A labour-abundant, resource-rich economy like Indonesia faces stiff competition in labour-intensive manufactures; meanwhile, rapid growth in demand for resources from China and India exposes it to the ‘curse’ of resource wealth. This diminishes prospects for more diversifi ed growth based on renewable resources like human capital. Using an international panel data set we explore the infl uence of resource wealth, foreign direct investment and human capital on the share of skill-intensive products in exports. FDI and human capital increase this share; resource wealth diminishes it. We use the results to compare Indonesia with Thailand and Malaysia. Indonesia’s reliance on skill-intensive exports would have been greater had it achieved higher levels of FDI and skills. Its performance in accumulating these endowments, and its relative resource abundance, impede diversifi cation in production and trade. We present policy options fl owing from these fi ndings.
INTRODUCTION
Indonesia is an important case study in economic development both by virtue of its size (it is the world’s fourth most populous nation) and for the lessons it may offer to other countries. One of the world’s poorest and least promising economies in the 1950s, it has had an impressive record of growth and structural transfor-mation since the establishment of the New Order government (1966–98). Fifteen years ago, in a stunning vindication of the economic gains of the New Order era, Indonesia (along with Southeast Asian neighbours Singapore, Malaysia and Thai-land) was included in the group of so-called high-performing Asian economies (HPAEs) whose growth successes defi ned the ‘East Asian miracle’ (World Bank
1993). For the half-decade 1993–97, Indonesia’s per capita income placed it among the lower-middle income economies—a position it relinquished during the Asian crisis but regained in 2003 (World Bank 2008).
1990 1992 1994 1996 1998 2000 2002 2004 2006 100
120 140 160
180 Indonesia
Malaysia
Thailand
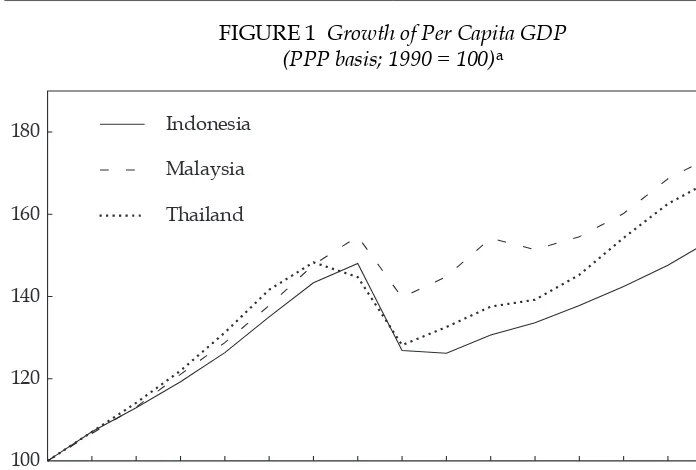
FIGURE 1 Growth of Per Capita GDP (PPP basis; 1990 = 100)a
a PPP = purchasing power parity.
Source: World Development Indicators Online.
Despite these gains, Indonesia’s recent growth has been persistently slower than that of its closest HPAE comparators, Malaysia and Thailand. Taking 1990 as a base, fi gure 1 shows that by 2006 Indonesia’s per capita income, measured in
PPP (purchasing power parity) adjusted dollars, had grown by 61%; Thailand’s by 76%, and Malaysia’s by 81%. The ratio of Indonesia’s per capita income to that of Thailand had fallen from over 48% to 44%, and the ratio for Malaysia from 40% to 35%. While Indonesia’s growth record is healthy by the standards of develop-ing economies worldwide, a puzzle remains as to why its performance within the dynamic East and Southeast Asian region has lagged behind.
What explains this regional growth difference? Is there any evidence of a long-term slowdown in Indonesia’s growth rate, either now or in the future? What would it take for Indonesia to reach the ‘next level’—upper-middle income sta-tus—or at least to consolidate its position in the lower-middle income group? Obviously, there are many ways in which these questions can be framed and answered. In this paper we focus only on Indonesia’s growth challenges and opportunities as a trade-dependent economy, one that has abundant endowments of natural resources and labour and is also a participant in the dynamically grow-ing Asian regional trade in manufactures. In particular, we focus on the likely interactions between resource abundance and the prospects for growth through participation in the booming regional trade in skill-intensive parts and compo-nents. What can we learn about Indonesia from an examination of international and regional data? What policy lessons can be drawn, for Indonesia or for other developing nations?
We fi rst explore the particular growth challenges faced by economies abundant
in labour and natural resources within a global economy that is increasingly inte-grated, that rewards specialisation but that is increasingly dominated by some
very large developing-country players, notably China. We continue with a quan-titative international comparison based on a broad group of countries, and a more detailed examination of the Indonesian case within the Southeast Asian regional context. Our analysis is intended to shed light on whether a resource-rich econ-omy like Indonesia might really face a ‘middle income trap’ and, if so, what policy steps may be needed to escape it. The fi nal section of the paper identifi es some
preliminary policy implications.
FACTOR ENDOWMENTS AND COMPARATIVE ADVANTAGE IN THE SHORT AND LONG RUN
Could pursuit of comparative advantage within an ever-larger and more closely integrated global market impose a barrier to the growth of some developing econ-omies? At fi rst, the very question seems paradoxical; after all, economists believe
that by following comparative advantage a small open economy gains from spe-cialisation, which is associated with enhanced opportunities for economic growth. However, this view is subject to a number of challenges that seem relevant to the present-day Indonesian case.
The ‘curse’ of natural resource abundance
A price-taking country with comparative advantage in non-renewable or depletable natural resources will optimally exhaust its stocks, because domestic scarcity will not be refl ected in prices derived from global markets. The
phenom-enon of weak property rights in natural resources—common in developing coun-tries—generates even faster rates of depletion. Moreover, resource-based export growth may reduce the prospects for future economic growth and diversifi cation.
The claim that natural resource abundance contributes to low growth rates among developing economies has been given empirical support in several prominent papers—notably, though not exclusively, by Sachs and Warner (1999, 2001). Sev-eral explanations have been offered for this apparent paradox. First, the ‘Dutch disease’ effects of natural resource exports can inhibit growth in all other tradable sectors because of competition for labour and capital from resource sectors and secondary, demand-driven expansion in non-traded sectors (Corden and Neary 1982).1 The losers will typically include manufacturing, a sector whose expansion
is commonly believed to generate positive productivity externalities giving rise to increasing returns. Slower growth in manufacturing then reduces the economy’s potential for dynamic growth. Second, specialisation in natural resource sectors may reduce returns on human capital investment, and thus diminish incentives for educational attainment (Gylfason 2001a). Resource- abundant countries in which this occurs will then fi nd it more diffi cult to climb product variety or quality
lad-ders in manufacturing, where human capital inputs are employed with increas-ing intensity on each successive rung. Third, lower growth rates have also been
1 ‘Dutch disease’ is ‘[t]he deindustrialization of a nation’s economy that occurs when the discovery of a natural resource raises the value of that nation’s currency, making manufactured goods less competitive with other nations, increasing imports and decreasing exports. The term originated in Holland after the discovery of North Sea gas’ (<http://www.investorwords.com/>).
attributed to the destabilising macroeconomic consequences of ‘Dutch disease’. Resource booms cause relative shrinkage in the output of non-resource tradable sectors, while resource and non-tradable sectors expand. Consequently, the shares of resources and non-tradables in GDP increase, as does the share of resources in total trade. This has the effect of heightening vulnerability to global market shocks. In world markets, commodity prices fl uctuate much more than do the
prices of other goods, so both relative prices and incomes in the domestic econ-omy become less stable. It is in the nature of non-tradable sectors that adjustment to demand or supply shocks also takes place disproportionately through price
fl uctuations (Hausmann and Rigobon 2002). Thus, both price and income
insta-bility and unpredictainsta-bility of returns on investments are magnifi ed in
resource-dependent developing economies.
Such effects are of course not automatic, but rather are conditional on particular confi gurations of policies and institutions (Humphreys, Sachs and Stiglitz 2007).
A large literature attributes development failures in resource-abundant economies to institutional weaknesses, whether these are due to colonial legacies (Acemoglu, Johnson and Robinson 2002), ethnic divisions (Easterly and Levine 1997) or other causes. Some recent political economy papers argue that resource wealth itself con-tributes to the degradation of the rule of law and the institutions of governance and policy making, in effect by promoting the ascendance of the ‘predatory state’ over the ‘developmental state’—either by actively encouraging the former through corruption related to resource rents, or by undermining the latter when revenue
fl ows associated with resource extraction become the dominant source of income
(Auty 2001; Murphy, Schleifer and Vishny 1993). Arguments of this type have been made with particular force in case studies of Latin America and sub-Saharan Africa (Acemoglu, Johnson and Robinson 2002, 2004). Mauro (1995) has uncovered a sta-tistically signifi cant negative relationship between corruption and investment.
The quality of development policy, including that intended to strengthen govern-ance and the rule of law, may also be negatively affected by natural resource wealth. Gylfason (2001a, 2001b) has argued that the sudden increase in income that follows a natural resource discovery may reduce the perceived need for sound economic management and institutional quality. The boom may also create a false sense of economic security and weaken the perceived need for investment and promoting strategies. In resource-abundant economies, politically powerful interest groups use rents to gain political and economic power, and this is usually against the public interest (Mauro 1995; Sachs and Warner 1999; Leite and Weidmann 1999; Gylfason 2001b; Torvik 2001). Isham et al. (2005) argue that because revenue from resources is unearned income, the diminished need to raise revenue from taxes on earned income means that the state in a resource-rich economy has less incentive to develop effi cient and accountable institutions of public fi nance. There is also less
incentive for citizens to demand mechanisms of accountability or to create the ‘hori-zontal social associations that many feel are the “preconditions” of democracy ...’. With unearned revenues, moreover, the state ‘can mollify dissent through a variety of mechanisms (buying off critics, providing the population with benefi ts,
infra-structure projects, patronage or outright graft)’, and also ‘has resources to pursue direct repression and violence against dissenters’. In a recent econometric exercise, Atkinson and Hamilton (2003) found that resource abundance has a signifi cant
negative effect on economic growth only in countries where government revenues
from resource rents are directed toward consumption rather than investment, lead-ing to low rates of genuine (i.e. resource wealth adjusted) savlead-ings. They conclude that institutions that are suffi ciently robust to prevent the dissipation of resource
rents on current consumption might avert the ‘resource curse’.
Exogenous changes in comparative advantage
Indonesia is also a labour-abundant economy, and in the past has used this fea-ture to good effect, building large export-oriented sectors in low-skill, labour-intensive activities such as garment and footwear manufacture. Even within East and Southeast Asia, however, Indonesia faces intense competition in the markets for these products, especially from emerging low-wage producers such as China and Vietnam. Countries that depend on exports of low-skill, labour-intensive products have been shown to be directly and negatively affected by competition from China—the largest exporter by far in these product categories—in trade (Eichengreen, Rhee and Tong 2004) and investment (Eichengreen and Tong 2005). Regional measures of revealed comparative advantage (RCA), which show the share of each product in a country’s exports relative to the share of that product in world exports, indicate the degree to which Indonesia’s comparative advantage is shared with its neighbours. Table 1 illustrates this with RCA data for 2000–04.
Of course, the growth of large developing economies such as China also cre-ates signifi cant market opportunities, and in the past decade Indonesia, like many
other countries, has seen its exports to China grow much faster than total exports. However, the composition of those exports refl ects complementarities between
the two countries. Indonesia’s exports to China are overwhelmingly dominated by agriculture, fi sheries, minerals, timber and other natural resources, and by
semi-processed manufactures based on these; labour-intensive manufactures hardly feature (Coxhead 2007). On the basis of these data one author has sug-gested quite strong prescriptions:
TABLE 1 Revealed Comparative Advantage (RCA) Measures for Labour-intensive Product Categories
(2000–04 average)a
Product Category
SITCb Code
Revealed Comparative Advantage Indonesia China Malaysia
Philip-pines
Thailand Vietnam
Travel goods,
handbags etc. 83 0.87 5.12 0.06 2.48 2.00 4.33
Clothing &
accessories 84 2.28 4.12 0.68 2.15 1.61 3.88
Footwear 85 3.02 4.59 0.13 0.24 1.51 13.42
a RCA values greater than 1 indicate comparative advantage.
b Standard International Trade Classifi cation.
Source: Coxhead (2007).
… Indonesia, facing sharp competition in international markets from other, rapidly industrializing countries, notably China, can no longer continue to rely on its tradi-tional sources of comparative advantage, including its large supplies of relatively cheap, but mostly low-skilled labour and its natural resources. In fact, in view of the large overlap of China’s and Indonesia’s labour-intensive exports … Indonesia is highly vulnerable to China’s strong export competitiveness … particularly in labour-intensive manufactured exports. Indonesia will therefore have to develop a more sustainable source of comparative advantage in order to raise the interna-tional competitiveness of its manufacturing industries (Thee 2005: 218).
‘Fragmentation trade’ and endogenous growth
Endogenous growth theory is constructed around the idea that some forms of growth generate increasing returns or positive externalities, such that the economy can grow in sustained fashion rather than converging on a steady state in terms of per capita income. This idea is typically articulated in the single-sector context of aggregate growth models. Several contributions, however, locate endogenous growth in a two-sector or multi-sector context, and some of these provide remind-ers of the dynamic costs of ‘Dutch disease’ and related ‘resource curse’ phenomena (Van Wijnbergen 1984; Matsuyama 1992; Sachs and Warner 1999). In these models, the expansion of a resource-intensive sector such as oil or forestry has ‘Dutch dis-ease’ effects that reduce productivity in activities that rely more heavily on capital, skills or technology, and whose expansion is associated with endogenous growth processes such as productivity spill-overs. When those sectors contract, there is a loss (or, rather, a failure to emerge) of productivity spill-overs or learning-by-doing effects, and of scale-related cost reductions associated with them. Van Wijnbergen (1984), for example, advances the hypothesis that the level of activity in manufactur-ing raises future factor productivity through learnmanufactur-ing-by-domanufactur-ing effects. A resource boom reduces manufacturing sector output through the familiar ‘Dutch disease’ mechanisms, and this in turn lowers the potential for productivity growth in the future. The economy’s capacity for diversifi cation away from resource dependence
toward higher-productivity activities in more skill-intensive sectors is reduced. This will be important from a welfare point of view when natural resources are subject to increasing extraction costs or outright exhaustion, since the economy’s level of specialisation in natural resource sectors cannot be sustained in the long run. The inter-temporal effects of ‘Dutch disease’ appear in Van Wijnbergen’s model in the form of ‘unlearning by not doing’, as it were, with consequences for future rates of economic growth.2 Institutional weaknesses, although they are not elucidated in
the models just cited, can also play a role, since they reduce the capacity to manage natural resource assets for the long term, to provide public goods and to overcome coordination failures in the supply of education and training. Thus weaker institu-tions create a higher premium on good development policies in the present.
2 This analysis is a precursor to endogenous growth models in which expansion of high-skill industries has positive productivity spill-overs, which raise returns to high-skilled labour and induce additional investments in human capital. But human capital investments are fi nanced by profi ts earned from production in lower-skill industries. So faster growth in lower-skill industries accelerates growth along with structural change (expansion of higher-skill output); conversely, lower world prices for lower-skill manufactures reduce profi ts, and thus reduce the rate of growth and structural change.
The importance of skill and technology upgrading is most clearly demonstrated in Asia by the rapid growth of ‘fragmentation trade’. When international trade is costly, it is effi cient to develop production processes that are vertically
inte-grated within the borders of a national economy. Recently, however, the lowering of transport costs and policy barriers to international trade has led to explosive growth in semi-fi nished manufactures. In the new global economy, components of
manufactured products are produced in many locations, depending on cost, and assembly of fi nal products takes place elsewhere. To middle income countries,
the brightest feature of China’s growth has been the expansion of its demand for knowledge-intensive and skill-intensive products, many of them unfi nished
goods (‘parts and components’), which are then assembled into fi nal products
in Chinese factories. Countries (including Malaysia and Thailand) that have dis-covered comparative advantage niches within the parts and components market are fi nding their trade accounts fl ourishing along with the expansion of Chinese
demand for imported intermediate goods.
The usual reasoning from Ricardian comparative advantage theory indicates that global welfare is enhanced by fragmentation. As with conventional trade lib-eralisation, however, fragmentation can produce losers as well as gainers. Losses can occur when a country with comparative advantage in an integrated produc-tion process loses market share to others with specialised capabilities, either in the production of parts and components or in the assembly of the fi nal product
(Jones and Kierzkowski 2001; Markusen and Venables 2007).3 Parts and
compo-nents production tends to be intensive in skills and technology, while assembly is labour-intensive; therefore, the countries most at risk of losing from growth of fragmentation trade are those with intermediate endowments of both unskilled labour and human capital. As parts and components trade expands, a middle income country like Indonesia could see its comparative advantage in manufacturing sectors eroded by the growth of trade between specialist countries like Malaysia (supplying high-tech intermediates) and China (providing assem-bly services), causing it to lose investments in the second industry and not to gain them in the fi rst. This speculation is supported by recent empirical studies
show-ing that China’s expansion has had benefi cial effects on trade and foreign direct
investment (FDI) in upper-middle income economies, but has greatly intensifi ed
the competition for global market share and FDI among less advanced economies (Eichengreen, Rhee and Tong 2004; Eichengreen and Tong 2005).
A middle income trap?
To sum up, the developing countries whose long-term growth prospects are most at risk in the current global economy are those that compete at the labour- intensive end of their manufacturing spectrum with low-income economies; that have little or no complementarity with those economies as suppliers of more skill- intensive parts and components; and that either have a high dependence on imported energy and raw materials or have exhaustible natural resource wealth but lack robust institutions to manage its extraction and the disposition of the associated
3 As Jones and Kierzkowski (2001) put it, ‘an Olympic gold winner in a mixed event, such as the decathlon … might return with no medals if the event is broken down into separate components’.
rents. These economies may be experiencing a variant of what the World Bank (2007) has termed the ‘middle income trap’, albeit one with features more spe-cifi c to lower-middle income economies than to those economies (mainly in Latin
America and Eastern Europe) aspiring to make the transition from middle to high income. The key challenges, however, are generically the same:
History shows that while many countries have been able to make it from low in-come to middle inin-come, relatively few have carried on to high inin-come … A lot of complex challenges have to be met, from raising the skills and innovativeness of the labour force, to creating sophisticated fi nancial systems, to maintaining social cohesion, to greatly reducing corruption. Without these sorts of tough policy and institutional changes, countries stay where they are, unable to bust out of middle income (World Bank 2007, web summary).
The foregoing discussion is a reminder that mere engagement with the glo-bal economy is not a suffi cient condition for sustained economic growth. Natural
resource exhaustion, ‘Dutch disease’ and the ‘resource curse’, and the emergence of competitor economies large enough to alter export prices in world markets all pose threats to growth strategies based on the pursuit of comparative advantage alone. To escape such a trap requires actions and policy decisions that dynamically ‘build’ comparative advantage in more skill-intensive (and more highly differen-tiated) activities. This is a well-trodden development path in East Asia, though of course the specifi c strategies by which changes in comparative advantage have
been pursued vary widely.4 The same World Bank study describes the challenge
in general terms as follows:
[C]ountries that are successfully making a transition towards high income status begin to specialize in selected areas where they are able to achieve economies of scale and technological leadership. Accompanying this change are a whole host of complex transitions, for example, substantial increases in the proportion of people with tertiary education and specialized skills, the transition from economies that largely absorb knowledge from abroad to ones that are also a source of innovation, the development of deep fi nancial systems that provide a diverse range of services, the movement of much of the population into livable cities, among many others. At the socio-political level, successfully transitioning countries are able to maintain a certain level of social cohesion, avoiding the emergence of deep inequities of the kind that fuel social confl ict and political instability and stall growth. Clean govern-ment and rule of law become the norm, while corruption becomes the exception (World Bank 2007: 26).
This list of conditions is clearly neither complete nor rigorous (for example, it is hard to imagine that urbanisation is anything but an endogenous response to other economic changes), but its characterisation of supply-side require-ments—skills, capacity to use knowledge in creative ways, and macroeconomic stability—is widely agreed. Asia provides several examples of countries that have achieved upper-middle income status despite high inequality and deep social divisions—Malaysia is one—but none has succeeded without overcoming these
4 Collins and Bosworth (1996) provide an excellent overview of the mid-1990s blossoming of scholarly studies on this subject.
supply-side constraints. While the mix varies greatly, the combination of skilled domestic labour and new technologies (principally though not exclusively sup-plied through FDI) is common to all East Asian success stories. Motivated by this fact, the next section of this paper explores possible relationships between coun-try characteristics and the relative importance of net exports of skill-intensive products in total exports.
SKILL-INTENSIVE EXPORTS: INTERNATIONAL EVIDENCE
Is there any empirically observable relationship between an economy’s endow-ments of productive factors and natural resources and its degree of specialisa-tion in skill-intensive exports? There is no obvious answer to this quesspecialisa-tion, and as with the empirical growth literature, there is little clear theoretical guidance beyond that presented in highly stylised models of the kind referred to in the previous paragraphs. In this section we present an econometric exercise aimed at explaining the skill intensity of exports in a panel of country data.
The total value of world exports of high-technology goods, according to the World Bank’s World Development Indicators, is somewhat more than one trillion dollars. In 1999, developing countries accounted for almost 16% of the total, a share that had risen steadily to 22% by 2003, the last year for which such data are available. Nearly all the developing country exports come from a small group of countries in East and Southeast Asia and Latin America.
The United Nations Comtrade database provides usable export data for 106 countries (appendix A); from these we can construct an unbalanced panel span-ning 1980–2005. We are interested in net exports of high-tech goods; with the growth of the parts and components trade, a country may appear to be a sig-nifi cant exporter of skill-intensive goods when in fact it serves merely as an
assembly-line for fi nal products whose skill-intensive inputs are sourced
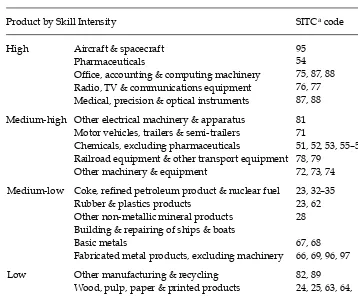
else-where. Therefore, in order to interpret the skill intensity of exports as a measure of the skills endowment of an economy, we must also take into account imports of skill-intensive parts and components. We construct a measure of the net skill intensity of exports as follows. We fi rst obtain the value of all exports in the fi rst
category shown in table 2 (high-skill-intensive products). We then compute the value of imports of all intermediate goods from the fi rst category, where
inter-mediates are defi ned principally by the use of the terms ‘parts’ or ‘components’
in the product description.5 We then deduct the value of imports from that of
exports, and divide this value by total merchandise export value to obtain the desired metric.6
5 Intermediate goods in the ‘High’ category in table 2 have the following 1992 Harmo-nised System (HS-1992) codes: 8503, 850490, 850690, 850790, 850870, 850990, 851090, 851190, 851290, 851390, 851490, 851590, 851690, 851770, 851890, 8522, 8529, 853190, 853290, 853390, 8538, 853990, 854091, 854190, 854390, 8803, 880400, 9002, 900390, 900590, 900691, 900699, 900791,900792, 900890, 901090, 901190, 901290, 901390, 901490, 901590, 901790, 901811, 901819, 901819, 901820, 901831, 901890, 902290, 902490, 902590, 902690, 902790, 902890, 902990, 903090, 903190, 903290, 903300, 911190, 9114, 9209, 9305, 930690, 930700.
6 Total merchandise export value is the sum of a country’s total merchandise exports to the rest of the world, using SITC codes 00–97.
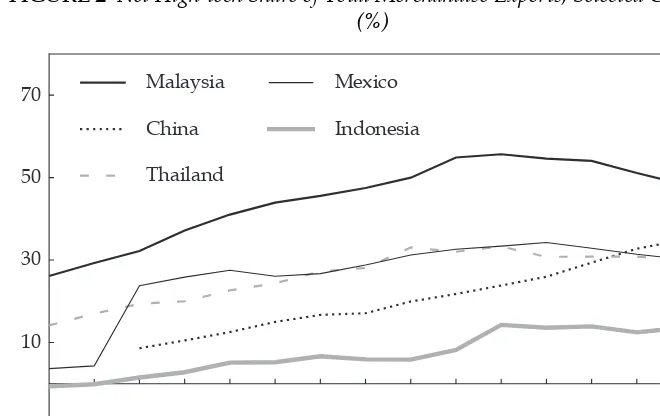
Figure 2 shows the resulting data for some of the most prominent skill-intensive developing country exporters. For all countries in this group other than China, the 1990s-era expansion in the export share of high-tech products has not been sustained in the new millennium. Some have seen pronounced falls in the con-tribution of high-tech products to total exports. In other countries such as Indo-nesia, net export shares have remained roughly steady since about 2000. In China, meanwhile, the net high-tech export share quadrupled between 1992 and 2005, from 9% to 36% of total merchandise exports.
We hypothesise that the net skill intensity of exports should be higher in econo-mies that have larger relative endowments of human capital, and in those that are hosts to relatively large FDI stocks. The role of FDI as a source of innovation and a stimulant of skills-based activity in tradables sectors is well established in empiri-cal studies (e.g. Hausmann, Hwang and Rodrik 2007). The level of a country’s FDI stock is also likely to refl ect macroeconomic conditions that determine the general
attractiveness of a country’s investment climate (Frankema and Lindblad 2006). For human capital we use the Barro and Lee (2001) measure, the percentage of
TABLE 2 Products Used in Calculating Skill Intensity of Exports
Product by Skill Intensity SITCa code
High Aircraft & spacecraft 95
Pharmaceuticals 54
Offi ce, accounting & computing machinery 75, 87, 88 Radio, TV & communications equipment 76, 77 Medical, precision & optical instruments 87, 88 Medium-high Other electrical machinery & apparatus 81
Motor vehicles, trailers & semi-trailers 71
Chemicals, excluding pharmaceuticals 51, 52, 53, 55–59 Railroad equipment & other transport equipment 78, 79
Other machinery & equipment 72, 73, 74 Medium-low Coke, refi ned petroleum product & nuclear fuel 23, 32–35
Rubber & plastics products 23, 62 Other non-metallic mineral products 28 Building & repairing of ships & boats
Basic metals 67, 68
Fabricated metal products, excluding machinery 66, 69, 96, 97 Low Other manufacturing & recycling 82, 89
Wood, pulp, paper & printed products 24, 25, 63, 64, Food products, beverages & tobacco 00–12, 22, 29, 41, 42 Textiles, textile products, leather & footwear 21, 26, 61, 65, 83, 84, 85
a Standard International Trade Classifi cation.
the population aged 25 and over with post-secondary education.7 Since FDI can
be directed to many sectors, and in the absence of reliable data on the sectoral distribution of FDI by country and year, we make the assumption that sectoral FDI stocks in a given country are proportional to GDP shares. In the econometric analysis, therefore, we multiply initial FDI stocks in each period by the GDP share of manufacturing, in the hope that this adjustment better captures the amount of foreign capital going into this part of the economy rather than into property, min-ing, energy or services such as tourism.8
Most contributions to the empirical ‘resource curse’ literature employ the standard aggregate growth model, testing hypotheses about the effects of resource wealth on the long-run average growth rate of GDP per capita in linear regression models (e.g. Sachs and Warner 1999, 2001). Our variant on the ‘resource curse’ hypothesis is one step removed from growth models and, rather than examining the resource wealth–GDP growth relationship directly, predicts instead that the net skill intensity of exports will be lower, other things being equal, in economies with relatively abundant natural resource wealth.
7 This measure does not discriminate by type of post-secondary qualifi cation or by quality. We were unable to obtain more detailed data with coverage adequate for a panel of countries. 8 Obviously this adjustment is very crude: it ignores sectoral capital intensity, bundling of investments with technology or training, and many other relevant phenomena including the allocation of FDI within manufacturing. Some diffi culties in constructing cross-country comparisons of FDI are raised in Anderson and Rand (2003). The validity of our results using this adjustment method depends on the adjusted fi gures being correlated with the true data.
1990 1992 1994 1996 1998 2000 2002 2004
-10 10 30 50
70 Malaysia
China
Thailand
Mexico
Indonesia
FIGURE 2 Net High-tech Share of Total Merchandise Exports, Selected Countries (%)
Source: Authors’ computations from Comtrade data.
Finally, we also surmise that, for the reasons given above, the relative strength of institutions may infl uence the net skill intensity of exports, particularly in
resource-rich developing economies. We use the ‘law and order’ variable from the Political Risk Services International Country Risk Guide (ICRG) database to proxy for institutional robustness.
Our options for econometric analysis are tightly constrained by data limitations that restrict us to using multi-year sub-periods of the data; with multiple observa-tions on some countries we have a maximum of 191 observaobserva-tions, depending on which set of variables is used. Import data required to construct the net export measure are unavailable before 1985, so we have four usable six-year intervals from 1985 to 2005. The data set is highly heterogeneous, with countries rang-ing from low income to high income and spannrang-ing all regions of the world. We attempt to control for the most obvious sources of heterogeneity with dummy variables for developing economies, time period and world region.
We fi t the data to the following linear model (in which italics denote scalars and
bold denotes vectors):
Y a e
it = +b X' it+c Z' it+d D' + i,
where Y
it is average net exports of skill-intensive goods as a share of total
mer-chandise exports in country i and from year t to t + 5, and X
it is a vector of
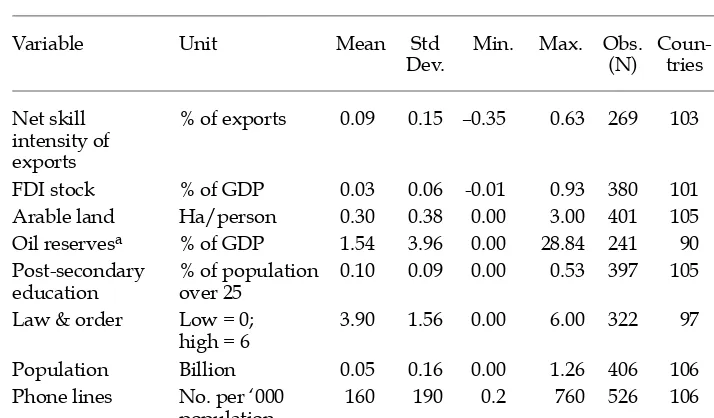
TABLE 3 Summary Statistics of Continuous Variables
Variable Unit Mean Std
% of exports 0.09 0.15 –0.35 0.63 269 103 2.61
FDI stock % of GDP 0.03 0.06 -0.01 0.93 380 101 3.82 Arable land Ha/person 0.30 0.38 0.00 3.00 401 105 3.82 Oil reservesa % of GDP 1.54 3.96 0.00 28.84 241 90 2.68 Post-secondary
education
% of population over 25
0.10 0.09 0.00 0.53 397 105 3.78
Law & order Low = 0; high = 6
3.90 1.56 0.00 6.00 322 97 3.32
Population Billion 0.05 0.16 0.00 1.26 406 106 3.83 Phone lines No. per ‘000
population
160 190 0.2 760 526 106 4.96
GDP per capita Year 2000 $ 7,793 9,481 111 37,165 393 104 3.78
a Oil reserves data are not available for all countries and years. Missing values were computed as follows:
1 Obtain oil reserves data from World Resource Institute, oil export data from UN Comtrade. 2 Regress oil reserves data on oil exports by country and year.
3 Generate missing oil reserves data by prediction based on oil exports, where oil exports are cal-culated from category 2709 of HS-1992 (Petroleum oils and oils obtained from bituminous minerals, crude).
Full details of this computation are available from the authors on request.
continuous independent variables consisting of adjusted FDI stocks, human capital stocks, arable land per capita, oil reserves relative to GDP, and law and order as defi ned by the ICRG. We include the product of oil reserves and the
law and order measure to control for possible institutional interactions with oil wealth, as discussed in the previous section. The vectorZ
itcontains continuous
variables intended to control for country-specifi c characteristics; it includes
pop-ulation (a proxy for domestic market size), and telephone mainlines per capita (Canning and Fay 1993) and GDP per capita to capture relative sophistication in the economy not included in the measure of human capital. The vector D
con-sists of dummy variables and inter actions among them; we include dummies for each time interval except 2000–05, an East Asia and Pacifi c regional dummy, and
another for developing countries. We also use interactions of year and East Asia– Pacifi c dummies to account for the differential growth rate of intra-Asian trade,
which has expanded far more quickly than has global trade since 1990, with skill-intensive trade occupying an ever-increasing share (Athukorala and Yamashita 2006). Finally, the error term e
itis itself a compound that we re-defi ne according
to the specifi c panel data estimator used, and a, b, c and d are co effi cients to be
estimated.
The variables used in the econometric analysis are defi ned and summarised in
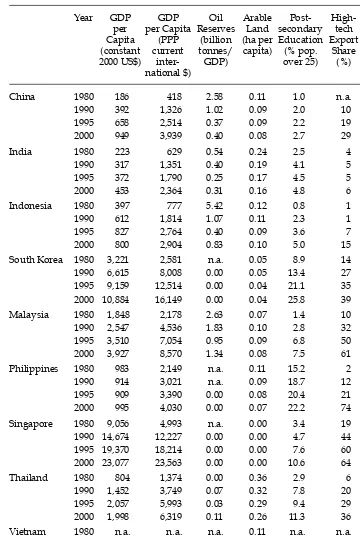
table 3, and their sources are shown in table 4. Table 5 provides data for some Asia Pacifi c economies.
Estimation results
We estimate the model using OLS (ordinary least squares), fi xed effects (FE)
and random effects (RE) specifi cations, and in both static and fi rst-order
auto-regressive (AR(1)) forms. It is always likely that the estimation model excludes some unobserved variable that contributes to an explanation of the variation in the dependent (or left-hand side) variable. For a panel of data on countries i over years t, an unobserved variable could vary across i but not t (for example, immu-table country characteristics such as geography); across t but not i (for example, global economic shocks); or across both i and t. Which econometric strategy is used to deal with the unobserved variable problem depends, among other things, on our beliefs about the source of unobserved variation. Simply put, in the current
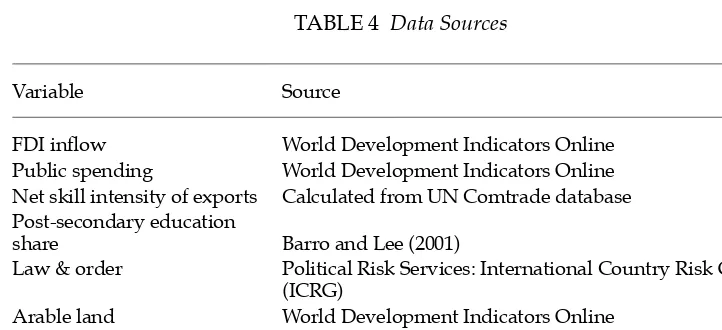
TABLE 4 Data Sources
Variable Source
FDI infl ow World Development Indicators Online Public spending World Development Indicators Online Net skill intensity of exports Calculated from UN Comtrade database Post-secondary education
share Barro and Lee (2001)
Law & order Political Risk Services: International Country Risk Guide (ICRG)
Arable land World Development Indicators Online
Oil reserves World Resources Institute, <http://earthtrends.wri.org/>
TABLE 5 Economic Indicators for Selected Asia Pacifi c Economies
China 1980 186 418 2.58 0.11 1.0 n.a. 0.03
1990 392 1,326 1.02 0.09 2.0 10 0.98
1995 658 2,514 0.37 0.09 2.2 19 4.92
2000 949 3,939 0.40 0.08 2.7 29 3.20
India 1980 223 629 0.54 0.24 2.5 4 0.04
1990 317 1,351 0.40 0.19 4.1 5 0.07
1995 372 1,790 0.25 0.17 4.5 5 0.60
2000 453 2,364 0.31 0.16 4.8 6 0.78
Indonesia 1980 397 777 5.42 0.12 0.8 1 0.38
1990 612 1,814 1.07 0.11 2.3 1 0.96
1995 827 2,764 0.40 0.09 3.6 7 2.15
2000 800 2,904 0.83 0.10 5.0 15 2.72
South Korea 1980 3,221 2,581 n.a. 0.05 8.9 14 0.01
1990 6,615 8,008 0.00 0.05 13.4 27 0.30
1995 9,159 12,514 0.00 0.04 21.1 35 0.34
2000 10,884 16,149 0.00 0.04 25.8 39 1.81
Malaysia 1980 1,848 2,178 2.63 0.07 1.4 10 3.75
1990 2,547 4,536 1.83 0.10 2.8 32 5.30
1995 3,510 7,054 0.95 0.09 6.8 50 4.70
2000 3,927 8,570 1.34 0.08 7.5 61 4.19
Philippines 1980 983 2,149 n.a. 0.11 15.2 2 -0.33
1990 914 3,021 n.a. 0.09 18.7 12 1.20
1995 909 3,390 0.00 0.08 20.4 21 1.99
2000 995 4,030 0.00 0.07 22.2 74 2.97
Singapore 1980 9,056 4,993 n.a. 0.00 3.4 19 10.53
1990 14,674 12,227 0.00 0.00 4.7 44 15.13
1995 19,370 18,214 0.00 0.00 7.6 60 13.72
2000 23,077 23,563 0.00 0.00 10.6 64 17.77
Thailand 1980 804 1,374 0.00 0.36 2.9 6 0.59
1990 1,452 3,749 0.07 0.32 7.8 20 2.86
1995 2,057 5,993 0.03 0.29 9.4 29 1.23
2000 1,998 6,319 0.11 0.26 11.3 36 2.74
Vietnam 1980 n.a. n.a. n.a. 0.11 n.a. n.a. n.a.
1990 227 940 n.a. 0.08 n.a. n.a. 2.78
1995 305 1,428 1.77 0.07 n.a. n.a. 8.59
2000 397 2,016 6.11 0.08 2.6 7 4.16
n.a. = not available.
Sources: See table 4.
context an FE estimator assumes time-invariant, country-specifi c variation only;
an RE estimator makes no such assumption but posits instead that the unob-served variable is uncorrelated with other explanatory (right-hand side) variables in the model. Because our data consisted of repeated observations on countries over time, use of a fi rst-order (i.e. one-period) autoregressive estimator (denoted
(AR(1)) is a way of allowing for the possibility of dynamic or persistent effects, that is, that the current value of the dependent variable is determined both by cur-rent values of independent variables and by its own value (and thus those of the independent variables) in the previous period.9 In table 6, we report four sets of
RE results, chosen on ex ante grounds to be the most plausible specifi cations (the
criteria applied were relatively complete independent variable sets and a mix of static and AR(1) specifi cations).10 In each regression model shown, the dependent
variable is the average value of the net skill intensity of exports for a given inter-val. The values of the independent variables in vector X
itare those in the initial
year of the same six-year period.11
The results vary somewhat according to model specifi cation, but in most instances
the major hypotheses fi nd statistically signifi cant support (table 6).12 Larger relative
endowments of adjusted FDI are strongly and signifi cantly associated with higher
shares of skill-intensive exports. Similarly, the relationship between human capital stocks and skill-intensive exports is robust and positive. The results indicate that countries with richer endowments of skills and complementary resources, such as
9 There are in general no unambiguous ex ante reasons to prefer FE or RE estimators, but in the current context there is a case for using RE. The FE estimator uses only ‘within’ varia-tion, i.e. variation in the dependent and explanatory variables after removing observation-specifi c means. In the case where much of the variation in the data is ‘between’, i.e. infor-mation contained in the means (across individual observations or time), the FE estimator ignores a relatively large share of the information in the data set. Moreover, because FE attenuates the variance in the regressors, measurement error imposes a greater degrada-tion in the signal to noise ratio; hence a variable measured with error will be more likely to be biased toward zero. On the other hand, RE assumes that the independent variables are uncorrelated with the error terms. The FE estimator will be ineffi cient under the null hypothesis that RE is correctly specifi ed, because it discards the information in the group means. If the error terms are correlated with the independent variables, then the RE estima-tor will be inconsistent. Another reason to prefer RE is that we want to include some time-invariant dummy variables because we believe these are important sources of explanatory power and as such will help us to get a better prediction for Southeast Asian countries’ net skilled-export intensity. Accordingly, we use the Hausmann test; for the fully specifi ed static model the null is not rejected, so we prefer the more effi cient RE estimator.
10 To save space, the full set of estimation results is available in an online archive at <http://www.aae.wisc.edu/coxhead/papers/CoxheadLiBIES/>.
11 Empirically, there are two ways to control for an Indonesia-specifi c effect. We can in-clude a dummy variable for Indonesia in all of our regressions; doing so barely changes our estimation or counter-factual analysis results (for these results see the URL cited in footnote 10). Alternatively, in our counter-factual analysis in the next section of this paper, we take the difference between Indonesia’s actual net skill-intensive export share and our predic-tion of that share as a country-specifi c effect that varies over time (see below).
12 We are grateful to an anonymous referee for suggested improvements in the model specifi cation.
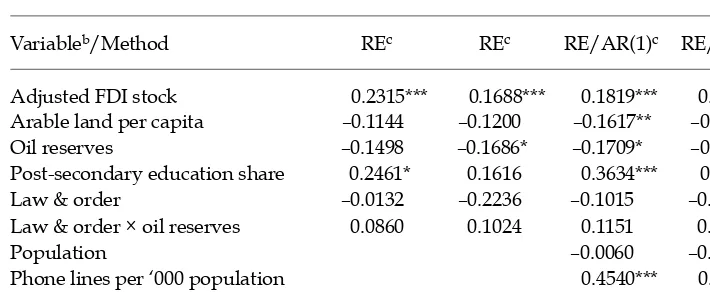
TABLE 6 Estimation Resultsa
Variableb/Method REc REc RE/AR(1)c RE/AR(1)c
Adjusted FDI stock 0.695*** 0.506*** 0.546*** 0.550*** (0.1356) (0.1306) (0.1155) (0.1131) Arable land per capita –0.035 –0.037 –0.050** –0.047**
(0.0281) (0.0262) (0.0192) (0.0188) Oil reserves –0.009 –0.010* –0.010* –0.013**
(0.0069) (0.0063) (0.0058) (0.0057) Post-secondary education share 0.223* 0.146 0.329*** 0.245**
(0.1256) (0.1226) (0.1153) (0.1145) Law & order –0.000 –0.005 –0.002 –0.007 (0.0050) (0.0046) (0.0051) (0.0057) Law & order × oil reserves 0.001 0.002 0.002 0.002 (0.0017) (0.0046) (0.0013) (0.0013)
Population –0.010 –0.025
(0.0482) (0.0479) Phone lines per ‘000 population 0.003*** 0.003***
(0.0009) (0.0010)
GDP per capita 0.002 0.002
(0.0018) (0.0018) Developing country = 1 –0.084*** –0.069* 0.018 0.040 (0.0285) (0.0386) (0.0367) (0.0380) East Asia & Pacifi c = 1 0.196*** 0.218*** 0.179*** 0.194***
(0.0310) (0.0297) (0.0233) (0.0286) 1985–90 = 1 –0.057*** –0.005 –0.020 0.013 (0.0184) (0.0213) (0.0199) (0.0275)
1990–95 = 1 –0.013 –0.005 0.010 0.014
(0.0108) (0.0101) (0.0113) (0.0122) 1995–2000 = 1 0.003 0.000 0.021** 0.019**
(0.0083) (0.0076) (0.0088) (0.0088) (1985–90) × East Asia & Pacifi c = 1 –0.132*** –0.063 (0.0303) (0.0423) (1990–95) × East Asia & Pacifi c = 1 –0.072*** –0.017 (0.0189) (0.0265) (1995–2000) × East Asia & Pacifi c = 1 0.009 0.043**
(0.0172) (0.0188)
Observations 160 160 160 160
Groups 76 76 76 76
R-square
Within 0.4646 0.6716 0.4528 0.5643
Between 0.6322 0.6315 0.6810 0.6890
Overall 0.6087 0.6282 0.6338 0.6567
a Dependent variable = average value of the net skill intensity of exports for a given time interval; * signifi cant at 10%; ** signifi cant at 5%; *** signifi cant at 1%; standard error in parentheses.
b See table 3 and the text for a more detailed explanation of the variables. c RE: random effects estimator; AR(1): fi rst-order autoregressive error structure.
the technologies, market networks and managerial inputs that are typically associ-ated with FDI, perform more strongly in the skill-intensity race.
Natural resource wealth has a negative association with skill intensity of exports. Larger relative endowments of arable land are associated with lower skill intensity, though not signifi cantly so in the two static models. Similarly, oil
reserves relative to GDP have a negative and (in three out of four regressions) signifi cant association with the dependent variable. These results are consistent
with the ‘Dutch disease’ component of the ‘natural resource curse’ argument, that resource wealth undermines an economy’s capacity to specialise in more skill-intensive products. However, the law and order variable itself, and its interaction with oil reserves, are statistically insignifi cant in all models.
Among the conditioning variables in vector Z, population and GDP per capita
contribute nothing signifi cant to the observed variation in skill-intensive export
shares. The size of the domestic economy seems not to be an important factor once other characteristics have been taken into account. The intensity of telephone mainlines, included in the third and fourth estimation models, does carry explan-atory power, serving (it seems) as a substitute for the basic differences between developing and high income economies.
The coeffi cient estimates on the developing country dummy lose signifi cance
when telephone line density is added to the set of independent variables. The East Asia and Pacifi c dummy is strongly and signifi cantly positive in all models,
underlining the well-known special characteristics of regional production struc-ture and intra-regional trade.
Table 7 shows the principal estimates in elasticity form. A 10% increase in FDI stocks is associated with a 17–23% higher skill-intensive export share, depending on the estimation model. A 10% greater accumulation of skilled labour would raise the same share by one-quarter to one-third. Finally, 10% more arable land is associated with a level of skill-based exports 11–15% lower. The share of these exports is 17–21% lower for each 10% higher level of oil reserves.
TABLE 7 Elasticities of the Estimates at Sample Meansa
Variableb/Method REc REc RE/AR(1)c RE/AR(1)c
Adjusted FDI stock 0.2315*** 0.1688*** 0.1819*** 0.1834*** Arable land per capita –0.1144 –0.1200 –0.1617** –0.1529**
Oil reserves –0.1498 –0.1686* –0.1709* –0.2092**
Post-secondary education share 0.2461* 0.1616 0.3634*** 0.2712**
Law & order –0.0132 –0.2236 –0.1015 –0.3076
Law & order × oil reserves 0.0860 0.1024 0.1151 0.1478
Population –0.0060 –0.0145
Phone lines per ‘000 population 0.4540*** 0.4658***
GDP per capita 0.1708 0.1725
a Dependent variable = average value of the net skill intensity of exports for a given time interval; * signifi cant at 10%; ** signifi cant at 5%; *** signifi cant at 1%.
b See table 3 and the text for a more detailed explanation of the variables. c RE: random effects estimator; AR(1): fi rst-order autoregressive error structure.
These results are suggestive of three distinct policy-relevant stories relating to the expansion of skill-intensive exports. First, investments in human capital pay dividends in the acquisition of skills-based comparative advantage for all econo-mies. To the extent that expected returns on human capital investments are subject to policy infl uences (for example, through macroeconomic stability or the
provi-sion of complementary infrastructure), there is a role for government in helping to ensure that private investment decisions are suffi cient to match the socially
optimal growth in demand.
Second, there is a strong positive association between playing host to tradable-sector FDI and the expansion of skill-intensive industries (Sjöholm 1999; Blalock and Gertler 2004; Takii 2005). As with human capital, there are clear policy link-ages to the rate of FDI accumulation, and these are likely to operate through both macroeconomic policy and microeconomic (sectoral) policies, as well as through the design, implementation and enforcement of the regulatory regime.13
Third, our results thus support a specialised version of the theoretical ‘Dutch disease’ prediction: after controlling for more industry-specifi c endowments
of productive assets, we fi nd that resource-abundant countries occupy smaller
niches of comparative advantage where skill-intensive products are concerned. An implication is that increased export demand for agricultural and natural resource exports may stimulate aggregate economic growth, but this growth will not necessarily lead to the expansion of skills-based manufacturing output.
INDONESIA IN INTERNATIONAL AND REGIONAL CONTEXT
In the second section of this paper we identifi ed some sources of apparent
vul-nerability to a middle income trap: the ‘resource curse’ and associated loss of capacity in tradable manufacturing sectors; a loss of comparative advantage by labour-intensive manufacturing industries facing intensifi ed global competition;
and forgone opportunities for growth-enhancing spill-overs from skill-intensive industries. Middle income countries in Southeast Asia are relatively resource rich but—thanks to the post-Plaza Accord (1985) boom in outward FDI from Japan and East Asia and the global FDI boom of the early 1990s—they have evolved manu-facturing sectors that are advanced by the standards of the developing world.
Among these developing economies, Indonesia has lagged behind in terms of investments associated with productivity growth and progress up the techno-logical ladder (Thee 2005; Frankema and Lindblad 2006). Its policies toward FDI have refl ected considerable ambivalence. Early New Order era policies offered
limited encouragement to FDI in energy and mining, as well as tariff-jumping moves into import-substituting manufacturing sectors. Liberalisation of trade
13 Several recent studies of Indonesian growth also identify important supply-side constraints, including labour market regulations, infrastructural inadequacies and an unstable legal and political setting (e.g. Athukorala 2006; Takii and Ramstetter 2007). Such considerations undoubtedly apply widely in the developing world. Our econometric analysis cannot capture such effects for a panel of countries without the addition of much more (and more detailed) data. It is likely that the FDI measure in our data set refl ects at least part of the effect of this set of constraints, as all must serve to discourage inward FDI fl ows in manufacturing sectors.
and investment policies in the 1980s and early 1990s was signifi cant but
short-lived. From around 1993 it was subject to both ‘mixed signals’ and the onset of ‘deregulation fatigue’ (Azis 1998); in the late New Order era the criteria for investment policy reform seemed to be derived as much from a domestic politi-cal agenda as from the search for economic effi ciency and growth—at least prior
to major reforms adopted in 1994 (Thee 2006). Perhaps as a result, Indonesia’s record of total factor productivity (TFP) growth in the critical early develop-ment decades (1975–95) was respectable in an absolute sense, but not relative to Asian trade partners and potential competitors (Timmer 1999; Collins and Bosworth 1996).14
Relatively low TFP growth can also be understood in the context of Indonesia’s transformation, during this period, from an extremely poor, rural and agrarian economy into the ranks of the lower-middle income countries. This was a tre-mendous (and tretre-mendously rapid) transformation, based initially on exploita-tion of its abundant endowments of natural resources and, increasingly after the mid-1980s, on unskilled labour in export-oriented manufacturing. In the post-crisis era—which coincides with the rise of China both as a global exporter of many of the same labour-intensive products that Indonesia exports and as a mar-ket for skill-intensive inputs to their production—the principal reasons for Indo-nesia’s low performance in skills-based industries are different. These have been identifi ed and discussed in the specifi c contexts of Indonesian history, politics
and economics by Bird and Hill (2006), who offer three explanations: a relatively low policy weight applied to skills upgrading relative to the need to re-establish macroeconomic stability and an investment-friendly business climate; lack of an adequate educational and training infrastructure for the production of skilled workers; and the ‘fundamental discontinuity’ of the crisis itself and of the sub-sequent political upheavals and transition to democracy. To these three reasons we may speculatively add two more. The fi rst of these is the inter-sectoral effect
of global commodity market booms that have driven the prices of some of Indo-nesia’s key natural resource, agricultural and horticultural exports to all-time highs (World Bank 2007: 15). While the impact of these sustained price shocks has yet to be formally tested, they are likely to have had substantial effects on the real exchange rate, and perhaps even on domestic factor prices—the two princi-pal channels through which such booms are likely to lower profi tability in
skills-based manufacturing. Second, it is impossible to ignore the potential impact of China’s expansion on Indonesia’s tradable manufacturing sectors in general, and on labour-intensive and skill-intensive industries in particular. Competi-tion with China has become intense at the labour-intensive end (Coxhead 2007; Eichengreen, Rhee and Tong 2004); whether Indonesia has the capacity or cost advantages to exploit complementarities in parts and components trade at the skill-intensive end remains in doubt (Thee 2005; Mulapruk and Coxhead 2005; Porter et al. 2006).
14 ‘Indonesian manufacturing is steadily climbing the technology ladder. However, global levels of TFP have also improved over the past decades. Hence, when viewed from an international perspective, Indonesia’s ascent resembles a standstill on the global escalator’ (Timmer 1999: 93).
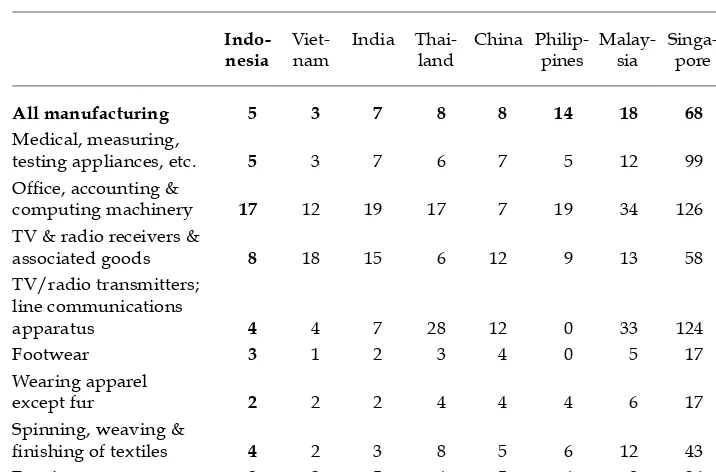
Among the major Asian economies, value added per worker in Indonesian manufacturing industries is not high (table 8). Indonesia’s labour productivity, by this measure, is lower than that of China both in the aggregate and in almost every product division except the major parts and components category of ‘offi ce,
accounting and computing machinery’. In this category, however, productiv-ity per worker in Indonesia is roughly matched in several other lower-middle income economies in the region (Thailand, the Philippines and India) and its level is much lower than that in neighbouring Malaysia. At this level of aggregation at least, there is no evidence of a niche market advantage.
As already seen in fi gure 2, Indonesia also shares with other middle income
economies a declining growth rate of skill-intensive exports relative to total exports (China is the exception). In the 1990s, Indonesia’s exports of goods classifi ed as
‘high-tech’ in the World Development Indicators rose from a negligible component of manufacturing exports to a share just above 16%—and most of this was in real-ity the labour-intensive assembly of consumer electronics. Since 2000, moreover, that share has not grown (fi gure 3), in spite of a near linear rate of expansion in the dollar value of this export category. In fact, as the fi gure shows, the Indonesian data fi t very well to a piecewise linear spline function in which the rate of expansion
of the share of exports classed as high-tech in 2001–05 is only about one-third that of the years 1989–2000.15
15 For details of estimation, see the URL cited in footnote 10.
TABLE 8 Manufacturing Value Added per Worker, Selected Asia Pacifi c Economies ($’000 per worker)
computing machinery 17 12 19 17 7 19 34 126 104 TV & radio receivers &
associated goods 8 18 15 6 12 9 13 58 45
Source: United Nations International Development Organization (UNIDO).
These data are consistent with direct (though subjective) measures of high-tech capacity collected by the Georgia Institute of Technology High-Tech Indicators Project (Porter et al. 2006). On measures of socio-economic and technological infra-structure, national policy orientation, and productive capacity in high-tech indus-tries, Indonesia is ranked at or near the bottom of the group of 33 nations surveyed. It was ranked 32nd of 33 in expert opinions of current high-tech production
capac-ity (2005) and 28th of 33 in opinions of future capability. Interestingly, four of the
countries ranked below Indonesia in the latter assessment are also major resource exporters (Mexico, Venezuela, Argentina and Russia); the remaining low rank was occupied by the Philippines. It is safe to assert from these comparisons that Indo-nesia is at best a marginal player in the global high-tech export market.
How different would Indonesia’s skill-intensive export record look if its past policies had resulted in its attaining human capital and FDI endowments compa-rable with those of its regional neighbours? As of 2000, only 5% of Indonesians over the age of 25 were recorded as having completed any kind of post- secondary education, compared with 7.5% in Malaysia and 11.3% in Thailand (table 5). Indo-nesia’s educational attainment fi gures are only slightly higher than those for
China and Vietnam, regional economies normally considered to have progressed much less far along the development path. On FDI, too, Indonesia at best matches most of its regional neighbours. Its FDI was 2.7% of GDP in 2000, equivalent to that of Thailand and the Philippines, but far behind Malaysia and even Vietnam.
In order to locate the Indonesian experience in a regional context we now con-duct two counter-factual exercises based on the estimates in table 6. Such proce-dures are of course risky; every country is unique. Nonetheless there is value in drawing comparisons, if only for the purpose of sharpening debate over what it is that makes each country different, and what might be done, where desired, to alter specifi c country features in ways that could lead to more promising
develop-ment outcomes.
1989 1991 1993 1995 1997 1999 2001 2003 2005
-2 1 4 7 10 13 16
High-tech export share (%)
Spline function
FIGURE 3 Indonesia: Skill-intensive Export Share, 1989–2005
Source of basic data: World Development Indicators Online.
As already discussed, the estimates reported in table 6 are based on a hetero-geneous group of countries, and our regressions explain only about 63% of the observed variation in that data set. There is no especially strong reason to expect that the model will yield a good prediction of the dependent variable for any given country in the data set. It is instructive, therefore, to consider the data in table 9. For each country and time interval, the fi rst data column in this table shows the
value of the net skill-intensive export share in total merchandise exports. For Indo-nesia, for example, gross skill-intensive exports were worth slightly less than cor-responding imports in 1985–90; thereafter, the domestic industry expanded to the point where, by 2000–05, it accounted in net terms for 13% of merchandise exports. This was a huge expansion, particularly given rapid growth in Indonesia’s total exports by value over the same period; but the fi gure is still very much lower than
those for the two most directly comparable Southeast Asian countries, data for which are also shown in the table.
The second column in the table shows country-specifi c predictions of the
dependent variable, obtained by fi tting country FDI and human capital data to
the coeffi cient estimates in table 6 and then averaging the results over the four
models. For Malaysia and Thailand, these average predictions fi t the actual data
surprisingly well, considering the heterogeneity of the underlying data from which the coeffi cient estimates were obtained. The model under-predicts
Malay-sia’s skill-intensive export share until 1995, matches it almost exactly in the late 1990s, then over-predicts it in the post-crisis years after 2000. For Thailand, the model matches actual export data until 1995, but over-predicts it in the crisis era.
TABLE 9 Actual and Predicted Net Skill-intensive Export Shares, Developing Southeast Asia
Period Actual Sharea Average Predictionb
Indonesia 1985–90 –0.007 0.112
1990–95 0.023 0.179
1995–2000 0.077 0.244
2000–05 0.132 0.258
Malaysia 1985–90 0.240 0.219
1990–95 0.349 0.312
1995–2000 0.496 0.482
2000–05 0.521 0.573
Thailand 1985–90 0.131 0.141
1990–95 0.196 0.215
1995–2000 0.297 0.311
2000–05 0.307 0.363
a Authors’ computations from Comtrade data.
b Average computed from the results of the four regression models shown in table 6.
For Indonesia, the model consistently over-predicts skilled exports by a very large margin, even after controlling for differences in GDP per capita and natural resource wealth and allowing for geographical location in the dynamic Asia Pacifi c
grouping. Based on our panel data estimates, Indonesia’s skill-intensive export share by the mid-1990s should have been about 25%: three times the observed share in 1995–2000, and twice the observed share in 2000–05. Put another way, the model predicts that in 2000–05 Indonesia should have had a skill-intensive export share roughly comparable with that enjoyed by Malaysia in 1985–90 or Thailand in 1995–2000. Its actual share, however, corresponds to that of Thailand in 1985–90, and is half that of Malaysia in 1985–90.
These comparisons are based on within-country predictions from the econo-metric model, but they also suggest an alternative approach. What if Indonesia, owing to different policies and conditions in earlier years, had achieved levels of FDI and human capital corresponding more closely to those of its regional neigh-bours? Table 10 provides indicative answers by generating predicted values of Indonesia’s skill-intensive export share using Indonesian data for all but FDI and human capital, values of which are then supplied from the neighbouring coun-tries. Suppose, for example, that Indonesia in 1985-90 had Thailand’s levels of FDI and human capital; how different would its skill-intensive export share have been? From our computations, the answer for this period is ‘not much’: net intensive exports were very low in both countries (and negative in Indonesia) during this period. But by the fi nal decade of the data, the difference between Thai
and Indonesian performance is revealed in a predicted gap of 23–29%; by 2000– 05, if Indonesia had had Thai levels of FDI and human capital, its skill-intensive export share would have been four percentage points higher (a 29% difference). This counter-factual is consistent with data on the structure of industrial produc-tion and trade, factor productivity, R&D expenditures, and the technology content of FDI, which suggest that Indonesia ‘lags behind Thailand by about ten years, or slightly more’ (Frankema and Lindblad 2006).
Malaysia provides a more stark contrast. Malaysian levels of FDI and human capital investments, if replicated in Indonesia in 1995–2005, could have helped that country increase the contribution of its skill-intensive exports to total mer-chandise exports by half to two-thirds. If Indonesia had had Malaysian levels of FDI and human capital in 2000–05, the counter-factual indicates that skill-inten-sive manufactures would have accounted for 22% of exports rather than the 13% actually recorded.
Table 10 also shows a breakdown of the contributions of human capital and FDI differences to the total difference in each comparison. This reveals that Thailand and Malaysia differ from Indonesia in different ways. In Malaysia, most of the dif-ference comes from FDI; in Thailand, it comes mainly from human capital, at least until 2000. This suggests that although improvements in both FDI and human capital accumulation are necessary, there is likely to be more than one path lead-ing to the growth of a more skill-intensive manufacturlead-ing sector.
The foregoing are static predictions obtained simply by replacing the Indo-nesian values of FDI and human capital with those from the other two countries within any given period of the data. As such, they ignore the dynamic effects of investment decisions on the skill-intensive export share in subsequent periods. Yet growth dynamics derived from learning by doing and other phenomena with
TABLE 10 Net Skill-intensive Export Share Predictions for Indonesia Using Regional FDI and Human Capital Data
Actual Counter-factual with Data from
Indonesia Thailand Malaysia
1985–90
Total Net skill-intensive export share –0.007 0.004 0.016 Difference from Indonesia (%) 161.27 345.80 Due to
human capital
Net skill-intensive export share 0.004 –0.003 Contribution to total difference (%) 92.42 14.41 Due to
FDI
Net skill-intensive export share –0.006 0.013 Contribution to total difference (%) 7.58 85.59
1990–95
Total Net skill-intensive export share 0.023 0.042 0.048 Difference from Indonesia (%) 81.95 106.88 Due to
human capital
Net skill-intensive export share 0.036 0.024 Contribution to total difference (%) 68.81 4.80 Due to
FDI
Net skill-intensive export share 0.029 0.046 Contribution to total difference (%) 31.19 95.20
1995–2000
Total Net skill-intensive export share 0.077 0.094 0.119
Difference from Indonesia (%) 22.99 55.31
Due to human capital
Net skill-intensive export share 0.090 0.084 Contribution to total difference (%) 77.54 17.78 Due to
FDI
Net skill-intensive export share 0.081 0.112 Contribution to total difference (%) 22.46 82.22
2000–05
Total Net skill-intensive export share 0.132 0.170 0.223
Difference from Indonesia (%) 28.68 69.21
Due to human capital
Net skill-intensive export share 0.147 0.138 Contribution to total difference (%) 39.26 6.46 Due to
FDI
Net skill-intensive export share 0.155 0.217 Contribution to total difference (%) 60.74 93.54
Source: See table 9, notes a and b.