The Capital Structure Determinants of
Indonesia Publicly Listed Firms
Carolina Tandya
International Business Management Program, Petra Christian University Jl. Siwalankerto 121-131, Surabaya
E-mail: [email protected]
ABSTRACT
In order to compete and survive in the unpredictable economy circumstances, corporation should be able to manage the capital structure. This research aims to investigate the influence of capital structure determinants (profitability, firm size, tangibility, and growth opportunity) towards capital structure decision in 138 Indonesia publicly listed firms from the period of 2009 – 2013 using multiple regression model. This research suggests that profitability, firm size, and growth opportunity statistically have significant influence toward corporate leverage. On the other hand, tangibility does not have significant influence toward capital structure decision. Profitability and firm size indicate negative influence towards corporate leverage that support pecking order theory. While, the negative relationship between growth opportunity and corporate leverage is aligned with static trade off theory and agency cost theory.
Keywords: Capital structure, Determinants, Indonesia, Public Listed
ABSTRAK
Agar dapat bersaing dan bertahan in era ekonomi yang kian tidak dapat diprediksi, perusahaan harus dapat mengelola stuktur modal dengan baik. Penelitian ini bertujuan untuk mengetahui pengaruh determinan struktur modal (profitabilitas, ukuran perusahaan, aset berwujud, dan peluang pertumbuhan) terhadap keputusan struktur modal pada 138 perusahaan terbuka di Indonesia selama tahun 2009-2013. Penelitian ini mengunakan analisis regresi linear berganda. Dari hasil penelitian ditemukan bahwa profitabilitas, ukuran perusahaan, dan peluang pertumbuhan memiliki pengaruh signifikan terhadap
leverage sperusahaan. Di sisi lain, aset berwujud tidak memiliki pengaruh signifikan terhadap keputusan struktur modal. Profitabilitas dan ukuran perusahaan mengindikasikan pengaruh negatif terhadap leverage
perusahaan yang mendukung teori pecking order. Sedangkan, hubungan negatif yang ditemukan antara peluang pertumbuhan dan leverage perusahaan sesuai dengan teori static trade off dan agency cost.
Kata Kunci: Struktur Modal, Determinan, Indonesia, Perusahaan Terbuka
INTRODUCTION
Change is the only constant in the world of economy. In the 21st century, several economic nightmares struck the world like United States mortgage crisis, European Union crisis, and China economy slowdown. Those events have significant effects to the business due to the globalization and interdependence market. Firms have to cope with those changes to survive in the business. To adapt with crisis, firms need to put a close attention to their capital structure decision. Exercising the optimal capital structure is crucial to maximize the firm value and to survive in the business (Brealey & Myers, 1988; Baker & Martin, 2011).
The study of capital structure theory develops after the publication of „Irrelevancy Theory of Capital
Structure‟ by Modigliani and Miller in 1958. This research stated that in the perfect capital market, the capital structure decision will not affect the firm market value. Over the years, several theories about capital structure published under more realistic circumstances that the capital market has imperfect information. As the result, there are three most acknowledged capital structure theories which are the trade-off theory, pecking order, and agency cost (Jong, Kabir, & Nguyen , 2007).
capital structure only limited for certain sectors like plantation by Yolanda and Soekarno (2012) and manufacturing by Utami (2012) because the research aim to capture those industry uniqueness in determining capital structure decision. Since there is a research gap, this paper aims to conduct empirical study of capital structure determinants in Indonesia publicly listed firms.
Indonesia is an interesting nation to be scrutinized when talking about firm capital structure determinants. This archipelago country has gone through a tremendous economic development after suffering Asian financial crisis. In 2013, Indonesia produced USD 868,346 billion gross domestic product. This amount of gross domestic product puts Indonesia as the 16th largest economic in the world only 16 years after experiencing Asian Economic crisis. Indonesia economic development is driven by the sustainable and stable economic growth as well as the rising number of middle class (Menkeu, 2014). Besides, Indonesia also has a unique business environment as the emerging economy. Corruption is still a problem and happens in nation key institutions like parliament. Besides, the law enforcement is still effective and slow. Indonesia has numerous trade barriers when conducting investment and trading hamper the economic freedom. In term of funding, Indonesia is a bank center economy (Nagano, 2003). Domestic business entities rely on the bank loan in the forms of bank overdraft, commercial paper, and inter-company borrowing. Because of the economy uniqueness and potential, Indonesian firms capital structure determinants worth to be investigated.
This research will focus on the 138 Indonesia publicly listed firms and covers the period from 2009-2013 because during that period of time Indonesia economy developed 6.2% on the average with the stable economic condition (Biro Analisa Anggaran dan Pelaksanaan APBN, 2014). Indonesia Public listed firms are chosen since those companies are giving the powerful impact toward Indonesia economy development, information accessibility and those corporation are exposed to different choices of financing sources (Sindo News , 2013) (IDX, 2014). This goal of this paper is to examine Indonesian firms‟ capital structure determinants that have been found by most of the study as dominant predictors (profitability, firm size, tangibly and growth) and their influence toward capital structure decision (corporate leverage).
Findings from this research will give insight regarding the determinant of capital structure in Indonesia public listed firms that is applicable the corporate decision maker. Further, the academician able to understand this result to be used as the reference for further research and to fill the gap of the current capital structure determinants studies in Indonesia that mostly conducted for specific industries.
LITERATURE REVIEW
This chapter provides the literature review about capital structure theories. Pioneer of capital structure theory from Modigliani and Miller will be presented in brief. Core principles of trade-off theory, pecking order, agency cost, are also going to be discussed.
The understanding of Modigliani and Miller theory used is firm value will not be affected by the capital structure decision (Modigliani & Miller, 1958). The contribution of Modigliani and Miller theorem is the debate that arises from this theory because of assumption of perfect capital market used like the same risk free rate. In fact, those assumptions cannot reflect the firm‟s capital structure practice in the real business circumstances that is being influenced by market imperfection. Therefore, several theories developed and emerged under more realistic circumstances considering several factors like taxes, bankruptcy cost, information asymmetry, and agency cost (Antoniou, Guney, & Paudyal, 2008; Baker & Martin, 2011; Frank & Goyal, 2009)
.
Static trade-off theory is originated from the research of Kraus and Litzenberger (1973) that argues corporate taxation and bankruptcy penalty matter in the capital structure valuation. This theory tries to question the absence of corporate taxation and bankruptcy cost in the Modigliani and Miller theorem. Based on the Kraus & Litzenberger (1973):
A tax advantage to debt financing arises since interest charges are tax deductible. Assuming that the firm earns its debt obligation, financial leverage decrease the firm‟s corporate income tax liability and increases its after-tax operating earnings. However, a corporate bond is not merely a bundle of contingent claims but is a legal obligation to pay a fixed amount. If the firm cannot meet its debt obligation, it is forced into bankruptcy and incurs the associated penalties (p.911-12).
Static trade-off theory at some point can explain how the capital structure of a company should be implemented. This theory suggests that corporation should have moderate debt ratio. However, at some point this theory cannot give explanation why big corporation able to succeed with little debt (Brealey, Myers, & Allen, 2014). Static trade-off theory gives the idea that corporation with more profitability have to compensate with higher debt ratio.
Internal funding like retained earnings will be firm first choice when the investment is needed up until the firm. Debt will be another financing choice to fill the financing deficit when the internal funding not enough for the investment. Equity financing will be used when the firm needs investment beyond the availability of debt financing.
The agency cost proposed by Jensen and Meckling (1976) argues about the concept of separation control issue result in the conflict of interest between the shareholder and management. There are two types of conflicts which are between shareholder-management and between debt holder-shareholder.
Conflict between the management and shareholder arise because of the use of free cash flow (Jansen , 2014). Shareholder have intention to use amount that free cash flow in order to fund the project that have positive net present value or else distribute it to the shareholder as the dividend (Jensen, 1986). In contrary, management has more incentive (power, payment) to utilize the free cash flow to grow the firm size. In order to minimize this issue, shareholder prefers management to issue debt. The larger debt in the capital structure decision may mitigate the conflict because it reduces the likelihood management use the free cash flow on the management perquisite (Niu, 2008; Harris & Raviv, 1991).
Conflict between shareholder and bondholder arise as the shareholder representative transfer the bondholder wealth to shareholder (Niu, 2008). The method that management is usually use is issuing debt stating that the fund would be used to invest in the low-risk project. However, once funds have been received, the management decides to use that debt to finance high risk project (Smith & Warner, 1979). This action could inflict financial loss for debt holder since the debt holder does not receive any return as compensation for the higher risk level. Debt holder imposes the management with several covenants in the loan agreement to protect their investment from management direct wealth transfer action. This constraint may limit the management access to debt.
From those literature reviews, static trade-off theory, agency cost and pecking order theory are going to be utilized to scrutinize using Indonesia publicly listed firms‟ capital structure decision.
Capital structure theories suggest different point of views regarding corporate leverage and profitability relationship. Static tradeoff theory argues that profitable firm will face lower cost of bankruptcy and value the tax shield advantages. Static tradeoff theory postulated that profitable firm uses debt more (Frank & Goyal, 2009). Similarly, agency cost also believes that corporate leverage has positive relationship with the profitability. Based on Jensen (1986), debt will minimize the agency cost. Shareholder believes that debt will ensure management use the free cash flow making effective investment decision rather than on management perquisite (Niu, 2008).
On the contrary, pecking order theory argues that firm prefers to finance the investment using internal fund rather than debt (Myers, 1984). More profitable firm will be able to generate more internal fund (Antoniou, Guney, & Paudyal, 2008). Therefore, it is postulated that firm profitability has inverse relation with corporate leverage based on the pecking order theory.
The relation between firm size and corporate leverage is defined as the positive relationship by static trade-off theory. From static trade-off theory perspective, possibility of bankruptcy is lower in the firm with bigger size (Rajan & Zingales, 1995). Hence, in the case of diversification, larger firm will likely to have higher debt to equity ratio in order to utilize tax shield benefits (Antoniou, Guney, & Paudyal, 2002). In line with the static trade-off theory, agency cost argues that lager firms have lower information asymmetry result in smaller monitoring cost since the corporate information can be access publicly. Hence it minimizes the agency problem and enable firm to borrow at the lower cost (Fama, 1985).
Pecking order theory has different perspective in scrutinizing the relationship between corporate leverage and firm size. Bigger firm size assumed to have high profitability and thus firm able to finance the investment using the internal fund (Vatanu, 2012). Hence, pecking order theory postulates inverse relationship between firm size and corporate leverage. Tangible asset such as land, building, and equipment is valued higher by the outsider since it can be used as collateral (Frank & Goyal, 2009). Hence, outsiders expect firm with more tangible asset will face lower probability of financial distress. Static trade-off theory argues that firm with high level of tangible asset will expect lower cost of bankruptcy. In order to maximize the marginal value of tax shield advantage and cost of financial distress, firms are expected to have higher level of debt. Static trade-off theory postulated that tangibility has positive relationship with corporate leverage. Similarly, Agency cost also predicts the positive relation between corporate leverage and tangibility. Firm with higher tangible asset will find difficulties to substitute the low risk project to high risk project because if it cannot meet the interest obligation debt holder may seize tangible asset as collateral (Johnson, 1997). Moreover, based on Stulz & Johnson (1985), agency cost will be minimized between management and shareholder since the cost of monitoring firm with high tangibility will be lower.
Pecking order theory predicts that tangibility have negative relationship with corporate leverage. High level of tangibility reduces the asymmetry information between management and outsider and management. Hence issuing equity will be less costly. Firm with high tangibility should have lower leverage ratio (Frank & Goyal, 2009).
the negative relationship. Based on Myers (1977), high growth opportunity reduces the high firm value since it has to be ready with big amount of investment to fund project. Hence, high growth opportunity firms have to face higher cost of financial distress and corporate have to keep the leverage low. In the perspective of agency cost, growth opportunity will worsen the agency conflict between bondholder and shareholder especially in the case of wealth transfer. Management has bigger tendency to change from low risk investment to high risk investment project. Bondholder will be reluctant to give debt to high growth opportunity firm.
Pecking Order believes accumulation of debt is necessary in the firm with high growth opportunity (Frank & Goyal, 2009). At the growth stage firm needs capital to fund the projects. At one point of time, internal fund which is the most preferred financing method is insufficient, firm need to issue debt (Leary
& Roberts, 2005). Hence, the pecking order postulated that high growth opportunity have the positive relation with the corporate leverage.
In the case of Indonesia publicly listed firms, pecking order theory will be more preferable since this nation depend more to family members, bank, and shareholder as the major financing provider (Doupnik & Perera, 2015). This study would like to confirm which theories are more appropriate to be used in Indonesia. The determinants that will be tested in this study are profitability, firm size, tangibility, and growth opportunity since in the previous study conducted in Indonesia, those determinants has proven to give influence to Indonesia firms‟ corporate leverage.
Based on the previous theoretical concept of the capital structure theories, the hypothesis of capital structure determinants on Indonesia publicly listed firms are:
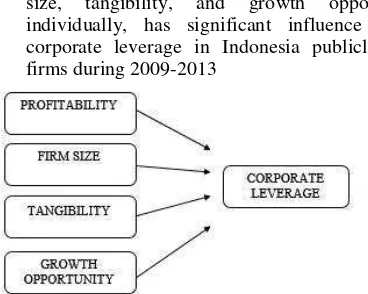
Hypothesis 1: Profitability, firm size, tangibility, and growth opportunity, simultaneously have significant influence toward corporate leverage in Indonesia publicly listed firms during 2009-2013
Hypothesis 2: Determinants (profitability, firm size, tangibility, and growth opportunity), individually, has significant influence toward corporate leverage in Indonesia publicly listed firms during 2009-2013
Figure 1 Conceptual Framework
RESEARCH METHOD
To achieve the research objective of this study which is to understand the significant determinants that influence the capital structure decision of Indonesia publicly listed firms as well as the relationship, explanatory type of research will be applied (Cooper & Schindler, 2014). Through explanatory research, this study would like to investigate the relationship between independent variables (predictors) and dependent variable (corporate leverage) based on the capital structure theories. The data that will be used in this study is secondary data, obtained from official firms annual report and idx.co.id regarding corporation financial performance will describe the corporate leverage and determinants (profitability, firm size, tangibility, and growth opportunity) actual values.
The dependent variable in this study is corporate leverage. The corporate leverage measurement that will be used in this study is the market leverage. Market leverage is ratio of total liabilities divided by market value of asset (Liem, 2006). Market value of asset is obtained from the total liabilities plus market value of equity. While market value of equity is being measured by number of outstanding shares multiple by the share price in the end of fiscal period.
The independent variables of this research consist of four variables which are profitability, firm size, tangibility and growth opportunity. The measurement of these four independent variables explained in the table below (Deesomsak , Paudyal, & Pescetto , 2004; Frank & Goyal, 2009; Utami, 2012,Jansen , 2014; Huang & Song, 2002; Liem, 2006; Gitman & Zutter, 2012; Jansen , 2014; Titman & Wessels, 1988).
Table 1 Measurement of Independent Variables
Sampling method in this research is going to employ judgement sampling as one type of non-probably sampling. This study will only choose the sample that match with the research objective to find the capital structure determinant of Indonesia publicly listed firms.
To analyze the determinants of capital structure in Indonesia publicly listed firms, descriptive statistic, assumption test and multiple regression analysis will be utilized. Descriptive statistic will be employed to look at the capital structure information in Indonesia public listed firms based on Industries between the years of 2009-2013. Assumption test (multicollinearity test, autocorrelation test, normality test, and heteroscedasticity test) is used to evaluate the assumptions of multi regression in order to obtain the best linear unbiased estimator. If the heteroscedasticity assumption cannot be fulfilled, the model will be employ weighted least square regression to compensate the violation of heteroscedasticity assumption by weighting variable differently. While, multiple regression analysis will investigate the relation between corporate leverage and determinants (profitability, firm size, tangibility and growth opportunity). To investigate the goodness of multiple regression model, it is required to use three methods which are F-test, T–test, and adjusted coefficient model of determination (Cooper & Schindler, 2014).
RESULTS AND DISCUSSION
There are 139 corporations obtain from eight industries eligible to become sample of this research, consist of Agriculture sector 8 companies (5.7%), Mining sector 15 companies (10.79%), Basic Industry and Chemical sector 27 companies (19.42%), Miscellaneous Industry sector 10 companies (7.19%), Customer Goods Industry sector 16 companies (11.51%), Property, Real Estate, and Building Construction sector 22 companies (15.83%), Infrastructure, Utilities, and Transportation sector 9 companies (6.47%), Trade, Service and Investment sector 32 companies (23.02%). In total, 695 samples are being investigated. However, outliers have to be removed, where the data has the point more than three standardize deviation, in order to understand the main source of heteroscedasticity (Osborne & Overbay, 2004). As the result, there are 138 companies being observed in this study with 681 data will be processed further.
Descriptive statistics in this study presents the capital structure information of sample firms.
Table 2 Result of Descriptive Statistics
Min Max Mean Std.
Deviation
CorpLev .0116
.9504 .3936 .2456
Profitability .0021
.8557 .1217 .1129
FirmSize 10.8438
14.1070 12.4746 .6519
Tangibility .0001
.9122 .3021 .2054
GrowthOpp .0247
47.2689 2.7136 4.4698
The mean of market leverage (ratio of total debt divided by total market value of asset) in the sample firms is 0.3936. The maximum corporate leverage among sample data is 0.9504 which is being possessed by PT. Bakrie Sumatra. On the other hand, the minimum corporate leverage is being utilized by PT. London Sumatra with the value of 0.0116.
In the sample data, the mean of profitability that is computed by return of assets (ROA) is 0.1217. PT. Multi Bintang has the maximum profitability among the sample data with the value of 0.8857. While, the minimum profitability with the value of 0.0021 is being obtained by PT. MNC Land. In the aspect of firm size, sample mean is recorded the value 12.4746. The measurement of firm size is the log of total assets. The maximum firm size obtain from the samples is 14.1070 which is being hold by PT. Telekomunikasi Indonesia. While, PT. Beton Manunggal Jaya has the minimum firm size with the value of 10.8438.
The mean of tangibility which is the ratio of total tangible asset divided by total asset is 0.3021. The maximum tangibility is utilized by PT. Ekadharma International with the value of 0.9122. Meanwhile, PT. Energy Mega Persada have the minimum tangibility with the value of 0.0001. Growth opportunity mean in the sample data is 2.7136 that is generated by the ratio of market value of equity divided by book value of equity. The maximum growth opportunity is 47.2689 that is obtain from PT. Multi Bintang data. On the other hand, the minimum growth opportunity is being gather from PT. Astra Otoparts with the value of 0.0247.
In order to assure that the regression model have fulfill the best linear unbiased estimator several assumption test have to be conducted like multicollinearity test, autocorrelation test, normality test, and heteroscedasticity test.
Multicollinearity test attempts to investigate the relation among the independent variables in the regression model. The statistic tools to test multicollinearity are the tollerence and VIF value of the collinearity statistic. The tolerance value should be more than 0.01 and the VIF value should be less than 10 to assure that no multicollinearity exists in the regression model. The result in the collinearity statistic of the independent variable shows there is no indication of the multicollinearity since none of the tolerance value < 0.01 and none of the VIF value > 10.
Autocorrelation test attempts to look whether the successive residuals are correlated or not. The detection of autocollinearity is tested using Durbin Watson test. In order to assure there is no autocorrelation the Durbin Watson value should be less than 1.8814 and greater than 2.118. The Result of durbin Watson test is 1.936 meaing there is no autocorrelation between residual in the regression model.
normality will be conducted using the result of Kolmogorov Smirnov statistic. The result of significant level in the Kolmogorov Smirnov test should be more than 0.05 in order to assure that the regression residual have are normally distributed. However, the result of Kolmorogorov Smirnov test indicates that the residuals in the regression model are not normally distributed since it is less than 0.05. Though residual normality assumption cannot be fulfilled, the regression model still can be applied since the sample of this study is 681 data, which is reasonably large, the regression model still able to produce best linear unbiased estimator though residual are not normally distributed (Hair, Black, Babin, & Anderson, 2009).
Heteroscedasticity test attempts to investigate an important assumption whether the error variances are constant or not. The detection of heterscedasticity is using Park test. The decision role of Park test is the significant value in the t test should be more than 0.05 to indicate that there is no heteroscedasticity in the model. This result of Park test gives the resul that there is heteroscedasticity condition since the significant value in the independent variable (firm size) is 0.007 which is less than the significant level of 0.05. Therefore, weighted least square (WLS) regression model have to be employed to compensate the violation of heteroscedasticity assumption by weighting source of the heteroscedasticity variable (firm size) differently (Garson, 2013). The result from WLS estimation will be unbiased and effective even the present of heteroscedasticity.
To investigate the goodness of weighted least square model, which are F-test, t–test, and adjusted coefficient model of determination.
In order to understand at the simultaneous effect of independent variables toward the dependent variable, F-test is being conducted. In this study the F-test result will be analyzed using p value test. The null hypothesis that profitability, firm size, tangibility, and growth opportunity, simultaneously does not have significant influence toward corporate leverage in Indonesia publicly listed firms during 2009-2013 can be rejected if the p value is less than the significant level of 0.05.
Table 3 Result of F Test
Sum of df Mean Sig.
Squares Square
Regression 6168.9 4 1542.2 .000 Residual 16466.5 676 24.4
Total 22635.4 680
The F test result can be seen that the p value shows the significant result which is 0.000 or less than 0.05. Hence, it can be concluded that null hypothesis is being rejected means that profitability, firm size, tangibility, and growth opportunity simultaneously have significant influence toward corporate leverage.
After having the understanding that profitability, firm size, tangibility, and growth opportunity, simultaneously have significant influence toward corporate leverage, t-test is conducted to investigate whether each independent variables, has the significant influence toward the corporate leverage or not. In t test, p value test will be utilized. The null hypothesis will berejected if the p value is less than the significant level of 0.05.
Table 4 Result of t Test
Unstandardized Standardized Sig.
B Std. Beta
Error
(Constant) .925 .158
.000
Profitability -.756 .087 -.349 .000
FirmSize -.034 .013 -.088 .008
Tangibility .035 .039 .029 .376
GrowthOpp -.012 .002 -.214 .000
In the independent variable of profitability, the p
value shows the result of .000, which is smaller than the significant level of 0.05. Therefore, it can concluded that the null hypothesis can be rejected and accept the alternative hypothesis. The result can be interpreted that profitability, individually has significant influence toward the corporate leverage. In addition, the standardize coefficient of – 0.349 presented in the equation, means that every unit increase in one standard deviation of profitability, the standard deviation of corporate leverage will decrease by 0.349 on the average, holding the other factors constant.
In the Independent variable of firm size, the p
value shows the result of 0.008, which is smaller than the significant level of 0.05. Therefore, it can concluded that the null hypothesis can be rejected and accept the alternative hypothesis. The result can be interpreted that firm size, individually has the significant influence toward the corporate leverage. In addition, the standardize coefficient of – 0.088 presented in the equation, means that every unit increase in the standard deviation of firm size, the standard deviation of corporate leverage will decrease by 0.088 on the average, holding the other factors constant.
In Independent variable of tangibility, the p value shows the result of 0.376, which is bigger than the significant level of 0.05. Therefore, it can be concluded that the null hypothesis fail to be rejected. The result can be interpreted that tangibility does not have significant influence toward the corporate leverage.
concluded that the null hypothesis can be rejected and accept the alternative hypothesis. The result can be interpreted that growth opportunity, individually has the significant influence toward the corporate leverage. In addition, the standardize coefficient of – 0.214 presented in the equation, means that every unit increase in the standard deviation of growth opportunity, the standard deviation of corporate leverage will decrease by 0.214 on the average, holding the other factors constant.
Based on the t test, the regression model could derived from the unstandardized coefficients as follows:
Y = 0.925 - 0.756 X1 - 0.034X2 + 0.035X3 - 0.012X4
Where:
Y = Corporate Leverage X1 = Profitability X2 = Firm Size X3 = Tangibility
X4 = Growth Opportunity
Adjusted coefficient of multiple determination (adjusted r square) investigates to what extend the variation of dependent variable can be explained by the independent variables.
Table 5 Result of Model Summary
Multiple R .522
R Square .273
Adjusted R Square .268
Log-likelihood Function Value 96.150
From the model summary result, it can be seen the adjusted r square value is 0.268. The result can be interpreted that 26.8% variation of the corporate leverage as the independent variable in the samples of the study can be explained by firms‟ profitability, firm size, tangibility, and growth opportunity as the independent variables.
Firstly, researcher will discuss and confirm the result of hypothesis 1 that profitability, firm size, tangibility, and growth opportunity simultaneously have significant influence toward corporate leverage. F test has to be utilized in order to find the hypothesis answer. The p value shows the significant result which is 0.000 or less than 0.05, it can be concluded that there is enough evidence to support hypothesis 1 that profitability, firm size, tangibility, and growth opportunity simultaneously have significant influence toward corporate leverage. Hence, profitability, firm size, tangibility, and growth opportunity are statistically valid to be used as corporate leverage determinants.
In order to confirm the result of hypothesis 2 that determinants (profitability, firm size, tangibility, and growth opportunity), individually, has significant
influence toward corporate leverage in Indonesia publicly listed firms during 2009-2013, t test has to be utilized.
From the result of the t test can be interpreted that profitability, individually has significant influence toward the corporate leverage. This result is in accordance with pecking order theory that suggests firm profitability has inverse relation with corporate leverage. High profitability firms have more internal generated fund (return earning) hence they would prefer to finance the investment using the internal fund rather than borrow debt or issue equity. This result shows that Indonesia firms prefer to finance the investment using internal fund rather than debt.
From the result of t test can be interpreted that firm size, individually has significant influence toward the corporate leverage. This result is in accordance with pecking order theory that suggest firm size has inverse relation with corporate leverage. It is assumed that bigger firm size have been around longer and are better known
From the result of t test can be interpreted that can be interpreted that tangibility, does have positive relationship with corporate leverage but not significant.The positive correlation between tangibility and corporate leverage is in accordance with static trade-off and agency cost theories. Tangible asset is valued higher by the outsider since it can be used as collateral. Hence, according to static trade-off theory, firms with high level of tangible asset will expect lower cost of bankruptcy and those firms expected to have higher level of debt. Similarly, agency cost predict that firm with higher tangible asset will find difficulties to substitute the projects because its asset may be seized by debt holder if firms cannot meet interest obligation. However, based on statistical analysis, tangibility does not significantly influence the corporate leverage. The indication of this result is because of the tangibility assets are often illiquid and hard to be deployed (Campello & Giambona, 2011). Therefore, creditors consider that tangible asset is difficult to use as credit collateral especially in the tight economy. Firms may face the credit friction (small, unrated, and low payout firms) in the point of view of creditor. Hence, the relationship between tangibility and corporate leverage is not significant.
tendency to change from low risk investment to high risk investment project. Bondholder will be reluctant to give debt to high growth opportunity firms.
CONCLUSION
This research aims to investigate Indonesia publicly listed firms‟ capital structure from 2009-2013, by examining determinants (profitability, firm size, tangibility, and growth opportunity) influence toward firms corporate leverage. The result of this study found that profitability, firm size, tangibility, and growth opportunity simultaneously have influence toward the Indonesia Firms corporate leverage. However, when the independent variable is tested individually, each determinant has the significant influence toward corporate leverage except tangibility. The rationalization of this result is because tangible asset often illiquid and hard to be redeploy as collateral when the corporation need borrowing. Therefore, tangibility does not have significantly influence to corporate leverage in Indonesia publicly listed firms.
Further, the relationship between determinants (profitability, firm size, tangibility, and growth opportunity) and corporate leverage is being scrutinized in this research. Profitability, firm size, and growth opportunity have negative relationship towards corporate leverage. On the other hand, tangibility shows positive relationship toward corporate leverage. Profitability and firm size relationship with corporate leverage is in line with the pecking order theory that firms prefer to finance the investment using internal fund rather than debt. As the profitability and firm size are getting bigger, firms have able generated income to finance the project rather than borrowing from the other parties. While, tangibility and growth opportunity relationship can be explained using static trade-off theory and agency cost theory. Firm with high level of tangible asset will expect lower cost of bankruptcy and those firms expected to have higher level of debt. Moreover, firm with higher tangible asset will find difficulties to substitute the projects because its asset may be seized by debt holder if firms cannot meet interest obligation. While, high growth opportunity firm will have to face higher cost of financial distress. Hence, firms prefer not to issue debt since there is higher risk of default. Besides, growth opportunity will worsen the agency conflict between bondholder and shareholder especially in the case of wealth transfer. Therefore, bondholder will be reluctant to provide credit to the firm with high growth opportunity. It may be concluded that Indonesia publicly listed firms‟ capital structures are mainly influence by profitability, firm size, and growth opportunity.
REFERENCES
Antoniou, Guney, & Paudyal. (2002). Determinants of Corporate Capital Structure: Evidence from
European Countries. Centre for Empirical Research in Finance, 1-31.
Antoniou, Guney, & Paudyal. (2008). The Determinants of Capital Structure: Capital Market-Oriented versus Bank-Oriented Institution. The Journal of Financial and Quantitative Analysis, 59-92.
Baker, & Martin. (2011). Capital structure and corporate financing decisions: theory, evidence,. John Wiley & Sons.
Biro Analisa Anggaran dan Pelaksanaan APBN. (2014, August 21). Capaian Pertumbuhan Ekonomi Berkualitas Di Indonesia. Jakarta, DKI Jakarta, Indonesia.
Brealey, & Myers. (1988). Principles of Corporate Finance (3rd ed.). Singapore: McGraw-Hill International Editions.
Brealey, Myers, & Allen. (2014). Principles of Corporate Finance. New York: McGraw-Hill.
Campello, M., & Giambona, E. (2011). Assest Tangibility and Capital Structure.
Unpublished Working Paper, Cornell University and University of Amsterdam. Cooper, D., & Schindler, P. (2014). Business Research
Methods. New York: McGraw-Hill.
Doupnik, T., & Perera, H. (2015). International Accounting, 4th Edition. Singapore: McGraw-Hill.
Fama. (1985). What is different about banks? Journal of Monetary Economics, 29-37.
Frank, M., & Goyal, V. (2009). Capital Structure Desicion: Which Factor are Reliably Important? Wiley and Financial Management, 1-37.
Garson, D. (2013). Weighted Least Square. Statistical Associates Publishers.
Hair, J., Black, W., Babin, B., & Anderson, R. (2009).
Multivariate Data Analysis. Prentice Hall. Harris, & Raviv. (1991). The Theory of Capital
Structure. Journal of Finance, Vol.46, 297-355.
IDX. (2014). IDX Fact Book 2014. Jakarta: Indonesia Stock Exchange.
Jansen , A. (2014). Firm-Spesific Determinants of Dutch Capital Structure: The Impact of The 2008 Financial Crisis . Enschede: University of Twente.
Jensen. (1986). Agency costs of free cash flow, corporate finance and takeovers. American Economic Review, 323-339.
Jensen, & Meckling. (1976). Theory of the Firm: Managerial Behavior, Agency Costs and Ownership Sructure. Journal of Financial Economics, 305-360.
Jong, A. d., Kabir, & Nguyen , T. (2007). Capital Structure around the World: The Roles of Firm- and Country-Specific Determinants.
Rotterdam: Erim Report Series Research in Management .
Leary, & Roberts. (2005). Do firms rebalance their capital structures? The Journal of Finance, 2575-2619.
Liem, P. F. (2006). Downward Sloping Demand Curves for Stock and Leverage . Jurnal Management dan Kewirausahaan, 78-94. Lind, Marchal, & Wathen. (2012). Statistical
Techniques in Business and Economics. New York: McGraw-Hill.
Menkeu. (2014, May 7). Lima Faktor Pendorong Keberhasilan Indonesia Masuk 10 Ekonomi Besar Dunia. Retrieved from Indonesia Finance Minister Website:
http://www.kemenkeu.go.id/Berita/lima- faktor-pendorong-keberhasilan-indonesia-masuk-10-ekonomi-besar-dunia
Modigliani, & Miller. (1958). The Cost of Capital, Corporate Finance and The Theory of Investment. American Economic Review 48, 261-297.
Myers, S. (1977). Determinants of Corporate Borrowing. Journal of Financial Economics 5, 147-175
Myers, S. (1984). Capital Structure Puzzle. Journal of Finance 39, 575-92.
Nagano. (2003). Determinants of Corporate Capital Structure in East Asia: Are There Differences from The Industrialize Countries? Tokyo:Waseda University. Niu, X. (2008). Theoretical and Practical Review of
Capital Structure and its Determinants.
International Journal of Business and Management, 133-138.
Osborne, & Overbay. (2004, March 2). The power of outliers. Retrieved from Pareonline: http://pareonline.net/getvn.asp?v=9&n=6 Rajan, & Zingales. (1995). What Do We Know about
Capital Structure? Some Evidence from International Data. The Journal of Finance, 1421-1460.
Sindo News . (2013, July 24). Sektor Riil. Retrieved from Ekonomi Bisnis Sindo News Website: http://ekbis.sindonews.com/read/764692/34/i ni-50-perusahaan-terbuka-berpengaruh-di-indonesia-1374648451
Smith, & Warner. (1979). On financial contracting: An analysis of bond covenants. Journal of Financial Economics, 117-161.
Stulz, & Johnson. (1985). An anulysls of secured debt . Journal of Financial Economics , 501-521. Vatanu, S. (2012). Trade-off versus Pecking Order
Theory in Listed Companies Around The World. Annals of the University of Petroşani,
Economics, 285-292.