ETHNIC CONCENTRATION AREAS IN NEIGHBOURHOOD
PERSPECTIVE IN ENSCHEDE, THE NETHERLANDS
Rian Wulan
Research Insitute for Human Settlements, Ministry of Public Works of Republic Indonesia.
Javier Martinez
[email protected] University of Twente, Enschede
Sherif Amer
University of Twente, Enschede
ABSTRACT
Previous studies suggest that measuring ethnic segregation at a disaggregated level allows capturing variability of ethnic concentration areas within a city. However, many ignore the relative locations of each neighbourhood to identify ethnic concentration areas. It causes misidentification of ethnic concentration areas. Using the 2009 population data of Enschede, this study investigated the concentration areas at postcode level. The “scale of the neighbourhood” represents the extent of concentration influenced by population in neighbouring postcodes. Using composite population at different scales of neighbourhood, it was revealed that concentration areas at sub-city level are characterized by isolation and clustering dimensions. Few postcodes are Turkish or Moroccan concentration areas which are located outside the city center. Small number of cluster and isolated area indicates that the ethnic concentration in Enschede is relatively low. The study has advanced the hypothesis about segregation measurement, that spatial proximity to neighbouring areas has a large impact on variability of ethnic segregation.
Key words: ethnic segregation, concentration area, isolated area, cluster area, neighbourhood perspective, Enschede
ABSTRAK
Banyak studi menyatakan bahwa pengukuran segregasi etnis pada tingkat rinci dapat menggambarkan variabilitas area konsentrasi dalam suatu kota. Namun, banyak studi mengesampingkan lokasi di lingkungan sekitar untuk mengidentifikasi area konsentrasi. Hal itu menyebabkan kesalahan dalam mengidentifikasi konsentrasi area. Studi ini bertujuan mengidentifikasi area konsentrasi pada tingkat area kodepos dengan menggunakan data populasi Kota Enschede tahun 2009. “Skala Lingkungan” digunakan untuk mewakili luasan konsentrasi yang terpengaruh akibat kumpulan populasi tertentu di sekitar areanya. Beberapa area kodepos yang terletak di luar pusat kota merupakan area konsentrasi keturunan Turki atau Moroko. Sedikitnya jumlah area terisolasi dan area klaster mengindikasikan bahwa konsentrasi etnis di Enschede adalah rendah. Studi ini telah memutakhirkan hipotesis mengenai pengukuran segregasi, dimana jarak menuju area sekitar mempunyai dampak besar pada variabilitas dari segregasi etnis.
Kata kunci: segregasi etnis, area konsentrasi, area terisolasi, area klaster, perspektif lingkungan, Enschede
INTRODUCTION
Many government European cities are cha-racterized by the diversity of ethnic groups and their spatial concentration. Ethnic immigrants started to arrive to the European Union since the open door policy of the 1950s [Edgar, Doherty, and Meert, 2004] and they mostly came from
developing countries. In the Netherlands, the influx of Turkish and Moroccan immigrants (among others) in older industrial cities happened due to the demand for unskilled work [Blauw, 1991]. While well-trained native Dutch refused to take the jobs, labour immigrants saw them as opportunities for well-paid jobs that were unavailable in their home countries.
136 These ethnic immigrants settled in di-fferent parts of the urban area but tended to concentrate in just a few neighbour-hoods. This spatial concentration is usually referred as residential segregation parti-cularly when an ethnic group live to some degree separated from the rest of popu-lation [Yang, 2000]. Even though ethnic segregation level is more modest in Europe compared to the US, the number of ethnic member is still increasing in Eu-ropean cities [Edgar et al., 2004; Musterd, 2005]. For example in Enschede, the Ne-therlands, the growth of ethnic immigrants in 1997 to 2009 is higher than the growth of Native Dutch. Turkish has grown 22.7%, Moroccan has grown 21.49% while Dutch has grown 0.39% [Enschede Municipality, 2012].
One of the reasons for the attention given to issues of ethnic segregation relate to how a better understanding of this pheno-menon can better inform (or discourage) policies aiming at mixing ethnic popu-lations. The Netherlands made several attempts to apply mix neighbourhood poli-cies to spread migrant households more evenly by mixing different tenures and price level within the same development or area. [Bolt, 2009; Galster, 2007; Ireland, 2008; Musterd and Andersson, 2005]. Urban renewal becomes one of the stra-tegic actions to combat negative effect of ethnic segregation. However, there are counter arguments in applying the policy [Ostendorf, Musterd, and Vos, 2001; Van Eijk, 2010].
The analysis of ethnic segregation was ori-ginated by measuring segregation at city level summarizing the residential segre-gation phenomenon for the entire city into a single value. The most widely used mea-surement is the Dissimilarity Index [Cortese, Falk, and Cohen, 1976; Duncan and Duncan, 1955; Massey and Denton, 1987]. These measurements at city level are useful for comparing degree of segre-gation between cities (inter urban
compa-risons) or examining trends of residential segregation [Grbic, Ishizawa, and Crothers, 2010; Massey and Denton, 1987]
Other approach instead of calculating se-gregation at city level, proposed a segre-gation index at sub-city level to capture the variability within a city (intra urban comparisons) [Brown and Chung, 2006;
Deurloo and Musterd, 1998, 2001]. The concept ethnic concentration is usually used at sub-city level when a single areal unit has an overrepresentation of a certain ethnic group [Deurloo and Musterd, 1998, 2001; PBL, 2010]. Other authors di-stinguish between global and local indices instead of city and sub-city measurements [Feitosa, Camara, Monteiro, Koschitzki, and Silva, 2007; Wong, 1996]. Analysing segregation at a disaggregated level can provide understanding of ethnic segre-gation processes by identifying local va-riations. It recognizes variation of segre-gation among areal units such as blocks, census tract, postcode, or district, parti-cularly in areas with significant segre-gation.
In reality, ethnic concentration is a conti-nuous phenomenon where each individual member is distributed across the city. Members of ethnic groups live in a neigh-bourhood and interact without being limited by its areal unit or administrative boundaries. Therefore, and despite that the available data on ethnicity is discrete, measuring ethnic concentration only wi-thin a single unit ignores the influence of neighbouring areas. If an areal unit consists of few members with the same ethnic background but in all neighbouring units there are many more members with similar ethnic background, the areal unit should be also highlighted as ethnic concentration because they are part of a larger ethnic population.
137 areas by considering the influence of po-pulation in neighbouring units. The re-search question is whether ethnic members in a small areal unit (i.e. postcode) consti-tute ethnic concentration. If the neighbours are very similar, then it would appear that ethnic members in that areal unit live in an ethnic concentration. The following questi-on is whether there are characteristics of concentration areas in different proximity to neighbouring units. This paper argues that concentration areas could be captured according to different proximity units from one areal unit to several neighbouring units as representation of influence of ethnic composition to residential segre-gation.
The first part of this paper, introduction explains the methodological backround. In intra-urban comparison of residential segregation part, dimension of residential segregation at city level is explained and then it focuses on how those dimensions at city level are interpreted at sub-city level. Next section narrows down to ethnic concentration at sub-city level and neigh-bourhood perspective. The methodology explains the modification method for identifying concentration areas. The next part presents the results of the approach applied in the case of Enschede and the in-terpretation of concentration areas for resi-dents of Turkish and Moroccan back-ground. These results were discussed within an expert group meeting in No-vember 2011 and attended by three local policy makers and researchers from Enschede. Finally, in the last part conclusions are presented.
Several studies identified dimensions and measures of residential segregation mainly related to segregation at city level [Brown
and Chung, 2006; Massey and Denton, 1988; Reardon and O'Sullivan, 2004] and others related to segregation at sub-city level [Brown and Chung, 2006; Deurloo and Musterd, 1998, 2001].
Five different dimensions of segregation from Massey and Denton [1988] are widely used to measure residential segre-gation at city level. They are evenness, exposure, concentration, centralization, and clustering. Evenness is defined as the degree to which members of different groups are over- and underrepresented in different subareas relative to their overall proportions in the population. Similarly, exposure considers the likelihood of intra neighbourhood interaction among minority and majority groups within a given metro-politan area (measures potential contact).
Reardon and O’Sullivan [2004] added iso-lation as the opposite of exposure, as the chance of having the same group living side by side. Concentration is the intensity of ethnic members over certain area which relate to the total area occupied by minority groups within the metropolitan area. Centralization, is the proximity of the minority racial group to the region’s central business district. Brown & Chung
[2006] argued that centralization is needed to be excluded because current cities are no longer monocentric. Finally, clustering
138 For intra urban comparison, each se-gregation dimension is reported at areal unit level, for example a postcode area can be highlighted as an ethnic cluster when there is a predominance of a particular ethnic group in the area. Brown and Chung
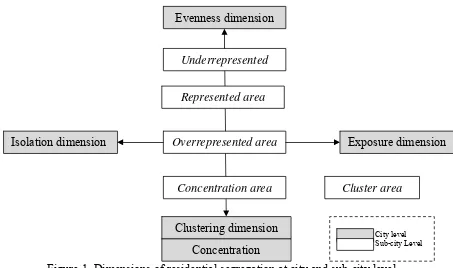
[2006] identified ethnic clusters and concentration at sub-city level based on dimension of residential segregation at city level. They argued that at sub-city level, an areal unit that is highlighted as a “cluster area” portrays the clustering-exposure di-mension while an areal unit that is high-lighted as “concentration area” portrays the concentration-evenness dimension (see Figure 1. Dimensions of residential segregation. Deurloo and Musterd [1998] used the concept of ethnic concentration to show ethnic clusters in Amsterdam. They defined a postcode as an overrepresenta-tion of Moroccan when the proporoverrepresenta-tion of Moroccan in that area is higher than proportion of Moroccan in the city plus 2 standard deviation of all proportion.
Deurloo and Musterd [1998] and Brown and Chung [2006] used underrepresenta-tion and overrepresentaunderrepresenta-tion of ethnic members as a benchmark to measure se-gregated areas. Under/overrepresentation of ethnic members relates to the concentra-tion-evenness dimensions because they refer to the distribution of a specific ethnic group over an entire urban area. Therefore, the measurement is a relative to the ethnic composition of the entire urban area. Eve-nness could be reached if there is no area highlighted as overrepresentation of cer-tain ethnic group. It means that ethnic members are distributed evenly or that each area has a proportion of a particular ethnic group lower than the total urban area.
Therefore, the dimension of segregation is not only used for inter urban comparison of residential segregation, but it can be used for intra urban comparisons. In this paper, the study of residential segregation
was focused on the concentration di-mension (Figure 1).
Residential segregation is a spatial pheno-menon, which means that the population in neighbouring areas -and the proximity to those areas- influence the pattern of segregation. However, that has not been taken into account in many studies of ethnic segregation. According to Reardon and O’Sullivan [2004], the measurement of evenness from Massey and Denton
[1988] is non-spatial because the relative locations of each neighbourhood are not considered. Other studies refer to checker-board problem to show the shortcoming of non spatial measurement [Feitosa et al.,
2007; Wong, 1996]. Similarly, Deurloo and Musterd [1998] showed ethnic concentration at postcode level without considering proximity to neighbouring postcodes. Musterd approach does not consider the phenomenon of “transfers and exchanges” where the movement of indi-vidual in space is considered to affect se-gregation in the neighbourhood [Reardon, 2006]. Therefore, the resulting measure is a non-spatial measurement. Dawkins
[2004] has proved that spatial proximity even among adjacent neighbourhoods already made a large impact on overall degree of ethnic segregation at city level.
Only few studies have focused on cooperating neighbouring units and they differed by the type of areal unit that they consider such as grid cell, census tracts or postcode level [Dawkins, 2004; Feitosa et al., 2007; Jakubs, 1981; Reardon et. al.,
139
Figure 1. Dimensions of residential segregation at city and sub-city level Source: Massey and Denton [1988]; Brown and Chung [2006]; Reardon and O’Sullivan
[2004]; Deurloo and Musterd [1998].
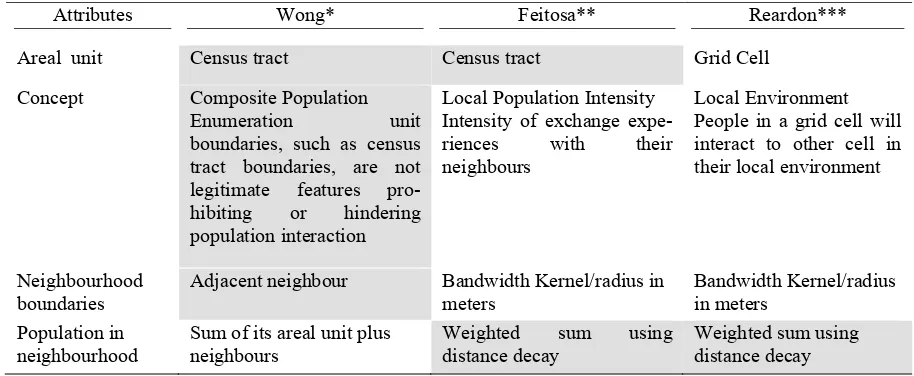
To include the population in neighbouring units, Wong [2008] developed the concept of composite population for measuring segregation at sub-city level. The compo-site population counts the population of the unit itself plus the population counts of neighbourring units. It is based upon the conceptuallization that enumeration unit boundaries are not legitimate features pro-hibiting or hindering population inte-raction. Unless there are physical barriers to prohibit interaction of population across unit boundaries, different groups in neighbouring units are not segregated and should be counted as if they are in the same unit. Wong [2000] used binary form (0 and 1) to differentiate neighbourhoods in adjacent and nonadjacent units. But using adjacent unit in region with very different size of census tract will reduce the uniformity of interaction. There will be area with very large and very small of neighbouring area. However, still using the same concept, it is better to use proximity to neighbouring unit since size and shape of neighbouring area varies. Distance decay is often used to weight the influence of neighbours [Feitosa et al., 2007;
Reardon et al., 2009]. The concept is that the population at nearby locations will contribute more to the concentration of ethnic groups than those in more distant locations.
In summary, there are three main references in identifying concentration as a spatial phenomenon (Table 1). Those are used as a baseline in the methods of this study.
THE METHODS
Based on the recognition that ethnic con-centration is a spatial phenomenon, this part describes a methodology to identify ethnic concentration areas in a city by considering the influence of population in neighbouring units at postcode level.
To empirically test the proposed approach, this paper used the case of Turkish and Moroccans ethnic groups in Enschede, a middle size city in the Netherlands. As a former industrial city, Enschede has been a destination for migrant labour in the beginning of 19th century. The ethnic and Evenness dimension
Isolation dimension Exposure dimension
Clustering dimension Concentration
Underrepresented
Represented area
Concentration area Cluster area Overrepresented area
140 population data was obtained from the 2009 Enschede administrative and basic registration data per postcode. In 2009, Enschede had a total population of 14,5624 and 3,737 postcode areas with the following ethnic composition: 103,572 are Dutch, 9,016 are Turkish and 2,157 are Moroccan. These are the two major ethnic groups in Enschede. The study area only includes the urban area because there are disadvantages to include rural districts into calculation. One of them is that the size of postcode areas in rural districts is too large to compare with urban districts [Desriani, 2011].
A relative measurement was used to judge whether an ethnic group is overrepresented in a postcode area compared to the whole city. Those areas were highlighted as concentration areas. Overrepresented areas are those where the percentages of a certain ethnic group (e.g. Turkish) in that postcode is over 2 standard deviations above the city average [Deurloo and Musterd, 2001]. This study uses two mutually-exclusive ethnic groups, Dutch-Turkish and Dutch-Moroccan. Therefore, city average is calculated from two population, Turkish and Dutch-Moroccan. The binomial standard deviation (√(p*q)/n) is used for two pair of ethnic group, where p is Turkish or Moroccan percentage, q is Dutch percentage and n is the average number of residents per postcodes. The binomial standard deviation was used because it applied to events with two outcomes (i.e native Dutch & Turkish, and native Dutch & Moroccan). Therefore, the average number of residents per postcode is calculated only for two groups. For Turkish group, the standard deviation (√(8%*92%)/(112588/3737)) is 4.94%, where overrepresentation area (8%+2(4.94%)) is higher than 17.90%. For Moroccan group, the standard deviation (√(2.04%*97.96%)/(105729/3737)) is 2.66%, where overrepresentation area is (2.04%+2(2.65%)) is higher than 7.36%.
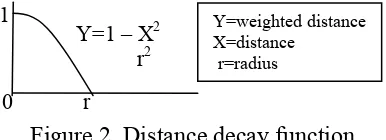
To bring the spatial and neighbourhood perspective, ethnic concentration using composite population was used as in Wong [2006] with some adjustments. To compute the population in neighbourhood area, the distance from each centroid of the postcode to the nearby centroid of postcode was measured within the specific airline radius. Euclidean distance is used to calculate the distance to neighbourhoods. Weights of the distance were calculated using the distance decay function. The distance decay function shows the influence of neighbourhoods since the po-pulation at nearby locations will contribute more to the concentration of ethnic groups than will more distant locations (Figure 2). Composite population for each postcode was calculated from distance weighted and total population of each neighbourhood.
Therefore, the “scale of the neigh-bourhood” is determined by the distance from the centroid of a postcode to neighbouring postcodes, measured through specific radiuses of influence. This represents the influence of population in neighbouring postcodes into the ethnic concentration of certain group in any given postcode area. To see the effect of segregation at different scales of neighbo-urhood, this study used several radiuses; 0, 200, 400, 600, and 800 meters. Radius 0 meter refers to a non-spatial measurement that does not consider the influence of neighbouring units. The radius of 800 meters was used as the maximum radius because it was assumed that ethnic concentration in Enschede will not cluster over 800 meter.
Figure 2. Distance decay function
Following is an example: supposing that postcode A has 10 Turkish and 40 Dutch
141 residents. Within 200 meters radius from the centroid of postcode A to the neigh-bouring postcodes’ centroids, there are 20 Turkish and 10 Dutch inhabitants. Then the composite proportion of the postcode is 10+20 (total Turkish) divided by 50+30 (total population), equalling to 37.5%. Because the composite proportion is higher than 17.90% (2 SD above the city average), then postcode A is an area of Turkish overrepresentation within 200 meter from their residence.
The resulting ethnic composition for both the Turkish and the Moroccan population was calculated, mapped and classified into five categories:
1.No inhabitant area (value 0);
2.Underrepresented area (>0 and city average);
3.Represented area (>=city average and <city average +1 standard de-viation) the composite proportion is relatively similar to the compo-sition to the city average;
4.More represented area (>=city ave-rage +1 standard deviation and <city average +2 standard devia-tions).
5.Overrepresented area (>=city average +2 standard deviations)
there is considerable deviation from the overall proportion.
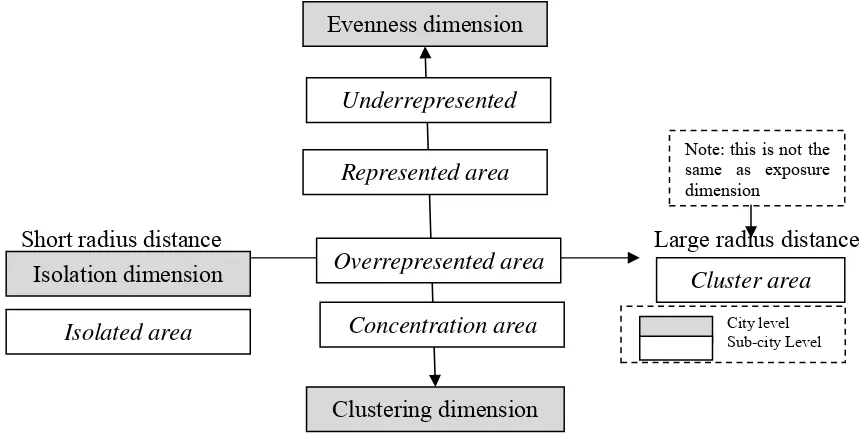
As we argue that ethnic composition at sub-city level is a spatial measurement in nature; ethnic concentration using neigh-bourhood perspective can capture other dimensions of residential segregation. With the combination of composite population and overrepresented area, it is more feasible to capture isolation and clustering dimensions at sub-city level (Figure 3). According to the definition of clustering and isolation (see previous section), those dimensions are related to distance. The areal unit inhabited by a certain group (clustering) is delineated by radius distances. Meanwhile, isolated areas only occur at short radius distance. Iso-lated area is an area having overrepre-sentation of an ethnic group and they are concentrated far from other many members of same group. In the scale of neighbourhood, isolated areas were repre-sented by overreprerepre-sented areas at zero meters which become underrepresented areas at larger scale (i.e 200 m, 400 m, 600 m and 800 m).
Table 1. References in identifying concentration areas
Attributes Wong* Feitosa** Reardon***
Areal unit Census tract Census tract Grid Cell
Concept Composite Population
Enumeration unit boundaries, such as census
tract boundaries, are not legitimate features pro-hibiting or hindering population interaction
Local Population Intensity Intensity of exchange expe-riences with their neighbours
Local Environment People in a grid cell will interact to other cell in their local environment
Neighbourhood boundaries
Adjacent neighbour Bandwidth Kernel/radius in meters
Bandwidth Kernel/radius in meters
Population in neighbourhood
Sum of its areal unit plus neighbours
Weighted sum using distance decay
Weighted sum using distance decay
142
Changes at different scale of neigh-bourhood
This section shows the influence of the different neighbourhood scales and the re-sulting changes in the measures of ethnic segregation. The spatial ethnic concentration changes depending on the distance to neighbouring postcodes which is considered. There are many postcode areas that still become overrepresented
areas and others become non overrepresented areas in larger scale of neighbourhood. This is because population within postcode area is influenced by population in neighbouring postcodes. Figure 4 shows that a spatial measurement could reveal areas which are part of a concentration of certain ethnic group in their neighbourhood.
Figure 3. Characteristic of concentration areas using scale of neighbourhood
Figure 4. The hypothetical configuration of neighbourhood perspective Overrepresentation of an ethnic group at 0 m
Underrepresentation of an ethnic group at 0 m Underrepresented area at 200 m
Overrepresented area at 400 m Clustered within 400 m
Overrepresented area at 200 m Overrepresented area at 400 m
Clustered within 200 m Clustered within 400 m Overrepresented area at 0 m
Underrepesented area at 200 m Isolated area
200
200 m
(A) (B) (C)
Evenness dimension
Short radius distance Large radius distance
Clustering dimension
Underrepresented
Represented area
Concentration area
Cluster area Overrepresented area
Isolated area
Isolation dimension
Note: this is not the same as exposure dimension
143 The hypothetical configuration (A) highlights an overrepresented area at zero scale which becomes underrepresented area at 200 meters scale. This area is isolated area since it is surrounded by areas with low number of their ethnic members in the neighbourhood. At city level, isolation refers to the distance to the same ethnic members. At sub-city level, isolated area means an area with overre-presentation of an ethnic group but not part of a larger concentration. In the same sense, isolated area is an ethnic concentration with a low chance of having the same group near concentration areas. Those areas which overrepresented at zero scale and underrepresented at 200 meter scale surely will stay underrepresented at a larger scale. This is influenced by the decay function, reducing the effect of a high proportion of ethnic members located further away.
The hypothetical configuration (B) highli-ghts an area which is underrepresented at 200 meters scale but becomes overre-presented at 400 meters scale. It means that ethnic members at that area are part of ethnic concentration in their neigh-bourhood within 400 meters.
The hypothetical configuration (C) hi-ghlights an area which is overrepresented at 200 meters scale and stay overre-presented at 400 meters scale.
RESULTS AND DISCUSSION
When comparing Turkish and Moroccan concentration areas, it should be noticed that each group has its own ethnic percentage at city level. Percentages for each category can be seen in Table 2. Ethnic percentage to Dutch between Turkish and Moroccan are totally di-fferent, where Turkish is 8.00% and Mo-roccan is 2.04%. Therefore, Turkish and Moroccan groups have different minimum percentages as thresholds for overrepre-sentation areas, which are 7.90% for
Turkish group and 7.36% for Moroccan group.
Table 2. Ethnic percentage for each category
Represented area >=8.01 and <12.95
Table 3. shows the number of postcodes which have overrepresentation of Turkish and Moroccan population. At zero meter scale, there are 598 postcodes with overre-presentation of Turkish population. From 200 to 600 meters scale, the number of overrepresented areas becomes lower and at 800 meters scale there are no overre-presented areas. It shows that the maximum scale of Turkish cluster areas is within 600 meters scale of neighbourhood. However, for Moroccan, maximum scale of concentration is 400 meters. There are no more Moroccan concentrated areas at 600 and 800 meter scale of neigh-bourhood.
Table 3. Number of postcodes and ethnic percentages for overrepresented
areas
Scale
Turkish areas Moroccan areas Post* Perc** Post* Perc** *) number of postcodes which has overrepresentation of certain ethnic group **) percentages of postcode which has overrepresentation of certain ethnic group
144 discussed for each ethnic group, the Turkish and the Moroccans. Ethnic concentration areas are characterized by cluster and isolated areas and interpreted by referring to expert group discussion.
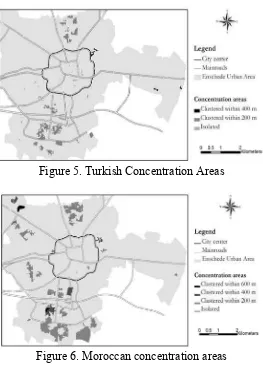
Turkish concentration areas in Enschede - Figure 5. shows the Turkish concentration areas at different scales of neighbourhood. The concentration of Turkish groups is mostly located in two areas at southern and northern part of Enschede.
The spatial pattern of concentration areas can be explained by the immigration path of the two predominant Turkish groups in Enschede: the Turkish-Islamic and the Christian (Suryoye). The Turkish-Islamic group came as labour immigrants in late 1960 while the Suryoye group came as refugees during the period 1975 – 1980 [Schukkink, 2003]. This time of arrival had made the location of both groups settled in different areas. Turkish-Islamic concentra-tions are found in Deppenbroek and Twekkelerveld (Northern part of Ensc-hede). Those areas were built in industrial expansion era in 1950. Kempen [1998] argued that in medium cities (e.g. Ensche-de), concentration of labour immigrants are found in the early post-1945 areas. They are predominantly of publicly rented houses in apartment blocks. The time of arrival is not the only reason of location difference between Turkish Islamic and the Suryoye. Pre-existing conflicts in Turkey is another reason. This causes unwillingness to interact with each other which lead to polarization of their resi-dential area.
Members of the Suryoye group were mostly asylum seekers who fled from the Islamic government in Turkey. They came at a later stage than the Turkish Islam group and they settled on the southern part
of Enschede. They are clustered within 800 meter located in Wesselerbrink Noord-West neighbourhood.
“Rental houses in the south areas were regularly offered for sale and, through intermediaries within their own circle, came into the hands of Suryoye families.”[Schukkink, 2003, p. 9]
The concentration area in the northwest part of Enschede is predominantly the University of Twente area. There are Turkish descendants living in rental rooms, who cater to university students. They clustered within 600 meters which still is inside the university area. The cluster is probably due to the high proportion of Turkish to Dutch students because the placement for most foreign students have been choosen by scholarship provider while for most Dutch students are living outside the university area.
Other clusters appear in the northeast part of Enschede. Those areas are part of post war neighbourhoods. Yücesoy [2006] explained that in the Netherlands many Turkish moved to post war neighbourho-ods that were left by social climbers who moved to the newly planned neigh-bourhoods.
145
Figure 5. Turkish Concentration Areas
Figure 6. Moroccan concentration areas
Moroccan concentration areas in Enschede - Figure 6 shows the Moroccan concentration areas at different scales of neighbourhood. Only a few Moroccan overrepresented areas occur at 400 meter scale of neighbourhood and there is no overrepresented area at higher than 400 meter scale. At 600 and 800 meters scale of neighbourhood, there is no postcode area with composite population over 7.35%.
Those small cluster areas are located at Wesselerbrink Noord-Oost. After the re-cruitment of Mediterranean groups ended in 1976, family reunification had led to high fertility rate for Moroccans [Blauw, 1991]. This coincides with the last period of urban growth in Enschede where housing development mostly was directed towards suburban area in the southern part of Enschede.
There are still Moroccan concentration areas that are single unit concentration in a postcode area. In total, there are 20 isolated areas which located spread in three districts. Moroccan isolated areas are located at centre and southwestern part of Enschede. However, unlike Turkish, there is no indication that the Moroccans is isolated because of group differences within the Moroccans.
CONCLUSIONS
146 concentration areas (Turkish and Moro-ccan) is located outside the city centre. Also the number of concentration areas varied depending on the neighbourhood scale. Wong [2005] has shown that the degree of segregation will decline as the neighbourhood scale extends. Therefore, the higher the scale of neighbourhood, the lower the number of concentration areas.
The Turkish group is concentrated up to a radius of 600 meter while the Moroccan group is concentrated up to a radius of 400 meter. This indicates that the ethnic conce-ntration in Enschede is relatively low. It is in line with the degree of segregation that was measured at city level (0.34 from maximum 1 for segregation in [2005] by
Marlet and Woerkens [2006].
Identifying concentration areas using neighbourhood perspective is a relative measure to the city average and useful for intra-city comparisons. It depends on the total ethnic population and the ethnic composition. Therefore, a postcode area cannot be directly compared among different ethnic group segregation measu-res, i.e. Turkish segregation to Dutch and Moroccan segregation to Dutch. However it is suitable for identifying the changes of spatial concentration for each ethnic group.
We have specifically looked at cha-racteristic of concentration areas which are clustering and isolation. Rather than trying to measure each segregation dimension per se, using neighbourhood perspective could capture two dimensions of residential se-gregation, isolation and clustering at sub-city level. The proposed neighbourhood perspective can reveal the pattern of
cluster and isolated areas as characteristics of concentration areas.
Identification of cluster and isolated areas at a certain period could be used as a pa-rameter to evaluate housing and segre-gation policy. Although there are few cluster and isolated areas in Enschede, there is an increasing growth of Turkish and Moroccan residents compared to Dutch growth. Laan Bouma-Doff [2007] explained that areas where level of ethnic concentration is high have to apply social inclusion activities rather than housing mix policy. In this paper, high level of ethnic concentration areas is represented by cluster. Therefore, by identifying cluster and isolated areas, we could classify ethnic concentration areas with appropriate policies.
Turkish and Moroccan concentration areas in Enschede could be related to several factors. The first is the history of housing development causing the distribution of available houses, especially rental houses for ethnic immigrants. The second is the history of immigrants’ arrival such as time arrival or reason arrival. The third is intermediaries’ circle where houses were regularly offered to their ethnic group.
Finally, the interpretation of the result from neighbourhood perspective needs local knowledge concerning neigh-bourhood characteristics, on-going urban processes, and historical paths. A mixed-method approach that incorporates qua-litative data such as focus group discu-ssions with ethnic groups can provide a better understanding of the ground-level reality of ethnic concentration.
REFERENCES
Blauw, W. (1991), Housing Segregation for Different Population Groups in the Netherland, In E. D. Huttman (Ed.), Urban housing segregation of
147 Bolt, G. (2009), Combating residential
segregation of ethnic minorities in European cities, Journal of Housing and the Built Environment, 24 (4), 397-503.
Brown, L. A., and Chung, S. Y. (2006), Spatial segregation, segregation indices and the geographical perspective, Population, Space and Place, 12(2), 125-143.
Cortese, C. F., Falk, R. F., and Cohen, J. K. (1976), Further Considerations on the Methodological Analysis of Segregation Indices, American Sociological Review, 41 (4), 630-637.
Dawkins, C. J. (2004), Measuring the spa-tial pattern of residenspa-tial segregation.
Urban Studies, 41 (4), 833-851.
Desriani, R. W. (2011), Assessing Residential Segregation Profiles for Ethnic Groups in Enschede, the Netherlands. Master of Science thesis, University of Twente, Enschede.
Deurloo, M. C., and Musterd, S. (1998), Ethnic Clusters in Amsterdam, 1994-96: A Micro-area Analysis, Urban Studies, 35(3), 385-396.
Deurloo, M. C., and Musterd, S. (2001), Residential profiles of Surinamese and Moroccans in Amsterdam,
Urban Studies, 38(3). 467–485.
Duncan, O. D., and Duncan, B. (1955), A Methodological Analysis of Segre-gation Indexes, American Socio-logical Review, 20 (2), 210-217.
Edgar, B., Doherty, J., and Meert, H. (2004), Immigration and Homele-ssness in Europe, The Policy Press University of Bristol, Bristol.
Enschede Municipality (2012), Buurtmo-nitor. Retrieved September 2012 http://enschede.buurtmonitor.nl.
Feitosa, F. F., Camara, G., Monteiro, A. M. V., Koschitzki, T., and Silva, M. P. S. (2007), Global and Local Spatial Indices of Urban Segre-gation, International Journal of Geographical Information Science,
21 (3). 299–323.
Galster, G. (2007), Neighbourhood Social Mix as a Goal of Housing Policy: A Theoretical Analysis, International Journal of Housing Policy, 7 (1), 19-43.
Grbic, D., Ishizawa, H., and Crothers, C. (2010), Ethnic residential segre-gation in New Zealand, 1991-2006,
Social Science Research, 39 (1), 25-38.
Ireland, P. (2008), Comparing Responses to Ethnic Segregation in Urban Europe. Urban Studies, 45 (7), 1333-1358.
Jakubs, J. F. (1981), A distance-based segregation index, Socio-Economic Planning Sciences, 15 (3), 129-136.
Laan Bouma-Doff, W. v. d. (2007), Confined Contact: Residential Se-gregation and Ethnic Bridges in the Netherlands, Urban Studies, 44 (5-6), 997-1017.
Marlet, G., and Woerkens, C. v. (2006),
Atlas 2006 voor Gemeenten, Sti-chting Atlas 2006 voor Gemeenten, Utrecth.
148 Massey, D. S., and Denton, N. A. (1988),
The Dimensions of Residential Se-gregation, Social Forces, 67 (2), 281-315.
Musterd, S. (2005), Social and Ethnic Segregation in Europe: Levels, Cau-ses, and Effects, Journal of Urban Affairs, 27 (3), 331-348.
Musterd, S., and Andersson, R. (2005), Housing Mix, Social Mix, and Social Opportunities, Urban Affairs Re-view, 40.
Ostendorf, W., Musterd, S., & Vos, S. D. (2001), Social Mix and the Neighbo-urhood Effect, Policy Ambitions and Empirical Evidence, Housing Stu-dies, 16, (3).
PBL (2010), Nieuwbouw, verhuizingen en segregatie: Effecten van nieuwbouw op de bevolkings samenstelling van stadswijken, Planbureau voor de Leefom- geving, Den Haag.
Reardon, S. F. (2006), A conceptual fra-mework for measuring segregation and its association with population outcomes, In J. M. Oakes & J. S. Kaufman (Eds.), Methods in social epidemiology, Jossey-Bass.
Reardon, S. F., Farrell, C. R., Matthews, S. A., O'Sullivan, D., Bischoff, K., and Firebaugh, G. (2009), Race and space in the 1990s: Changes in the geographic scale of racial residential segregation, 1990-2000. Social Science Research, 38, 55-70.
Reardon, S. F., and O'Sullivan, D. (2004), Measuring of Spatial Segregation,
Sociological Methodology, 34, 121-162.
Schukkink, J. (2003), De Suryoye: een verborgen gemeenschap; een histo-risch-antropologische studie van een Enschedese vluchtelingengemeen-schap afkomstig uit het Midden-Oosten, University of Amsterdam, Amsterdam.
Van Eijk, G. (2010), Unequal networks: Spatial segregation, relationships and inequality in the city, IOS Press.
Wong, D. W. S. (1996), Enhancing segre-gation studies using GIS, Compu-ters, Environment and Urban Systems, 20(2), 99-109.
Wong, D. W. S. (2000), Changing local segregation of selected U.S. metro-politan areas between 1980 and 2000, Retrieved 8 November 2010, from http://geog.gmu.edu/seg/
Wong, D. W. S. (2002), Modeling Local Segregation: a Spatial Interaction Approach, Geographical and Envi-ronmental Modelling, 6, 81-97.
Wong, D. W. S. (2005), Formulating a Ge-neral Spatial Segregation Measure,
The Professional Geographer, 57 (2), 285-294.
Wong, D. W. S. (2008), A Local Multidi-mensional Approach to Evaluate Changes in Segregation. Urban Geography, 29 (5), 455-472.
Yang, P. Q. (2000), Ethnic Studies: Issues and Approaches, State University of New York Press, New York