A. Method of the Research
Descriptive method was used in carrying out this research. Descriptive
method can be defined as a method that is intentionally done to collect
information about a phenomenon as in the pure condition. Descriptive method
does not need administration and a control toward a treatment. It is only to
describe an authentic condition, not to examine a hypothesis (Arikunto,
2010:262).
To do with this, there are several kinds of descriptive method such as
survey studies, case studies, developmental studies, follow-up studies,
documentary analysis, and correlational studies (Arikunto, 2010:150).
Furthermore, this research used survey study to find out and explore types
and levels of motivation of EFL learners at Faculty of Education and Teacher
Training of an Indonesian private university. The reason why this survey
study was chosen better than other kinds of descriptive method was that it
was more economic and faster in presenting the research data. In addition, it
is a benefit when identifying characteristics of a population based on a small
group of individuals (sample) (Fowler (2002) as cited in Creswell, 2013:217).
Survey studies include cross-sectional and longitudinal studies using
questionnaires or structured interviews for data collection, with the intent of
Creswell, 2003:14). Specifically, the kind of survey study used in this
research was cross-sectional survey where the researcher collected data one
by one in one time (Creswell, 2013:217).
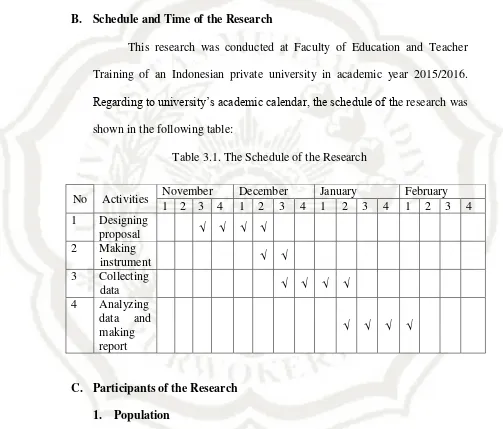
B. Schedule and Time of the Research
This research was conducted at Faculty of Education and Teacher
Training of an Indonesian private university in academic year 2015/2016.
Regarding to university’s academic calendar, the schedule of the research was
shown in the following table:
Table 3.1. The Schedule of the Research
C. Participants of the Research 1. Population
Third semester EFL learners of Faculty of Education and Teacher
Training in academic year 2015/2016 were chosen as the population in
this research except English Education Department learners. English
Education Department learners were excluded because learners coming
and they study English in every semester. It is different from other
departments, learners coming from those departments study English
when they are on the first-four semesters with the same English material
of each. Those learners have the same characteristics and competences as
they have passed the test (including English test) to enter the university
and they are all third semester learners.
Additionally, eight departments of Faculty of Education and
Teacher Training were chosen with the number of third semester learners
of each department namely Indonesian Education Department = 124,
Mathematics Education Department = 87, Biology Education Department
= 39, History Education Department = 18, Civics Education Department
= 15, Geography Education Department = 33, Elementary Education
Department (PGSD) = 276, Early Childhood Education Department (PG
PAUD) = 13. Learners coming from those departments are categorized as
EFL learners because there is English lecture in their syllabuses in the
first-four semesters. The total numbers of third semester EFL learners of
eight departments of Faculty of Education and Teacher Training in
academic year 2015/2016 are 605 learners in this research.
2. Sample
Since the population of this research was more than 100 subjects,
this research took 25% from the population as samples. The samples got
non-English majors of Faculty of Education and Teacher Training in
academic year 2015/2016.
3. Sampling Technique
This research used probability sampling, specifically simple
random sampling to take samples from the population. It is called simple
random sampling because the researchers take samples randomly from
the population. It is done if the number of population is considered
homogenous (Sugiyono, 2012:120). Those third semester EFL learners of
eight departments of Faculty of Education and Teacher Training in
academic year 2015/2016 are considered homogenous because they have
passed the test (including English test) to enter the university, they are
studying English and they are all also third semester learners.
Additionally, all eight departments consist of one class except three
departments namely Indonesian Education Department, Mathematics
Education Department, and Elementary Education Department which
have several classes of third semester learners due to the number of
learners. All classes of third semester learners of those three departments
are considered homogenous because there is no consideration in putting
learners from class A to E. Therefore, two classes were chosen to take
samples namely class A and B from Mathematics and Indonesian
Education Departments and three classes of Elementary Education
well. The way this research chose learners as samples in every class was
by taking the odd learners’ number.
Because this research needed 151 participants to be the samples,
on the other hand, the proportion of learners of each department was
different, this research pursued the following calculation to take the
samples from each department so that the taken samples were
proportional:
Indonesian = 124/605 x 151 = 30.94 = 31
Mathematics = 87/605 x 151 = 21.71 = 22
Biology = 39/605 x 151 = 9.73 = 10
History = 18/605 x 151 = 4.49 = 4
Civics = 15/605 x 151 = 3.74 = 4
Geography = 33/605 x 151 = 8.23 = 8
Elementary = 276/605 x 151 = 68.88 = 69
Early = 13/605 x 151 = 3.24 = 3 +
SUM = 151
(adapted from Sugiyono, 2012:130)
D. Technique of Data Collection
To collect the data, this research used questionnaire to know the
learners’ types and levels of motivation. This research only used
questionnaire as the mean to collect data because it was the most appropriate
technique to collect the intended data. Indeed, to get the complete and
objective data needs several techniques to collect the data, but if one
technique is considered enough and able to answer research questions, other
used techniques will be inefficient (Creswell, 2013:231; Sugiyono,
1. Questionnaire and Likert Scale
The questionnaire in this research was “closed” questionnaire.
The reason why this research used “closed” questionnaire was because it
was appropriate to restrict the respondents’ answers to the expected
answers and it also helped respondents respond the questions / statements
fast, it was easier in analyzing the data toward collected questionnaire as
well (Sugiyono, 2012:201).
To know types and levels of motivation, motivational
questionnaire was administered. It consisted of two types of motivation
namely integrative motivation and instrumental motivation. This research
followed Gardner’s types of motivation. The reason why this research
followed Gardner’s types of motivation was because a lot of research
dealing with types of motivation used these types. Furthermore, the
previous research done in Indonesia also used Gardner’s types.
Eventually, this research’s findings could confirm or rebut the findings of
the previous research.
The total number of items in the questionnaire were 26, it was in
line with Sugiyono’s (2012:202) suggestion that whenever researchers
want to construct a questionnaire, it is better to give questions or
statements between 20 – 30 items in order not to make respondents feel
saturated and tired in filling it, so that respondents will fill it honestly and
In the questionnaire, the items were rated on a five-point Likert
scale ranging from “Strongly disagree” to “Strongly agree” with the
following values assigned to the rating options: “Strongly disagree” = 1,
“Disagree” = 2, “Neither agree nor disagree” = 3, “Agree” = 4, “Strongly
agree” = 5. To know levels of motivation, high score indicated high
levels of learners’ motivation.
Several items of questionnaire were taken and adapted from
relevant research (e.g., Alrabai, 2014; Dornyei, 1994; Dwinalida et al.,
2015; Gardner, 1985). The questionnaire was administered in Bahasa
Indonesia, the learners’ native language, to eliminate the risk that limited
English competence of some respondents would affect their ability to
respond all questions / statements.
a. Validity of the Instrument
This research used grille and indicators to acquire validity of
the instrument. Consultation to the expert, Dr. Furqanul Aziez,
M.Pd, was also done as well to obtain a really steady research
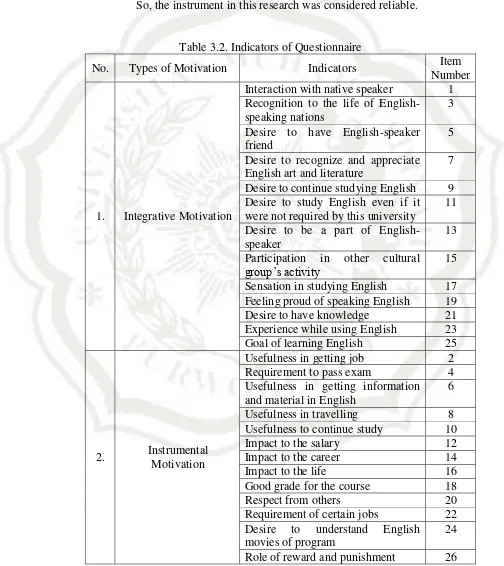
instrument. Table 3.2. was the grille and indicators of the instument.
b. Reliability of the Instrument
To acquire reliability of the instrument, this research
administered the instrument twice to the part of population (N=20)
which were, of course, not the samples within two weeks as the gap.
It was done after the validity of the instrument was acquired. Having
scores of each item of the instrument from the first administration
and the second administration were almost the same (see appendix).
So, the instrument in this research was considered reliable.
Table 3.2. Indicators of Questionnaire
No. Types of Motivation Indicators Item
Number
1. Integrative Motivation
Interaction with native speaker 1 Recognition to the life of
English-speaking nations
3
Desire to have English-speaker friend
5
Desire to recognize and appreciate English art and literature
7
Desire to continue studying English 9 Desire to study English even if it were not required by this university
11
Desire to be a part of English-speaker
13
Participation in other cultural
group’s activity 15
Sensation in studying English 17 Feeling proud of speaking English 19
Desire to have knowledge 21
Experience while using English 23
Goal of learning English 25
2. Instrumental Motivation
Usefulness in getting job 2
Requirement to pass exam 4
Usefulness in getting information and material in English
6
Usefulness in travelling 8
Usefulness to continue study 10
Impact to the salary 12
Impact to the career 14
Impact to the life 16
Good grade for the course 18
Respect from others 20
Requirement of certain jobs 22 Desire to understand English
movies of program
24
E. Technique of Data Analysis
This research used percentage and descriptive analysis including mean
and standard deviation to analyze the data.
1. The percentage formula is as follow:
𝑃 = 𝑁 × 100%𝑋
Where:
2. Descriptive Analysis
The collected data were subjected to descriptive analysis
including mean and standard deviation, which were computed to identify
learners’ types of motivation. Learners’ types of motivation were
assessed based on learners’ responses using the mean scores of types of
motivation examined in this research. To determine the mean, the
following formula was used:
𝑀 =
Σs
𝑁
Where:
P = Percentage of Students Respond
F = Number of Students who answered an item
N = Total Number of Students
M = the mean
Ʃs = the total of scale
To make the calculation of mean and standard deviation easier,
Microsoft Excel 2016 was used. Microsoft Excel is one of Microsoft
Office applications which has function to number processing. It is
utilized by many calculation features in the form of formulas. Once a
formula is created, the other data may be processed automatically.
Furthermore, the results were calculated and analyzed using Microsoft
Excel 2016 as well.
To measure the levels of motivation, the data interpretation which
was in the form of mean was used based on the following guide:
1.0 – 3.0 = lowly motivated
3.1 – 4.0 = moderately motivated
4.1 – 5.0 = highly motivated