White paper:
Process Capability
Process capability is a tool used to formally assess whether pharmaceutical equipment, instruments or processes are fit for purpose with respect to specifications, in-process limits or
manufacturer’s claims.
Introduction
Fit for purpose
A key outcome of pharmaceutical validation studies is proving equipment, instruments and processes that are involved in the manufacture or testing of regulated materials are fit for purpose.
Fit for purpose means that a system consistently performs the process it was designed to do when operated within normal limits. It can be quantified statistically by determining and measuring parameters with respect to acceptance limits.
Process capability studies
Most parameters associated with manufacture and test measurement have a natural or normal distribution about an average value. The behavior of these parameters can be modeled and give accurate predictions for how well the parameter is controlled within defined limits. Accurate predictions can be made with small sample sets of data points (approximately twenty) using standard statistical functions such as those in MS Excel.
This analysis is known as a process capability (Cp) study. The system variance, expressed as 3 standard deviations above and below the system average (6 Sigma), is compared with the set limits of the parameter.
6 Sigma value Outcome
6 Sigma spread fits within the limits exactly Process capability is 1
6 Sigma spread easily fits within the limits Process capability is greater than 1 6 Sigma spread is greater than the limits Process capability is less than 1
Note that 6 Sigma, or 3SD above and below the average, represents (statistically) 99.7% of all data produced by the system. Consequently, it can be inferred that a process capability of 1 is equivalent to in-specification results 99.7% of the time.
In life science applications, it is usually desirable to have greater assurance of process capability than 99.7%. Unfortunately, there is no set value of process capability which is
universally considered as acceptable. An appropriate minimum process capability value should be chosen after evaluating the risks.
Process Capability and Validation
Process capability can be used as a statistical method for validation studies. The design of the testing method should ensure that errors and biases are minimised. The key quality
parameters associated with the system under consideration should be investigated as suitable candidates for the process capability study.
For example, tablet weight is a key quality attribute for a tablet press because of its direct relation to the amount of active in the tablet.
The process capability value can then be used in the acceptance criteria. It is expressed as: parameter limit (expressed as a range)
> chosen process capability, Cp 6 x standard deviation spread
The formula indicates that the parameter limit must be greater than the standard variance range by a factor equal to the process capability value. If so, the process capability study shows that the parameter is controlled to the level considered appropriate for its risk category.
Selecting Suitable Parameters
A common mistake made when assessing data statistically is failure to assess the suitability of the proposed statistical tool for the data distribution. For process capability, it must be
determined if the parameter is distributed normally. If not, a process capability study based on the normal distribution model is likely to give inaccurate results.
Also, a normally distributed parameter will not behave predictably if operated under non-steady state conditions. For example, a tablet press process capability study on weight tolerance will over-estimate the true variance if the operator has changed the compression setting at some point during the test run. (It should be noted, however, that periodic system adjustment may be an appropriate mitigation strategy where process capability is less than desirable).
Other influences, external to the system under test, can affect how the parameter behaves. These influences must be eliminated in order for the study to generate results that are applicable only to the system.
A histogram is a graphical representation of the number of data points per interval across the data range. The following diagram compares theoretical normal distribution curves with three histograms and draw conclusions relating to the data.
Good fit: Data are modeled well by the normal
distribution curve.
Bad fit: Data are skewed to the lower values.
Bad fit: Data are centered
around two “means”.
The graphs above show the resolution you get when 28 data points are used. The graph plots
look a bit “clunky” but you can still see whether the fit is good. The excel HISTOGRAM function
can be used to arrange raw data into “bins” and perform the count. The Excel function NORMDIST is used to calculate the normal distribution plot points to get a “bell curve”.
There are other statistical methods available to determine the suitability of the model.
Using Data with Different Distributions
If the data do not fit the normal distribution as observed graphically, then investigate to identify the reasons. This type of investigation may uncover problems associated with the process. For example, data showing two peaks could indicate that operators are using two separate
techniques in a manual process. Also, if a process produces Quality Control (QC) test results, a twin peak could be explained by sample testing that occurs on different days after receipt for a material that degrades with time. Consequently, the samples taken on the day after receipt will show a distribution about a lower mean.
There is no point continuing with a process capability study if the data show skewing, multiple
Basic Statistics Concepts
The table below shows the basic concepts used as the foundation for process capability. The normal distribution model is used as the basis for analysis because it models natural variation.
Term Description MS Excel Function
Mean Also known as average. AVERAGE(range)
Standard Deviation (SD) or Sigma
A method used to standardize the collective variance of points in a sample which allows comparison with other samples. Standard Deviation of a sample is used to estimate the population deviation.
STDEV(range)
Histogram Visual representation (usually a bar graph) of the spread of data over the range.
HISTOGRAM
or use COUNTIF(range, condition)
Cp Process Capability (simplified) is the comparison of the allowable range with the 6 Sigma spread of data in a sample. The value derived from the division is the process capability (index or ratio).
Specified Range (Upper limit - Lower limit) / 6*STDEV
Probability distribution function
One way to illustrate the natural variation is by showing the probability distribution function. Diagram 1 below shows the standard distribution with:
mean = 0
Intuitively, the graph shows that there is a higher probability of data points with a value close to that of the mean, and conversely, a lower probability of data points with values significantly higher or lower than the mean.
Probability of occurrence
The area under the graph gives the probability of occurrence. For example, the probability of an event occurring outside the ±2 Sigma limits is 2.3% +2.3% = 4.6% or equivalent to one Out Of Specification (OOS) occurring for every 20 data points collected. The excel function
=NORMDIST(-2, 0, 1, TRUE) was used to calculate this.
Use of the Excel function NORMDIST can be confusing, because it calculates the accumulative probability of the function to the left of the value entered. NORMDIST calculated for positive 2 Sigma gives: = NORMDIST(2, 0, 1, TRUE) results in 0.977 (or 97.7%).Note also this is a 2 tail distribution. For a 1 tail distribution the probability of exceeding 2 Sigma is double the value. The standard deviation of sample data from a population is the basis upon which process capability is founded. The following table shows some of the attributes of various values of process capability, Cp. For the sake of simplicity, the units used in the table are arbitrary and not related to real data. It is assumed that the data are centred in the specified range.
Standard
From the table above, when the standard deviation is such that 6*SD is equal to the specified range, then the Cp is equal to 1. This means the specified range (limits) are ±3SD. When the variance is this value, an OOS can be expected once every 370 data points. This is a high occurrence rate. If the parameter under measure was fill weight, the process capability would most certainly be unacceptable.
When the standard deviation is 0.8, then 6*SD is equal to 4.8. The specified range is still given as 6, but now is equivalent to 7.5SD (±3.75SD), because the SD is smaller. The process capability value is equal to 1.25 and therefore, an OOS can be expected once every 5655 data points. This limit still seems unacceptable for a parameter such as fill weight or tablet weight. It may be acceptable for processes with less frequent events or as an alert limit.
Acceptance Limits
–
Alert and In-Process Limits
If the validation test is an Operational Qualification or Performance Qualification test, then the limits will likely be in-house alert limits that are set appropriately and have a corresponding
procedure that prompts a response to ‘trim’ the process to bring it back to target. So far, the
analysis has assumed that the parameter variance is centered in the specified range. This is not exclusively the case as parameters can drift from the target
As shown above, when a parameter drifts from centre, the probability of an OOS increases. The acceptance limits chosen for the acceptance criteria in a validation test must be also be set with the final product QC test parameters. The process must be sufficiently controlled to
prevent final product QC test failures.
Many of the final QC test methods are derived from pharmacopoeias and incorporate
Acceptable Quality Level (AQL) tests that are based on normal distribution models. These AQL
tests can be ‘recalculated’ as Cp limits for comparison with system capability.
Choosing a Cp Value
Choosing a Cp value for acceptance criteria should be based on an appropriate risk assessment as every different Cp value corresponds to a different OOS frequency of occurrence.
For example, consider a finished product having a batch size of 100,000 units, with 3 batches per week. By choosing a Cp of 2, it predicts an OOS of every half billion units. There will be 14.4 million units produced per year, resulting in one expected OOS every 35 years. This Cp limit may be acceptable as a final product quality limit.
On the other hand, if the Cp value is to represent an in-house alert limit, then it does not need to be set at a high value. It should be set at a value where the occurrence of OOS due to natural variation is low enough to be acceptable and concurrently provides a timely alert if a problem arises which causes the process performance to drift or deteriorate.
Using the finished product example above, the choice of Cp value as an in-house alert limit must be balanced between OOS due to natural variation and sensitivity to undesirable changes in the process.
In this example, we choose to have no ‘false positive’ OOS in any samples due to natural
Over a 40 hour week, this gives 160 samples for the 3 batches produced in a week, based on an assumption of one production machine. Therefore, there will be 7,680 samples taken per year. If we chose a Cp value of 1.5, referring to the table above, we would have 1 OOS every 147160 units and thus, we would expect an OOS every 19 years in the sample set. This would appear to be acceptable and ensures that when an OOS is detected in a sample, it is highly likely to be attributable to abnormal operation.
Therefore, choosing a Cp value of 1.5 as an in-house alert limit can be used by a production department as an early warning of performance issues, measured by the quality parameter. The final quality limit of Cp = 2 is unaffected by the in-process limits and the performance of the system also is unchanged.
Designing the test and gathering data
Before beginning to test, the performance of the equipment/system subject to the process capability study must be fully understood. Preliminary testing needs to be conducted to either:
confirm that the equipment/system can meet the manufacturer’s specifications or, if it is an existing system, that it can meet the existing in-house limits.
At this point, an assessment of the data distribution should have been performed to ensure that the distribution is as expected and that there are no biases, excessive outlying data, multiple peaks, etc.
The test method should specify the sample size and justify why it is suitable. Refer to the discussion on errors below. As a rule of thumb a sample size of 20 units is considered to be a minimum.
Crucial considerations as part of test method design are the: duration of the test run, and
frequency of sampling.
The test must isolate the performance of the system. If the test duration is performed across different shifts or intermediate materials batches, operators, start/stop, etc, the data are at risk of bias due to external effects.
The aim of determining the duration of the test is to eliminate potential biases or data
Using Excel functions
The following Excel functions (version 2010) can be used to perform a basic process capability study.
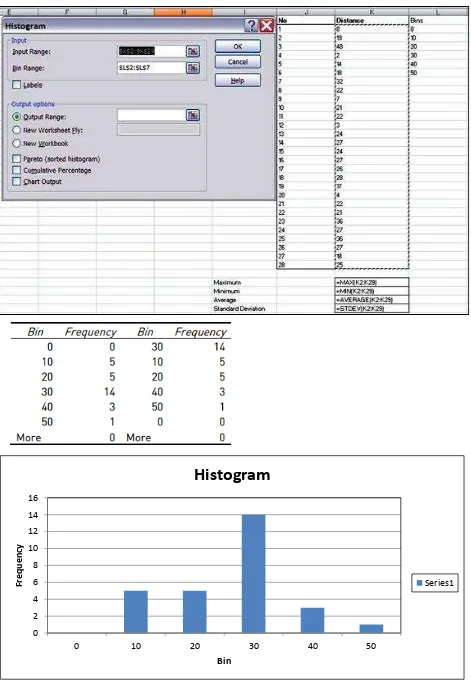
The figure below shows a data set with sample size of 28 data points.
The screen shots show the use and syntax of the:
MAX
MIN
AVERAGE
STDEV functions
The derived values using Excel are:
MAX = 48
MIN = 2
AVERAGE = 21.61
STDEV = 10.49
Note: Firstly, load the Analysis Toolpak needs to be loaded if it does not appear as
“Data Analysis” menu option. Refer to the
following link:
http://office.microsoft.com/en-us/excel-
Figure 4: Output of the histogram function
1. 2. 3. 4.
0 2 4 6 8 10 12 14 16
0 10 20 30 40 50
Fr
e
q
u
e
n
c
y
Bin
Histogram
Process capability errors
In this White Paper, a sample size of 20 units has been given as a minimum for the purposes of
providing a reasonable estimate of the ‘population’ standard deviation.
The Excel function, STDEV, is intended to be used as a sample estimate and has the term √(n-1) in the denominator. Compare this with the standard deviation for a population (STDEVP in
Excel), which only has the term ‘√n’ in the denominator. This is called Bessel’s correction and
adjusts for a bias in the sample estimate of the standard deviation. The discussion is outside the scope of this White Paper.
This discussion on process capability has not considered the errors associated with the sample
mean when it is used to estimate the ‘true’ mean. In the case of a tablet compression machine
or filling machine, the mean is interpreted as a target or setpoint that an operator is required to set up. It is therefore up to the operator to centre the spread of data within the limits to
minimise the risk of exceeding the specified limits. The machine capability is the degree of data spread, and the centering of data is generally procedurally controlled and not part of a
machine’s physical capability.
For cases where the mean or target/setpoint affects the outcome of the study, then confidence limits must be set for the mean. This is outside the scope of this White Paper.
Conclusion
The analysis of data is indispensable in determining the suitability of process/quality parameters as candidates for further statistical investigation. For the vast majority of
parameters encountered in the pharmaceutical industry, understanding the concept of standard deviation and applying it to the measure of parameter variability, is all that is needed to draw useful conclusions regarding the ability of a system to control that parameter.
References
Statistical Methods for Engineers and Scientists. A.C. Bajpai, I.M. Calus, J.A. Fairley, Published by Wiley
Sources
PharmOut is an international GMP consultancy serving the Pharmaceutical, Medical Device and Veterinary industries. PharmOut specialises in PIC/S, WHO, United States FDA, European EMA, and Australian TGA GMP consulting, engineering, project management, training, validation, continuous improvement and regulatory services.
Our team includes international GMP experts who have previously held leadership roles within regulatory bodies.