Rice Yield Estimation Using Landsat ETM+ Data and Field
Observation
I Wayan Nuarsa (Corresponding author)
Faculty of Agriculture, Udayana University
Kampus Bukit Jimbaran 80361, Bali, Indonesia
Tel: 62-361-703-602 E-mail: [email protected]
Fumihiko Nishio
Center for Environmental Remote Sensing, Chiba University
1-33 Yayoi-cho, Inage-ku, Chiba-shi 263-8522, Japan
Tel: 81-043-290-3836 E-mail: [email protected]
Chiharu Hongo
Center for Environmental Remote Sensing, Chiba University
1-33 Yayoi-cho, Inage-ku, Chiba-shi 263-8522, Japan
Tel: 81-043-290-3859 E-mail: [email protected]
Received: July 11, 2011 Accepted: July 25, 2011 Online Published: December 29, 2011
doi:10.5539/jas.v4n3p45 URL: http://dx.doi.org/10.5539/jas.v4n3p45
The research is financed by Japan Society for the Promotion of Science (JSPS) Ronpaku, Japan
Abstract
Forecasting rice yield before harvest time is important to supporting planners and decision makers to predict the amount of rice that should be imported or exported and to enable governments to put in place strategic contingency plans for the redistribution of food during times of famine. This study used the Normalized Difference Vegetation Index (NDVI) of Landsat Enhanced Thematic Mapper plus (ETM+) images of rice plants to estimate rice yield based on field observation. The result showed that the rice yield could be estimated using the exponential equation of y = 0.3419e4.1587x, where y and x are rice yield and NDVI, respectively. The R2 and SE of the estimation were 0.852 and 0.077 ton/ha, respectively. An accuracy assessment of rice yield estimation using Landsat images was performed by comparing the rice yields from the estimation result and the reference data. The results show that the linear relationship with the R2 and SE of the estimation were 0.9262 and 0.21 ton/ha, respectively. The R2 is greater than or equal to 0.8, which demonstrates a strong agreement between the remotely sensed estimation and the reference data. Thus, the Landsat ETM+ has good potential for application to rice yield estimation.
Keyword: Rice yield, Estimation, Landsat ETM+, Remote sensing
1. Introduction
Crop yield estimation in many countries is based on conventional techniques of data collection for crop and yield estimation based on ground-based field visits and reports. Such reports are often subjective, costly, time-consuming and prone to large errors due to incomplete ground observation, leading to poor crop yield assessment and crop area estimations (Reynolds et al. 2000). In most countries, the data become available too late for the appropriate actions to be taken to avert food shortage (Sawasawa 2003, Nuarsa et al. 2005).
Satellite remote sensing has been widely applied and is recognised as a powerful and effective tool for identifying agriculture crops (Bouvet et al. 2009, Pan et al. 2010, Niel et al. 2003; Nuarsa et al. 2011). An important goal of agricultural remote sensing research is to spectrally estimate crop variables related to crop conditions, which can subsequently be entered into crop simulation and yield models (Ahlrichs & Bauer 1983). To utilise the full potential of remote sensing for the assessment of crop conditions and yield prediction, it is essential to quantify the relationships between the agronomic parameters and spectral properties of the crop (Patel et al. 1985, Nuarsa & Nishio 2007). Use of satellite spectral data for the estimation of crop yields is an attractive prospect because yield is related to crop vigour, which is related to the spectral response of the crop vigour, which in turn is related to the spectral response of the crop measured by satellite sensors (Barnett & Thompson, 1982). There are reports of various studies on the suitability of satellite data for estimating crop yields. The correlation between the spectral reflectance of crops and agronomic variables has encouraged the application of these data in crop yield models (Tucker et al. 1980, Richardson et al. 1982).
Some of the research regarding the use of remote sensing in rice yield estimation uses global resolution images, such as those from the National Oceanic and Atmospheric Administration Advanced Very High Resolution Radiometer (NOAA AVHRR), to monitor rice fields (Quarmby et al. 1993, Rasmussen 1997, Huang et al. 2002). However, the use of the global spatial resolution of satellite imaging has been restricted, particularly in small rice areas, because many types of land cover can appear in one pixel, which reduces the accuracy of the assessment (Strahler et al. 2006). In contrast, the utilisation of fine or medium spatial resolution satellite images, especially in session plants, has been limited because fewer images are available during the 120-day rice growth period (Currey et al. 1987). Landsat ETM+ has a good temporal, spatial, and spectral resolution for rice monitoring. The revisit time of Landsat ETM+ is 16 days, with a spatial resolution of 30 m. Landsat ETM+ has six bands with the same pixel size, and it has become beneficial in the development of algorithms for rice yield modelling (Christopher 2004).
The objectives of this study include the following: (1) to determine the best rice age for the relationship between rice growth parameters and rice yield; (2) to develop a model for rice yield estimation based on Landsat spectral images (NDVI); and (3) to assess the accuracy of the rice yield estimation model.
2. Study Area, Data and Method
2.1 Background and study area
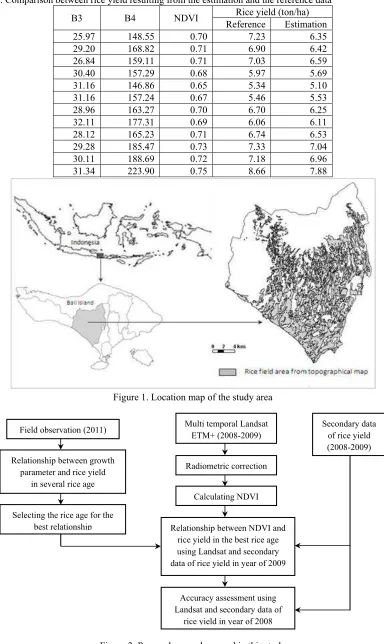
The study area was located in Tabanan Regency, Bali Province, Indonesia, at 8°31’50” S latitude and 115°02’30” E longitude (Figure 1). The Tabanan Regency was selected as the study area because Tabanan is the central area for rice production in Bali. Within the study area, rice plantings are organised by a Subak, which is a social organisation centred around farming. The Subak manages irrigation water for approximately 150 – 300 ha of rice fields (Food Crops Agriculture Department 2006). Moreover, rice fields managed by the Subak are often planted at the same time. Due to the wide rice area, this type of farming system can be easily monitored by remote sensing.
2.2 Field observation
The field observation was conducted at eight stations from the middle of January 2011 to the middle of April 2011. The geographic coordinates of the field observations are shown in Table 1. The parameters measured in the field observation consist of transplanting date, rice variety, inter-row space, inter-plant distance, fertilisers and pesticides used, rice height, level of rice leaf greenness, and rice yield. The rice height and rice leaf greenness were measured using a ruler and the Minolta SPAD-502 leaf chlorophyll meter, respectively. The rice yield sample was performed in area of 2.5 m by 2.5 m in units of kg. The rice production was then converted into units of ton/ha. The measurement of rice height and the level of rice leaf greenness was performed from rice transplanting until harvest.
2.3 Collection of secondary data for rice grain sample
planted area should be wide and easily identifiable in Landsat images; (2) the planted area should have the same rice variety; (3) the age of the rice plant exhibits the best relationship between rice growth and rice yield according to the field observation survey. A total of 26 rice yield samples were collected in this study in 2008 and 2009 (Table 2).
2.4 Landsat images
Landsat ETM+ acquired in 2008 and 2009 were used in this study. This satellite image can be freely downloaded from the NASA website (http://glovis.usgs.gov). The Landsat in 2009 was used to develop the model for rice yield estimation, and the Landsat in 2008 was utilised to assess the accuracy of the model. The total of the Landsat images used in this study are 8 scenes for both 2008 and 2009 (Table 3).
2.5 Data analysis
There are three steps to the data analysis in this study: analysis of the field observations, digital image processing of Landsat ETM+, and an accuracy assessment of the analysis results.
2.5.1 Data analysis of the field observation
A data analysis of the field observations was performed to determine the relationship between the rice growth parameters and rice yield. The rice height, rice leaf greenness, and their combinations are the main aspects of rice growth evaluated in this study. These parameters can be monitored from the satellite images using a vegetation index. A question arises when the best relationship occurs between rice parameters and rice yield. To address this question, we calculated the relationship between rice height, rice leaf greenness, and rice height times leaf greenness with rice yield at every 7 days of rice age. The highest coefficient of determination (R2) and the lowest standard error of estimation (SE) were judged as the best relationship. The R2 and SE were calculated using the following equation.
(1)
(2)
where R2, SE, y, y’, ’, and n are the determination coefficient, standard error of estimation, actual value, predicted value, average predicted value, and number of samples, respectively.
2.5.2 Landsat image processing
The first step of Landsat image processing was radiometric correction. The digital number (DN) of the Landsat ETM+ at different acquisition dates was converted to the corrected digital number (cDN) to eliminate the radiometric and atmospheric effects of the images so that they had comparable values. In this study, we used a simple radiometric correction model introduced by Pons & Solé-Sugrañes (1994). The variables used for the radiometric correction are shown in Tables 3 and 4. The form of the model is as follows:
!" # $%%%&'!" ( )*+,-./012345'678/98,5'678/9:,; (3)
(i) (if 250 < cDN 318.3; cDN = 254),
(ii) (if cDN > 318.3; cDN = 255),
(iii) (if µs 0; cDN = 255),
where cDN = corrected digital number
a = gain value of each Landsat band
DN = digital number
Kl = radiance value of zone completely under shade
d = actual Sun-Earth distance
µs = cosine of the incident angle
S0 = exoatmospheric solar irradiance
µ0 = cosine of the solar zenith angle
µv = cosine of the sensor view angle
A Landsat spectral was obtained for the location of the rice grain sampling (Table 2). The Normalized Vegetation Index (NDVI) was then calculated according to the following expression:
"!<= #
>?@ABACD+EB?D6FCD+EB?D>?@ABACD+EB?DGFCD+EB?D (4)
The red and infrared bands of the NDVI equation were band-3 and band-4 of Landsatrespectively, which were radiometrically corrected. The next step is to determine the relationship between NDVI and rice yield with the equation below:
y = f(x) (5)
where y and x are rice yield and NDVI, respectively. To develop the rice yield estimation model, we used the data of rice yield and Landsat images for 2009.
2.5.3 Accuracy assessment
An accuracy assessment was performed to determine the accuracy of the rice yield estimation obtained from the analysis of the Landsat images. The value resulting from the estimated equation (Equation 5) compared with the reference rice yield was obtained from a statistical agency (BPS, 2009). Both the rice yield from the estimated result and the reference data were plotted on the chart to determine the level of agreement between the estimated result and the reference data. Schematically, the research procedure is shown in following flowchart.
3. Result and Discussion
3.1 Relationship between rice growth parameters and rice yield based on field observations
There were three parameters of rice growth evaluated in this study: rice plant height, leaf greenness, and plant height times leaf greenness. Tables 5-7 show the field measurement of the third rice growth parameters starting from a rice age of 28 days due to the unmeasured leaf greenness in the early rice age. The trend of rice height increased from the transplanting date to the age of 77 days, and it decreased until harvest time. Similar to rice height, the greenness of the rice leaves also increased from 28 days to 56 days after transplanting and decreased until the harvesting period. For rice height times leaf greenness, the peak value mostly occurred at a rice age of 63 days.
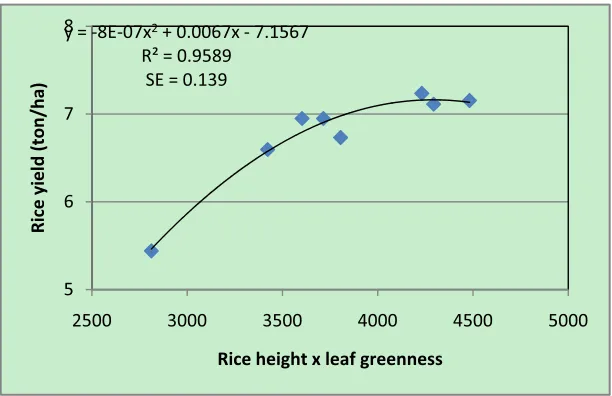
Based on the statistical analysis, the rice plants at 63 days after transplanting showed the best relationship between rice growth parameters and rice yield. From the three parameters evaluated in this study, the rice plant height times leaf greenness provided the highest coefficient of determination (R2) and lowest standard error (SE). The R2 and SE values were 0.9598 and 0.139, respectively, whereas the R2 and SE for rice height and rice leaf greenness individually were 0.8897 and 0.225 and 0.7171 and 0.364, respectively (Figures 3-5).
The height of rice plants indicates the volume of biomass, and rice leaf greenness expresses the chlorophyll content of the rice plant. The multiplication of rice height by leaf greenness illustrates the total chlorophyll content of the biomass of rice. Chlorophyll is the most important component of the rice plant for photosynthetic activity, which produces carbohydrates to form rice plant tissue and the rice grain, and it has a significant effect on the rice yield at harvesting time. Therefore, the chlorophyll content of the biomass has a close relationship with rice yield.
The highest relationship of all rice growth parameters evaluated in this study with rice yield was found at an age of 63 days. This stage of rice growth represents the peak of its vegetation index and the highest chlorophyll content in its life. This period is also a transition stage of vegetation and generation (Nuarsa & Nishio 2007).
3.2 Relationship between vegetation index of Landsat images and rice yield
The exponential relationship between the NDVI and rice yield indicates that increasing NDVI values at approximately two months will increase the rice yield. Increasing NDVI significantly improves the rice yield at an NDVI value between 0.6 and 0.75. However, above 0.75, any increase in the NDVI value produces only a slight improvement in the rice yield.
The NDVI formula is formed by the red (B3) and near-infrared (B4) bands of Landsat ETM+. The NDVI value is directly proportional to the value of the near-infrared band and is inversely proportional to the value of the red band (Equation 4). An increase of the B3 value will decrease the NDVI value, and an increase of the B4 value will increase the NDVI value. Chlorophyll pigments present in the leaves absorb the red band. The near-infrared reflectance of rice is directly related to green biomass (Casanova et al. 1998). In the near-infrared portion, the radiation is scattered by the internal spongy mesophyll leaf structure, which leads to higher values in the near infrared (NIR) channels (Baret & Guyot 1991; Harrison & Jupp 1989). Thus, high NDVI values are indicative of high chlorophyll content. Chlorophyll is the most important component of the rice plant for photosynthetic activity to produce rice plant tissues and the rice grain.
3.3 Accuracy assessment of rice yield estimation
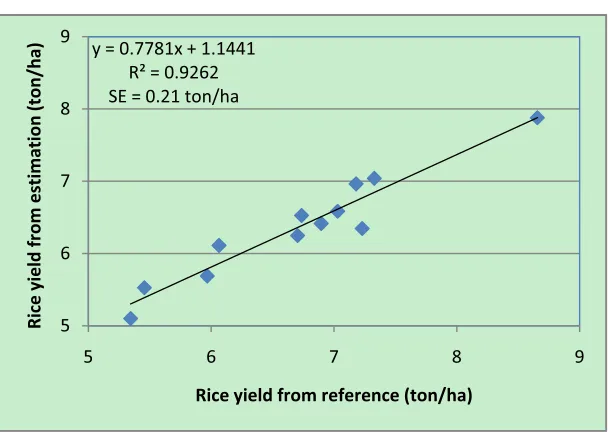
To determine the accuracy of the rice yield estimation based on the spectral value of Landsat images (NDVI), an accuracy assessment was performed. The collection procedure of the Landsat images and the rice yield sample was the same as with the development of the rice yield estimation model. The Landsat images used in this method were from 2008. The Landsat spectral values (B3, B4, and NDVI), rice yield from the reference, and rice yield resulting from the estimation equation are shown in Table 9. Based on the statistical analysis, there was a linear relationship between the referenced rice yields and the estimated rice yield with the equation y = 0.7781x + 1.1441. The R2 and standard error of the estimation were 0.9262 and 0.21 ton/ha, respectively (Figure 7). The coefficient of determination greater than or equal to 0.8 demonstrates the strong agreement between the remotely sensed estimation and the reference data (Lillesand & Kiefer 2000, Congalton et al. 1983).
3. Conclusions
The multiplication of rice height by rice leaf greenness at an age of 63 days showed the best relationship with rice yield based on the field observation. The form of this relationship was quadratic, with the equation of y = -8E-07x2 + 0.0067x - 7.1567, and the R2 and SE of the estimation were 0.9589 and 0.139, respectively. The estimation of rice yield using the vegetation index (NDVI) of Landsat ETM+ images produced an exponential relationship with the equation y = 0.3419e4.1587x, where y and x are rice yield and NDVI, respectively. The R2 and SE of the estimation were 0.852 and 0.077, respectively. An accuracy assessment of rice yield estimation using Landsat images was performed by comparing the rice yield resulting from the estimation result and the reference data. The result showed a linear relationship with the equation y = 0.7781x + 1.1441, where y and x were rice yield from the estimate result and reference data, respectively, with the R2 and SE of the estimation at 0.9262 and 0.21, respectively. The R2 greater than or equal to 0.8 demonstrates a strong agreement between the remotely sensed estimation and the reference data. Thus, Landsat ETM+ has a good potential for application to rice yield estimation.
Abbreviations
AVHRR = Advanced Very High Resolution Radiometer
B3, B4 = Band-3, Band-4
BPS = Biro Pusat Statistik (Statistical Center Agency)
cDN = Corrected Digital Number
DN = Digital Number
DOY = Day of year
ETM+ = Enhanced Thematic Mapper Plus
Landsat = Land satellite.
NASA = National Aeronautics and Space Administration NDVI = Normalized Difference Vegetation Index
NIR = Near-infrared
NOAA = National Oceanic and Atmospheric Administration
Acknowledgments
I would like to express my profound gratitude to my advisor for his invaluable support, encouragement, supervision, and useful suggestions throughout this research. I am also thankful to JSPS Ronpaku for supporting this PhD work.
References
Ahlrichs. J. S. & Bauer, M.E. (1983). Relation of agronomic and multispectral reflectance characteristics of spring wheat canopies. Agronomy Journal, 75, 987 - 993.
Baret, F. & Guyot, G. (1991). Potentials and limits of vegetation indices for LAI and APAR assessment. Remote Sensing of Environment, 35, 161-173.
Barnett, T. L. & Thompson, D. R. (1982). The use of large-area spectral data in wheat yield estimation. Remote Sensing of Environment, 12, 509-518.
BPS. (2009). Report of Monthly Rainfall of Bali Province, Indonesia. Meteorological and Geophysical Agency, 2, 45-50.
BPS. (2010). Report of Monthly Rainfall of Bali Province, Indonesia. Meteorological and Geophysical Agency, 2, 51-56.
Bouvet, A., Le Toan, T. &Lam-Dao, N. (2009). Monitoring of the Rice Cropping System in the Mekong Delta Using ENVISAT/ASAR Dual Polarization Data. IEEE Trans. Geoscience and Remote Sensing, 47, pp. 517 – 526.
Casanova, D., Epema, G.F. & Goudriaan, J. (1998). Monitoring rice reflectance at field level for estimating biomass and LAI. Field Crops Research, 55, 83-92.
Chander, G., Markham, B.L., Dennis L. & Helder, D.L. (2009). Summary of current radiometric calibration coefficients for Landsat MSS, TM, ETM+, and EO-1 ALI sensors. Remote Sensing of Environment, 113, 893-903.
Christopher Small. (2004). The Landsat ETM+ spectral mixing space. Journal of Remote Sensing of Environment, 93, 1-17.
Congalton, R.G. & Green, K. (1999). Assessing the Accuracy of Remotely Sensed Data: Principles and Practices, 43–70 (Florida: Lewis Publishers).
Congalton, R.G., Oderwald, R.G. & Mead, R.A. (1983). Assessing Landsat Classification Accuracy Using Discrete Multivariate Analysis Statistical Techniques. PERS, 49, 1671–1678.
Currey, B., Fraser, A. S. & Bardsley, K. L. (1987). How useful is Landsat monitoring. Nature, 328, 587-590.
Dozier, J. (1989). Spectral signature of Alpine snow cover from the Landsat Thematic Mapper. Remote Sensing of Environment, 28, 9-22.
Food Crops Agriculture Department. (2006). Annual report of food crops, 125–135. (Department Agriculture of Local Government).
Harrison, B. A. & Jupp, D. L. B. (1989). Introduction to remotely sensed data, 1, 65. (CSIRO Publications).
Huang, J.F, Tang, S.C., Ousama A.I. & Wang R.C. (2002). Rice yield estimation using remote sensing and simulation.Journal of Zhejiang University Science, 3, 461 – 466.
Khush, G.S. (2005). What it will take to feed 5 billion rice consumers in 2030. International Journal of Molecular Biology, 59, 1–6.
Lillesand, T. M. and Kiefer, R. W. (2000). Remote sensing and image interpretation, 715–735 (New York: Wiley & Son).
Niel, T.G.V. & McVicar, T.R. (2003). A Simple method to improve field-level rice identification: toward operational monitoring with satellite remote sensing. Australian Journal of Experimental Agriculture, 43, 379–387.
Nuarsa I.W., Kanno, S., Sugimori, Y. & Nishio, F. (2005). Spectral Characterization of Rice Field Using Multi-Temporal Landsat ETM+ Data. International Journal of Remote Sensing and Earth Sciences, 2, 65-71.
Nuarsa, I.W., Nishio, F. & Hongo, C. (2011). Spectral Characteristics and Mapping of Rice Plants Using Multi-Temporal Landsat Data. Journal of Agriculture Science, 3, 54-67.
Pan, X.Z., Uchida, S., Liang, Y., Hirano, A. & Sun, B. (2010). Discriminating different landuse types by using multitemporal NDXI in a rice planting area. International Journal of Remote Sensing, 31, 585–596.
Patel, N. K., Singh, T. P., Sahai, B. & Patel, M. S. (1985). Spectral response of rice crop and its relation to yield and yield attributes. International Journal of Remote Sensing, 6, 657 - 664.
Pons, X. & Solé-Sugrañes, L. (1994). A simple radiometric correction model to improve automatic mapping of vegetation from multispectral satellite data. Remote Sensing of Environment, 48, 191-204.
Quarmby, N. A., Milnes, M., Hindle, T. L. & Silleos, N. (1993). The use of multi-temporal NDVI measurements from AVHRR data for crop yield estimation and prediction. International Journal of Remote Sensing, 14, 199-210.
Rasmussen, M. S. (1997). Operational yield forecast using AVHRR NDVI data: reduction of environmental and inter-annual variability. International Journal of Remote Sensing, 18, 1059-1077.
Reynolds, C.A., Yitayew, M., Slack, D.C. Hutchison, C.F., Huete, A., & Petersen, M.S. (2000). Estimating crop yields and production by integrating the FAo crop specific water balance model with real-time satellite data and ground based ancilliary data. International Journal of Remote Sensing, 21, 3487-3508.
Richardson, A. J., Wiegand, C. L., Arkin, G. F., Nixon, P. R. & Gerbermann, A . H. (1982). Remotely-sensed spectral indicators of sorghum development and their use in growth. Agricultural Meteorology, 26, 11-23.
Sawasawa, Haig L.S. (2003). Crop Yield Estimation: Integrating RS, GIS, and Management Factor. A case study of Birkoor and Kortigiri Mandals, Nizamabad District India. Available on http://www.itc.nl/library/papers_2003/msc/nrm/sawasawa.pdf, 1-9 (April 10, 2011)
Strahler, A. H., Boschetti, L., Foody, G.M., Friedl, M.A., Hansen, M.C., Herold, M., Mayaux, P., Morisette, J.T., Stehman, S.V. & Woodcock, C.E. (2006). Global Land Cover Validation: Recommendations for Evaluation and Accuracy Assessment of Global Land Cover Maps. Office for Official Publications of the European Communities. Available: http://wgcv.ceos.org/docs/plenary/wgcv26/GlobalLandCover Validation_JeffMorisette.pdf (July 25, 2009.)
Tucker, C. J., Holben, B. N., Elgin, J. H. Jr., Mc- Murtrey. (1980). Remote sensing of dry matter accumulation in winter wheat. Remote Sensing of Environment, 11, 171-189.
Yang, C.M., Liu, C.C. and Wang, Y.W. (2008). Using Formosat-2 Satellite Data to Estimate Leaf Area Index of Rice Crop. Journal of Photogrammetry and Remote Sensing, 13, 253–260.
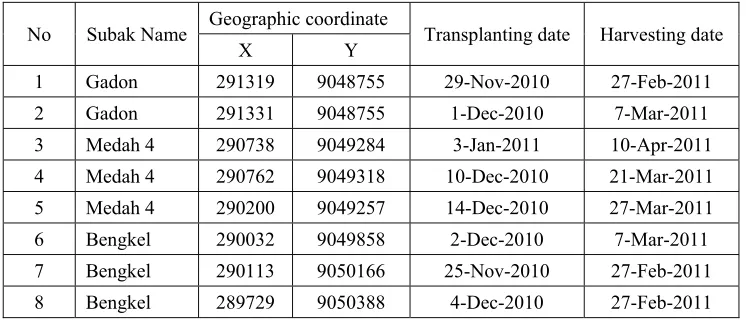
Table 1. Location coordinates, transplanting date, and harvesting date of the field observations
No Subak Name Geographic coordinate Transplanting date Harvesting date
X Y
1 Gadon 291319 9048755 29-Nov-2010 27-Feb-2011
2 Gadon 291331 9048755 1-Dec-2010 7-Mar-2011
3 Medah 4 290738 9049284 3-Jan-2011 10-Apr-2011
4 Medah 4 290762 9049318 10-Dec-2010 21-Mar-2011
5 Medah 4 290200 9049257 14-Dec-2010 27-Mar-2011
6 Bengkel 290032 9049858 2-Dec-2010 7-Mar-2011
7 Bengkel 290113 9050166 25-Nov-2010 27-Feb-2011
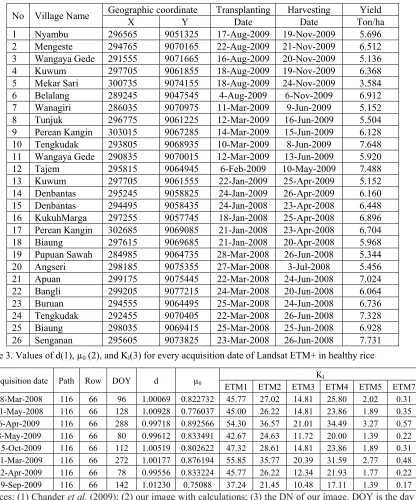
Table 2. Location coordinates, transplanting date, harvesting date, and rice yield of the secondary data
No Village Name Geographic coordinate Transplanting Harvesting Yield
X Y Date Date Ton/ha
1 Nyambu 296565 9051325 17-Aug-2009 19-Nov-2009 5.696
2 Mengeste 294765 9070165 22-Aug-2009 21-Nov-2009 6.512
3 Wangaya Gede 291555 9071665 16-Aug-2009 20-Nov-2009 5.136
4 Kuwum 297705 9061855 18-Aug-2009 19-Nov-2009 6.368
5 Mekar Sari 300735 9074155 18-Aug-2009 24-Nov-2009 3.584
6 Belalang 289245 9047545 4-Aug-2009 6-Nov-2009 6.912
7 Wanagiri 286035 9070975 11-Mar-2009 9-Jun-2009 5.152
8 Tunjuk 296775 9061225 12-Mar-2009 16-Jun-2009 5.504
9 Perean Kangin 303015 9067285 14-Mar-2009 15-Jun-2009 6.128
10 Tengkudak 293805 9068935 10-Mar-2009 8-Jun-2009 7.648
11 Wangaya Gede 290835 9070015 12-Mar-2009 13-Jun-2009 5.920
12 Tajem 295815 9064945 6-Feb-2009 10-May-2009 7.488
13 Kuwum 297705 9061555 22-Jan-2009 25-Apr-2009 5.152
14 Denbantas 295245 9058825 24-Jan-2009 26-Apr-2009 6.160
15 Denbantas 294495 9058435 24-Jan-2008 23-Apr-2008 6.448
16 KukuhMarga 297255 9057745 18-Jan-2008 25-Apr-2008 6.896
17 Perean Kangin 302685 9069085 21-Jan-2008 23-Apr-2008 6.704
18 Biaung 297615 9069685 21-Jan-2008 20-Apr-2008 5.968
19 Pupuan Sawah 284985 9064735 28-Mar-2008 26-Jun-2008 5.344
20 Angseri 298185 9075355 27-Mar-2008 3-Jul-2008 5.456
21 Apuan 299175 9075445 22-Mar-2008 24-Jun-2008 7.024
22 Bangli 299205 9077215 24-Mar-2008 20-Jun-2008 6.064
23 Buruan 294555 9064495 25-Mar-2008 24-Jun-2008 6.736
24 Tengkudak 292455 9070405 22-Mar-2008 26-Jun-2008 7.328
25 Biaung 298035 9069415 25-Mar-2008 25-Jun-2008 6.928
26 Senganan 295605 9073825 23-Mar-2008 26-Jun-2008 7.731
Table 3. Values of d(1), µ0 (2), and Kl(3) for every acquisition date of Landsat ETM+ in healthy rice
Acquisition date Path Row DOY d µ0
Kl
ETM1 ETM2 ETM3 ETM4 ETM5 ETM7
18-Mar-2008 116 66 96 1.00069 0.822732 45.77 27.02 14.81 25.80 2.02 0.31 21-May-2008 116 66 128 1.00928 0.776037 45.00 26.22 14.81 23.86 1.89 0.35 6-Apr-2009 116 66 288 0.99718 0.892566 54.30 36.57 21.01 34.49 3.27 0.57 8-May-2009 116 66 80 0.99612 0.833491 42.67 24.63 11.72 20.00 1.39 0.22 15-Oct-2009 116 66 112 1.00519 0.802622 47.32 28.61 14.81 23.86 1.89 0.31 21-Mar-2009 116 66 272 1.00177 0.876194 55.85 35.77 20.39 31.59 2.77 0.48 22-Apr-2009 116 66 78 0.99556 0.833224 45.77 26.22 12.34 21.93 1.77 0.22 29-Sep-2009 116 66 142 1.01230 0.75088 37.24 21.45 10.48 17.11 1.39 0.17 Sources: (1) Chander et al. (2009); (2) our image with calculations; (3) the DN of our image. DOY is the day of year.
Table 4. Values of !0(1), S0(2), and a(3) for every spectral Landsat band for both healthy and water-deficient rice
Band !0 S0 (Wm-2µm-1) a
ETM1 0.5 1997 0.7757
ETM2 0.3 1812 0.7957
ETM3 0.25 1533 0.6192
ETM4 0.20 1039 0.9655
ETM5 0.125 230.8 0.1257
ETM7 0.075 84.9 0.0437
Table 5. Plant height at several rice ages 63 109.36 109.97 94.05 96.93 82.70 115.54 119.64 101.10 70 113.79 114.06 102.25 103.61 90.01 119.66 123.04 103.94 77 115.14 114.99 109.81 108.72 91.26 121.02 122.90 106.34 84 113.39 112.76 116.73 112.28 95.32 119.63 119.24 108.32 91 108.56 107.38 123.02 114.28 99.23 115.48 112.06 109.86 Table 6. Greenness of rice leaves at several rice ages
Age Table 7. Height times greenness of rice leaves at several rice ages
Age Rice height x Rice greenness
I-1 I-2 II-1 II-2 III-1 IV-1 IV-2 V-1
28 1460.53 1505.43 1519.59 1409.67 2270.52 2420.17 1814.41 2330.04 35 2322.82 2273.57 2021.44 2005.09 2424.57 3085.21 2676.10 2808.12 42 3084.89 2915.10 2489.13 2554.89 2570.38 3583.01 3405.56 3193.76 49 3684.00 3396.97 2894.66 3035.21 2709.07 3937.24 3964.84 3466.01 56 4075.16 3697.29 3213.09 3426.68 2841.73 4168.30 4328.04 3607.24 63 4231.18 3805.27 3422.57 3714.40 2811.77 4293.37 4481.29 3603.13 70 4142.67 3721.29 3504.32 3887.98 3198.15 4326.40 4422.74 3442.71 77 3818.01 3456.84 3442.61 3941.52 3213.68 4278.09 4162.58 3118.29 84 3283.38 3034.54 3224.80 3873.60 3332.10 4155.90 3723.03 2625.54 91 2582.74 2488.16 2841.33 3687.29 3449.16 3964.06 3138.35 1963.44 Table 8. Samples of Landsat image pixels of B3, B4, NDVI, and rice yield
Table 9. Comparison between rice yield resulting from the estimation and the reference data
B3 B4 NDVI Rice yield (ton/ha)
Reference Estimation
25.97 148.55 0.70 7.23 6.35
29.20 168.82 0.71 6.90 6.42
26.84 159.11 0.71 7.03 6.59
30.40 157.29 0.68 5.97 5.69
31.16 146.86 0.65 5.34 5.10
31.16 157.24 0.67 5.46 5.53
28.96 163.27 0.70 6.70 6.25
32.11 177.31 0.69 6.06 6.11
28.12 165.23 0.71 6.74 6.53
29.28 185.47 0.73 7.33 7.04
30.11 188.69 0.72 7.18 6.96
31.34 223.90 0.75 8.66 7.88
Figure 1. Location map of the study area
Figure 2. Research procedure used in this study Field observation (2011)
Relationship between growth parameter and rice yield
in several rice age
Selecting the rice age for the best relationship
Multi temporal Landsat ETM+ (2008-2009)
Radiometric correction
Calculating NDVI
Relationship between NDVI and rice yield in the best rice age using Landsat and secondary data of rice yield in year of 2009
Secondary data of rice yield (2008-2009)
Accuracy assessment using Landsat and secondary data of
Figure 3. Relationship between rice height and rice yield at 63 days
Figure 4. Relationship between rice leaf greenness and rice yield at 63 days
Figure 5. Relationship between rice height times rice leaf greenness and rice yield at 63 days
Figure 6. Relationship between NDVI and rice yield at 63 days
Figure 7. Relationship between rice yield resulting from the estimation and the reference data
y=0.3419e4.1587x R²=0.852 SE=0.077
3 5 7 9
0.5 0.6 0.7 0.8
Y
ie
ld
(t
o
n
/h
a
)
NDVI
y=0.7781x+1.1441
R²=0.9262
SE=0.21ton/ha
5 6 7 8 9
5 6 7 8 9
R
ic
e
y
ie
ld
fr
o
m
e
st
im
a
ti
o
n
(t
o
n
/h
a
)