TABLE OF CONTENTS
PAGE OF APPROVAL ... i
ABSTRACT ... ii
STATEMENT OF AUTHORIZATION ... iii
PREFACE ... iv
ACKNOWLEDGEMENTS ... v
TABLE OF CONTENTS ... vii
LIST OF TABLES ... viii
LIST OF FIGURES ... ix
CHAPTER I ... 1
CHAPTER II ... 8
CHAPTER III ... 23
CHAPTER IV ... 36
CHAPTER V ... 54
BIBLIOGRAPHY ... 58
LIST OF TABLES
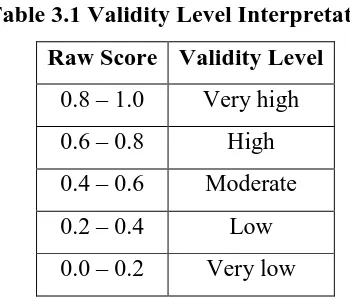
Table 3.1 Validity Level Interpretation ... 28
Table 3.2 Reliability Level Classification ... 29
Table 3.3 Difficulty Index ... 30
Table 3.4 Discriminatory Power ... 31
Table 3.5 Guide to Correlational Test ... 32
Table 3.6 Correlation Coefficient Strength ... 33
Table 4.1 Validity Test Result ... 36
Table 4.2 Reliability Result ... 38
Table 4.3KR-20 (Cronbach’s Alpha) Reliability Coefficient ... 38
Table 4.4 Difficulty Index Result ... 39
Table 4.5 Discriminatory Power Result ... 40
Table 4.6 Test of Normality ... 41
Table 4.7 Saphiro-Wilk Table ... 41
Table 4.8 Categories of Students’ Reading Comprehension Ability ... 44
Table 4.9 Descriptive Statistics of Reading Comprehension Test ... 45
Table 4.10 Text I ... 46
Table 4.11 Text II ... 46
Table 4.12 Text III ... 46
Table 4.13 Descriptive Statistics of Readability Level of Text Materials ... 47
LIST OF FIGURES
Figure 1.1 Example of a Readability Formula ... 10
Figure 4.1 Scatterplots of Readability Levels ... 42
Figure 4.2 Scatterplots of Reading Comprehension Scores ... 43
Figure 4.3 Frequencies and Classification ... 44
Figure 4.4 Readability Levels of the Sample Texts ... 47
CHAPTER III
RESEARCH METHODOLOGY
This chapter elaborates more in-depth details about the procedures applied
in conducting study which have been briefly elaborated in Chapter I. The
procedures include formulation of problem, research design, hypothesis,
participant, data collection, and data analysis.
3.1Formulation of Problem
It is necessary to formulate the problem before the research is designed.
This formulation of problem is based on the research question to ensure that the
research is designed to find the answer of the question. Because the method of this
study is correlational, only one research question is formulated. Thus, it needs to
be noted that this study attempted to figure out the answers to the question “Is
there any relationship between the readability levels of texts used as teaching
materials and vocational high school students’ reading comprehension ability?”
Additionally, it is important to note that this question includes the
investigation of whether the relationship is significant statistically and practically
if it turns out that there is a relationship between those variables.
3.2 Research Design
The research design of the present study is based on positivism paradigm
with quantitative approach. The method used is correlational as the present study
only investigates the relationship between the readability levels of text materials with the students’ reading comprehension ability in non-causative way. This is in line with the definition of correlational research, which is a study that involves
exists between two or more quantifiable variables (Gay, 1982, p. 430) as cited in
Sukardi (2008, p. 166)
To maintain the feasibility of the research, the present study will take
approximately a month to gather data from the samples. This range of time
includes development of materials for the instruments, the instrument tryout, the
test administration, and the measurement of readability. Depending on the school’s policy, the instrument will be formulated based on either the text materials from the textbook used in the school or other resources outside the
textbook. The readability of those texts will be analyzed and categorized based on
their respective level. After that, the data collection can be conducted by
employing the instrument to the samples.
As the scores result from the test are not in form of ranked data, statistical calculation using Pearson’s Product Moment formula will be used to analyze the data resulted from the test given to all of the samples. It needs to be noted that Pearson’s Product Moment formula should only be used if the data obtained are normally distributed. Other correlation measures may be used if the data are
skewed. Further details about this will be presented later in data collection and
data analysis.
3.3 Hypothesis
Prior to collecting the data needed for this study, it is important to make a
prediction about the relationship between the variables involved in the topic of the
study. In this case, the readability levels of text materials will be the X variable, while the students’ reading comprehension scores will be the Y variable. It is expected that the instrument employed to gather the data are standardized,
meaning that it is reliable and able to measure what it is supposed to measure the
relationship between both variables.
In this study, a hypothesis has been formulated in the null form. The null
hypothesis is that the readability level of texts used as teaching materials is not
Thus, in contrast, the alternate hypothesis is that the readability level of texts used as teaching materials is related to vocational high school students’ reading comprehension ability. A hypothesis testing will be administered by the use of
statistics to determine if the probability that the hypothesis is true (Weisstein,
2012).
There are several steps in hypothesis testing. First, a relevant statistical test
must be determined to assess the truth of the null hypothesis. Second, the p-value
is calculated. Assuming that the null hypothesis was true, the probability that a
statistical test at least as significant as the one observed would be obtained is
explained by the p-value. After the p-value is obtained, it is compared to an
acceptable significance alpha value. If p-value is lower than alpha value, then the
observed effect is statistically significant, the alternative hypothesis is valid, while
the null hypothesis is ruled out.
3.3 Participant
3.3.1 Population
Population is a whole subject of the research (Arikunto, 2003). As the title
of the present study suggested, the participants of this study are vocational high
school students. The present study took place in a vocational high school in
Bandung. The population of this study is the students who major in Office
Administration. There are four classes with about 120 students in total.
3.3.2 Sample
The number of students needed to be the sample is at least 30 students.
Generally, 30 samples are considered minimal in correlational studies. It is
supported by Gay et al. (2006) who assert that to establish a relationship, there
should be at least 30 participants in a correlational study. Moreover, Waters
(2014) suggests that 30 or more participants are important to increase the validity
of the study.
The samples were drawn by means of purposive sampling. A class of 35
materials from the textbook. As a matter of consideration, due to the fact that
some vocational high school has adapted the 2013 Curriculum to the first and
second grader in which the time allocation for English subject is very limited, the
sample was drawn from only one second grade class. One of the other classes was
used to conduct a pilot test.
3.4 Data Collection
As correlational studies commonly need several scores to be analyzed, one
or more valid and reliable instrument is needed. The instrument validity will
ensure that the instrument measures what it is supposed to measure, while
reliability will prove whether the instrument is reliable or not to be used as
measurement in collecting the data (Arikunto, 2003). Therefore, an instrument
trial or instrument tryout was conducted before the instrument is used to collect
the data for the present study.
There were two kinds of instrument which were used in the present study.
The first was a reading comprehension test. A class which reputed to have
averagely similar English proficiency and grade level with the samples was given
a pilot reading comprehension test. This pilot test served as an instrument tryout
to ensure reliability and validity of the test.
The second instrument was a readability formula. The formula was used to
analyze the readability of text materials the teacher implemented in the teaching
and learning process. As stated in Chapter I, the readability formula which will be
used is Coh-Metrix. This formula was chosen as a matter consideration since it
has been tested to be suitable to measure texts in EFL contexts (Crossley et al.,
2011).
3.4.9 Test Administration and Readability Analysis
The materials which were used to formulate the test were taken from three
texts on a textbook. This textbook was used simultaneously with other supporting
and ten true-and-false questions. It was formulated by mixing the types of
question that ask for main idea, specific information, synonym of word and
implicit message. Additionally, the questions were aimed to assess micro skills
adapted from Brown (2001) with no involvement of testing the students’
knowledge about generic structures of the text.
After the test was formulated, a pilot test was administered. Several
revisions on the test items were made prior to administering the test to the actual
sample. The number of students who participated as sample was 30 students out
of 35. The remaining five students were not present in the class at that time. Those
who took the test were given 30 minutes to finish it.
As for the readability analysis, both of the texts were analyzed using
Coh-Metrix. The texts were in form of argumentative text and speech with an average
range of words of 300 to 500.
3.4.5 Validity Test
As explained before, a reading comprehension test was used as a mean of
measurement to collect the data from the students. This test was in a form of
achievement test, and was intended to obtain students’ reading comprehension
scores from three different texts. Likewise, the validity and reliability of this test
were evaluated in order to create a standardized test. After the instrument tryout,
to evaluate both validity and reliability of the test, the software Anates and SPSS
were used. The score obtained by the test was then be classified into groups and
be analyzed.
In Anates and SPSS, validity was measured by processing the data
obtained from the pilot test through the use of Pearson Product Moment formula.
(NCS Pearson, 2014)
r = Pearson correlation coefficient
x = Values in first set of data
y = Values in second set of data
n = Total number of participants
A test item is considered to be valid if the robt is higher than rcrit. On the
contrary, a test item is considered to be invalid if the robt is lower than rcrit. After
the result of the calculation has been obtained, the following table was used as a
reference.
depended upon to secure consistent results upon repeated administration.
(Professional Testing Inc., 2006) It has to do with the consistency, or
reproducibility, or a test taker's performance on the test. Simply put, if a test with
high reliability is administered to a test taker on two occasions, it would be very
likely to reach the same conclusions about the test taker's performance both times.
To measure the reliability of the reading comprehension test employed in
this study, a split half method was used. Split half method only requires a set of
questions, this method will show how much error in a test score is due to poor test
construction (Arikunto, 2003). In case of this study, it was split based on the text
respectively. After that, as the contents of the instrument are dichotomous items,
the following Kuder-Richardson 20 (KR-20) formula was considered the best
accepted statistic to calculate the reliability coefficient.
(Arikunto, 2003)
Where,
pi = the proportion of correct responses to test item i
qi = the proportion of incorrect responses to test item i (so that pi + qi = 1)
Then, the following formula was used to calculate the variance for the
denominator.
Where,
n = the total sample size.
Finally, the score obtained by applying all of the formula above was
consulted to the following table.
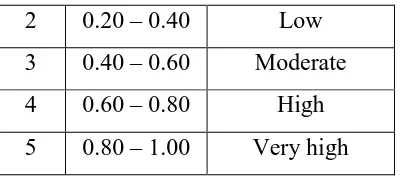
Table 3.2 Reliability Level Classification
No. Coefficient Reliability level
2 0.20 – 0.40 Low
3 0.40 – 0.60 Moderate
4 0.60 – 0.80 High
5 0.80 – 1.00 Very high
(Sugiyono, 2003)
3.4.7 Difficulty Index
To find the difficulty level of the reading comprehension test, difficulty
index is calculated. This index, according to Arikunto (2003), illustrates the value
of difficulty for each test item. Averagely, it is recommended that the level of
difficulty for a four-option multiple choice test should be between 60% and 80%.
The following formula was to calculate the difficulty index of the test.
Difficulty Index (p) = C/T
(Wilson, 2005)
p = difficulty Index
C = the number of test takers who answer item X correctly
T = the number of total test takers who answer item X
The result of the calculation was then consulted to the table below.
Table 3.3 Difficulty Index
No. Index Degree
1 0.00 – 0.30 Difficult
2 0.31 – 0.70 Moderate
3 0.71 – 1.00 Easy
(Wilson, 2005)
To measure students’ overall ability, the significance of test items was calculated based on discriminatory power. The result of the calculation using the
formula below was in a form of interpretation which was then considered in
classifying the test takers.
(Wilson, 2005)
Where
D = discriminatory power
N = the number of unrelated strains tested
S = the number of different types
xj = the number of strains belonging to the jth type, assuming that strains will be
classified into mutually exclusive categories.
The result was then consulted to the following table.
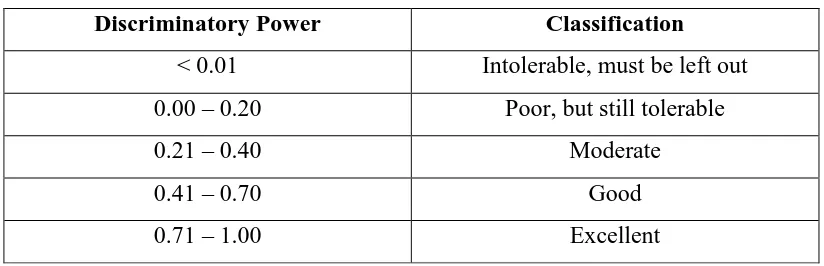
Table 3.4 Discriminatory Power
Discriminatory Power Classification
< 0.01 Intolerable, must be left out
0.00 – 0.20 Poor, but still tolerable
0.21 – 0.40 Moderate
0.41 – 0.70 Good
0.71 – 1.00 Excellent
(Arikunto, 2003)
3.5 Data Analysis
After the data were collected, they were classified, and analyzed on the
The descriptive statistics which include measure of central tendency and spread
were applied to show the mean, median, mode, range, variance and standard
deviation of the obtained data. This was done to summarize the group of data
using a combination of tabulated description, graphical description and statistical
commentary in the next chapter.
To find out the answer to the research question, the correlation coefficient
between both variables was calculated by using Pearson Product Moment formula.
The result was referred to a table of statistical significance at the minimum level
of 0.5. The use of Pearson Product Moment formula was taken into account based
on the table below.
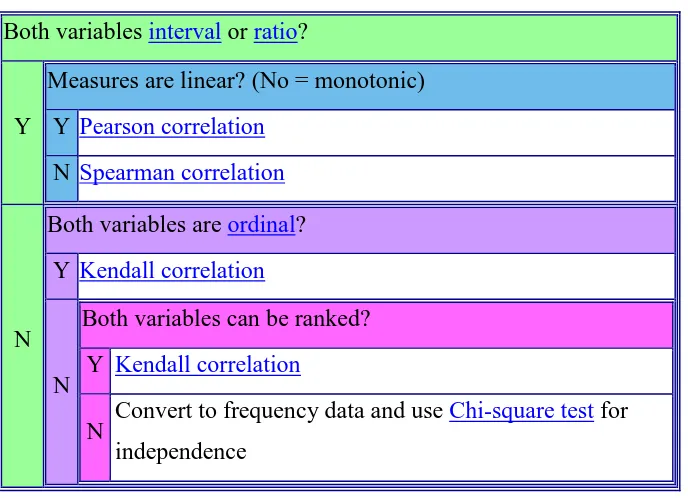
Table 3.5 Guide to Correlational Test
Both variables interval or ratio?
Y
Measures are linear? (No = monotonic)
Y Pearson correlation
N Spearman correlation
N
Both variables are ordinal?
Y Kendall correlation
N
Both variables can be ranked?
Y Kendall correlation
N Convert to frequency data and use Chi-square test for independence
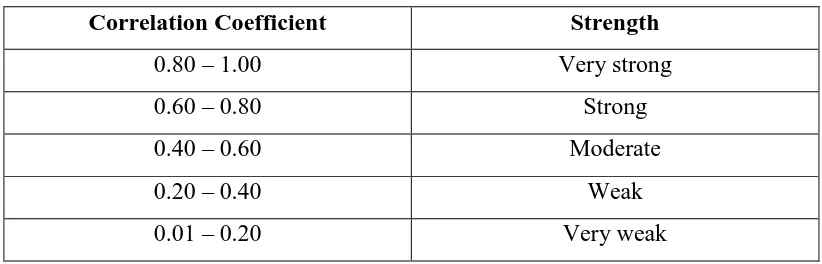
The following are Pearson Product Moment formula and a table to reveal
(NCS Pearson, 2014)
r = Pearson correlation coefficient
x = Values in first variable
y = Values in second variable
n = Total number of participants
Table 3.6 Correlation Coefficient Strength
Correlation Coefficient Strength
0.80 – 1.00 Very strong
0.60 – 0.80 Strong
0.40 – 0.60 Moderate
0.20 – 0.40 Weak
0.01 – 0.20 Very weak
Next, to determine the most appropriate correlation measure, the data were analyzed if they are normally distributed. This was done because Pearson’s correlation assumes that both of the sets of values being looked at come from
distributions that are roughly in normal shape (Kranzler & Moursund, 1999).
Further, a coefficient of determination was computed to investigate the
degree of the contribution of the readability level of text materials towards students’ reading comprehension ability. This coefficient determines how is the degree of the first variable to explain the second variable (Collidge, 2000).
The value of correlation coefficient (rxy) which has been obtained was used
to find the coefficient of determination. The computation uses the following
formula.
(Collidge, 2000)
Finally, after the data obtained by using the instruments were analyzed, the
findings were identified and discussed. They will be presented in the next chapter
along with the result of validity and reliability test, and the answers to the research
question and hypotheses.
3.6 Clarification of Terms
Prior to conducting the study, several main terms need to be clarified to
avoid misunderstandings. They are as follows.
Readability : An extent in which a text can be read and understood. This
term refers to all the factors that affect success in reading
and understanding a text. These include the complexity of
words and sentences in relation to the reading ability of
the reader; the interest and motivation of the reader; and
the legibility of the print (Johnson, 2014).
Text : Text may be defined as a stretch of language that is
semantically and pragmatically coherent in its real-world
context. On the other hand text may be defined as 'any
unchangeable sequence of sentences which has a strong
cohesion and the unchangeable character of which is
related to a value system of some sort (Pavel, 1980; Carter
& McCarthy, 2006).
Reading Ability : The skill or activity of getting information from texts,
reading ability will be arguably developed best in
association with writing, listening, and speaking as
integrated and interactive approach in language teaching
emphasize the interrelationship of skills. (Brown, 2001)
Comprehension : The process of acquiring or developing the meaning of
paragraphs, texts, and other longer materials (Otto &
Chester, 1976).
EFL : Abbreviation for English as a Foreign Language. This is a second language which is not widely used in the learners’ immediate social context, but rather one which might be
used for other particular purposes like future travel,
cross-cultural communication situations, or as a curricular
CHAPTER V
CONCLUSION AND SUGGESTION
This chapter summarizes the findings of the present study. The findings
are concluded based on the research question. Suggestions for further studies and
practices based on the findings in this study are also presented here.
5.1 Conclusion
Focusing on the relationship between readability level of text materials and vocational students’ reading comprehension ability, this study concludes that there is a moderate relationship between readability level of text materials and vocational students’ reading comprehension ability in EFL classrooms. Moreover, as described in the previous chapter, the degree of correlation was also
investigated and explained by the coefficient of determination.
Before the data were collected, a pilot test has been administered as a form
of instrument try-out. The instruments were revised based on the result of the pilot
test. After that, the actual test was administered with the actual participants. The
result shows that the test averagely has moderate validity and reliability.
Difficulty index and discriminatory power have also been found. The result is that
most test items can differentiate between higher achiever and low achiever with a
combination of easy and moderate level difficulty. It was found that with the
given test, the participants tended to have good reading comprehension ability. The data about the students’ reading comprehension ability and readability level of text materials were analyzed to investigate the relationship. This
correlation coefficient shows that readability level of text materials is related to vocational students’ reading comprehension ability in EFL classrooms. However, the coefficient is negative. Therefore, it can be concluded that variable increases
in choosing text materials explains 25.40% of vocational students’ reading
comprehension ability.
Additionally, it is relevant to the underlying theory that readability is
incapable to measure comprehensibility, the finding that the strength of
correlation is not very strong may be due to that readability is not really
appropriate to measure comprehensibility of a text. This is because readability
only takes a certain number of aspects which contributes to comprehension.
5.2 Suggestion
From the findings of this study, a negative, moderate level of correlation
between both variables was revealed. In this section, several suggestions were
drawn based on the findings in relation to the reading comprehension ability and
readability level. Hopefully these suggestions are useful as references for readers,
particularly the future researchers and the English teachers.
In helping students to cope with their reading comprehension problems,
the teacher aids should be, as stated by Ness (2010) helping in thinking abstractly,
visualization, understanding vocabulary, and knowing to properly decode. The
students must actually know and understand what they are reading. Knowledge
about vocabulary alone would not suffice. Thus, to be able to properly
comprehend what is being read, students are required to connect what is being
read to their own experiences.
Unfamiliar vocabulary as the most frequent factor that affects reading
comprehension is a consequence of using bottom-up model which confuse
students in dealing with word recognition and structure pattern represented in a
text. As the implication, teachers are suggested to use readability formula to
measure the readability level to the texts they are going to teach in classroom.
On the other hand, English teacher in vocational high school should be
aware that readability formula is not a tool to aid them writing their own
teacher-made materials. Instead, readability should be regarded as one of the aspects
possible for teachers to use this study as a reference in developing reading
instruction. English teachers will have a better understanding about the use of
readability in teaching reading. In turn, hopefully, the students can find the
suitable reading strategy to overcome the reading problems and set the best
reading method. Despite considering the existence of comprehensibility, the
awareness of underlying factors which determine readability is therefore
necessary.
In the measurement of readability level by Coh-Metrix, the higher the
value of the readability level, the higher the chance that the text is harder to read
for the students. Teachers need to make sure it will not hinder the students from
learning reading skill. Instead, the text should help the students to escalate their
reading skills. On the contrary, if it indicates a low level of readability, teachers
need to set some adjustments on their teaching method in a way that it can benefit
students to make the most of the text which is easier to read.
Aside from the findings, this study has some limitations. These limitations
include the instrument, participant, and text material. First, at shown by the pilot
test, the validity of test items employed in this study were various. But there was
no item which belongs to very high degree. Thus, it is expected to have more
valid and reliable instruments. It means that high degree of validity and reliability
are more preferred in further research regarding this topic.
Another limitation is the fact that statistical result shows that the students
participated as sample in this study were averagely good at reading
comprehension. It may be beneficial for the researchers who are interested in this
topic to have more diverse data about the students’ reading comprehension ability,
to see if there is a different result which may occur due to more diverse data of students’ reading comprehension ability. Larger number of participants is also encouraged to pursue higher validity to obtain more accurate and reliable result in
representing the whole population.
Additionally, the text materials used in this study was limited to the texts
in Indonesia. Moreover, not all texts on the book are mandatory to be taught to the
students. The teachers should and are encouraged to use and adapt the texts on the book as creative as possible by considering the students’ needs. As the readability levels of texts may vary in many different genres, more studies are called for with
different groups of learners in similar situation and context (EFL vocational high
schools, especially Indonesians) to investigate their perspectives on readability
based on the texts which they are to learn in their respective departments. Another
way is simply conducting a survey which collects different genre of texts used in
different departments. By doing this, hopefully, a particular genre which is
assumed to tend to have the highest readability level among other genres can be
Wildan Hariz, 2015
Bibliography
Agustien, H. I. (2001). Setting up new standards: A preview of Indonesia's new
competence-based curriculum. Universitas Negeri Semarang, 1-9.
Akbari, R., Atae, M. R., Marefat, H. (1999). The role of discourse elements in
determining the readability of texts. TESL Reporter, 16-27.
Anderson, N. J. (1999). Exploring second language reading: Issues and
strategies. Canada: Heinle & Heinle.
Artono Wardiman, M. B. (2008). Language in focus for grade IX junior high
school (SMP/MTs). Pusat Perbukuan Departemen Pendidikan Nasional.
Astika, G. (2007). Readings in language teaching and research. Salatiga: Widya
Sari Press.
Backhoff, E., Larrazolo, N., Rosas, M. (2000). The level of difficulty and
discrimination power of the basic knowledge and skills examination
(EXHCOBA). Revista Electrónica de Investigación Educativa, 1-16.
Bahti, T. (2013). Readibility and the holistic approach. Retrieved June 9, 2013,
from http://coerll.utexas.edu/:
http://coerll.utexas.edu/methods/modules/reading
Baker, C. (2011). Foundations of bilingual education and bilingualism (5th ed.).
Berardo, S. A. (2006). The use of authentic materials in the teaching of reading.
The Reading Matrix, 60-69.
Brown, D. (2007). Principles of language learning and teaching (5th ed.). United
States of America: Pearson Longman.
Brown, H. D. (2001). Teaching by principles: An interactive approache to
language pedagogy (2nd ed.). New York: Eddison Wesley Longman, Inc.
Brown, J. D. (1999). Relative importance of persons, items, subtets and languages
to TOEFL test variance. Language Testing, 216-237.
Burns, A., Richards, J. C. (2012). The cambridge guide to pedagogy and practice
in second language teaching. New York: Cambridge University Press.
Calvin D. Catterall, G. M. (1978). Strategies for helping students. Springfield:
Charles C Thomas.
Chaudron, C. (1988). Second language classrooms: Research on teaching and
learning. Cambridge: The Press Syndicate of the University of Cambridge.
Creswell, J. W. (2009). Research design: Qualitative, quantitative, and mixed
method approaches. Los Angeles: Sage.
Croft, K. (1960). Reading and word study for students of English as a Second
Wildan Hariz, 2015
Dale, E., Chall, J. S. (1948). A formula for predicting readability. Educ. Res.
Bull., 27, 11-20, 37-54
Darville, R., Heibert, M. (1985). Small chains court materials: Can they be read?
Can they be understood? Canadian Law Information Council, CLIC
Papers on PLEI 6.
Dj., O. S. (2013). Bahasa Inggris untuk SMA-MA/SMK Kelas X. Bandung:
YRAMA WIDYA.
DuBay, W. H. (2004). The classic readibility studies. Retrieved June 9, 2013,
from information.com:
http://www.impact-information.com/classics.pdf
DuBay, W. H. (2004). The principles of readibility. Retrieved June 9, 2013, from
http://www.nald.ca: http://www.nald.ca/library/research/readab/readab.pdf
Gay, L. R. (1987). Educational research: Competencies for analysis and
application. (3rd ed.). Columbus, OH: Merrill.
Githens. (2013). Conversation patterns. Retrieved December 19, 2013, from
http://www9.georgetown:
http://www9.georgetown.edu/faculty/bassr/githens/tannen.htm
Graesser, A., McNamara, D.S., Louwerse, M., Cai, Z. (2004). Coh-Metrix:
Analysis of text on cohesion and language. Behavioral Research Methods,
Instruments, and Computers, 36, 193-202.
Hall, J. C. (2005). The readability of original articles in medical journals.
Hamalik, O. (2008). Dasar-dasar pengembangan kurikulum. Bandung: PT
Remaja Rosdakarya.
Hasan, S. H. (2008). Evaluasi kurikulum. Bandung: PT Remaja Rosdakarya.
Hayden, J. D. (2008). Readability in the British Journal of Surgery. British
Journal of Surgery, 119-124.
Kim, Y. Y. (2007). Ideology, identity, and intercultural communication. Journal
of Intercultural Communication Research, 237-253.
Kitchens, S. A. (2010). What’s your communication style: High involvement or
High consideration? Retrieved December 17, 2013, from
http://familyoralhistory.us:
http://familyoralhistory.us/news/view/its_deborah_tannen_day_how_famil
y_communication_can_go_weird#ixzz2o1Cxsd7J
Levine, D. R., Adelman, M. B. (1993). Beyond language: Cross-cultural
communication. New Jersey: Prentice Hall Regents.
Lorch, R. F., O'brien, E. J. (1995). Sources of coherence in reading. Hillsdale:
Erlbaum.
McNamara. (1996). Coh-Metrix: An automated tool for theoretical and applied
Wildan Hariz, 2015
McShane, S. (2005). Applying research in reading instruction for adults.
Retrieved June 29, 2014, from https://lincs.ed.gov:
https://lincs.ed.gov/publications/html/mcshane/index.html.
Meador, D. (2013). Readibility. Retrieved June 9, 2013, from
http://teaching.about.com/: http://teaching.about.com/.
NCS Pearson. (2014). Pearson correlation formula. Retrieved June 30, 2014,
from http://formulas.tutorvista.com:
http://formulas.tutorvista.com/math/pearson-correlation-formula.html.
Nelson, M. B. (2003). You said this, But I heard that. Retrieved December 17,
2013, from http://www.asaecenter.org:
http://www.asaecenter.org/Resources/EUArticle.cfm?ItemNumber=11865.
Otto, W., Chester, R. D. (1976). Objective-based reading. Massachusetts:
Addison-Wesley Publishing Company.
Partowisastro, H. K. (1986). Diagnosa pemecahan dan kesulitan belajar. Jakarta:
Erlangga.
Patsy M. Lightbown, N. S. (2006). How languages are learned (3rd ed.). New
York: Oxford University Press.
Phelan, C., Wren, J. (2006). Exploring reliability in academic assessment. Journal
of UNI Office of Academic Assessment.
Pikulski, J. J. (2002). Readability. Houghton Mifflin. Retrieved June 12, 2013,
Prado, L., Plourde, L. A. (2011) Increasing reading comprehension through the
explicit teaching of reading strategies: Is there a difference among the
genders?. Reading Improvement, 32-43.
Spache, G. D. (1967). Reading in the Elementary School. Boston: Allyn and
Bacon, Inc.
Stephens, C. (2000). All about readibility. Retrieved June 12, 2013, from
http://plainlanguage.com: http://plainlanguage.com/newreadability.html
Sukmadinata, N. S. (2009). Pengembangan kurikulum: Teori dan praktek.
Bandung: PT Remaja Rosdakarya.
Tannen, D. (2007). You just don’t understand: Women and men in conversation.
Retrieved December 22, 2013, from drdouggreen.com:
Team of Five. (2006). Improving reading skill in English for university students.
Jakarta: Predana Media Group.
Tim Dosen Jurusan Administrasi Pendidikan. (2010). Pengelolaan pendidikan.
Bandung: Jurusan Administrasi Pendidikan.
Wijaya, C. (1996). Pendidikan remedial: Sarana pengembangan mutu sumber
daya manusia. Bandung: PT Remaja Rosdakarya.
Wells, G. (1999). Dialogic inquiry: Towards a sociocultural practice and theory of
Wildan Hariz, 2015
Zakaluk, B. L, Samuels, S. J. (1988). Readability: It's past, present & future.