ESTIMATION OF GENETIC DIVERSITY IN LENTIL GERMPLASM
A.K.M.M Alam1*), R. Podder1) and A. Sarker2)
1) Pulses Research Centre, Bangladesh Agricultural Research Institute (BARI) Joydebpur, Gazipur-1701, Bangladesh
2)
Lentil Breeder, ICARDA, P.O. Box 5466, Aleppo, Syria *)
Corresponding author E-mail: [email protected]
Received: May 21, 2011/ Accepted: June 24, 2011
ABSTRACT
The experiment was to determine the relation-ship between yield and yield contributing traits and select the promising genotypes. Twenty two genotypes and two check varieties were evaluated at Bangladesh Agricultural Research Institute, Joydebpur, Gazipur during Rabi season, 2008-2009 in a RCBD with three replications. Significant variation among the lentil genotypes were observed in respect of days to first flowering, days to maturity, plant height, pod/plant, 100-seed weight and yield. The genotype BLX-02009-06-3 flowered and matured earlier. Among the test entries, BLX-02009-18-3 and BLX-02009-18-1 were tall. The highest number of pod per plant was obtained in BLX-02009-04-5. The large seed size was found in LR9-130 and LR9-25. The highest yield was found in 02009-04-1 followed by BLX-02009-04-5 than the two check varieties. Difference between genotypic coefficient of variation and phenotypic coefficient of variation was small for the traits as plant height, days to significantly correlated with plant height, pods/plant, 100-seed weight at genotypic and phenotypic levels.
Keywords: lentil, genetic diversity and PCA
INTRODUCTION
Lentil belongs to the genus Lens of the viceae tribe in the Leguminosae family (Fabaceae), commonly known as the Legume.(
Chauhan, Nath and Srivastava, 2005) All members of lens are self pollinated diploids (2n= 2x=14) and annual herbaceous plants. Lens culinaris, the only cultivated species (Sindhue and Shinkard, 1985) is further divided into two major varietal types namely: micro-sperma with small seeds and macrosperma with bold seeds. In Bangladesh, all the indigenous landraces and varieties are microsperma with red cotyledons, whereas the exotic macro-sperma varieties possess yellow cotyledons. Nutritionally lentil is very rich and comple-mentary to any cereal crops including rice. It supplies about four times as much protein and eight times as much riboflavin as does rice; the calorie value of it is equal to rice. It is a versatile source of nutrients for man, animal and soil containing 25.1% protein, 59% carbohydrate, 0.5% fat, 2.1% minerals and sufficient amount of vitamins viz. vitamin A 16 IU; thiamine 0.23 mg and vitamin C 2.5 mg per gram lentil (Gowda and Kaul, 1982). Lentil in Bangladesh is generally grown under minimum fertility and management practices. The development of high potential genotypes with good, stable yield and higher protein content is important to improve yield status of this crop
Evaluation of morphological traits had established that the germplasm is constrained by low level of diversity in the working gene pool of this crop (Ramanujam, 1981). In order that the lentil gene pool to be well utilized for development of promising or superior varieties, an exhaustive characterization of the various germplasm holdings and collections that constitute the gene pools for the crop need to be fully characterized to identify the useful genetic diversity. The crosses between the parents with maximum genetic divergence are generally the most responsive for genetic improvement (Arunachalam, 1981). Genetic improvements
have contributed to the high productivity of many crops.(Aich et al.,2007, Bicer and Sakar, 2004).
Therefore, the aim of this work is to provide genetic variation and relatedness of some Lens
varieties as it is important particularly for variety selection for breeding purpose, hybridization, evaluation and conservation of the diverse gene pool. Thus the present study was conducted to study the genetic diversity of lentil genotypes in respect of agro-morphological traits, to determine the relationship between yield and yield contributing traits and to select the promising lentil genotypes.
MATERIALS AND METHODS
The research was conducted at the experimental field of Bangladesh Agricultural Research Institute, Joydebpur, Gazipur during Rabi season (November, 2008 to April 2009).
The Experimental materials included 22 promising lentil genotypes including BARI Lentil 5 and BARI Lentil 6. The experimental plot was prepared by ploughing with power tiller. The weeds and other unwanted plant materials were removed from the field during the land preparation. Proper laddering was done to bring the soil at proper tilth condition.
A randomized complete block design was used in the experiment with three replications.( Sigh and Chaudharry, 1985) The unit plot was of 0.9m×2m in size which contained two continuous rows. Row to row distance was 30 cm. Each row contained about 45-60 plants. The distance between two plots was 50 cm and the
distance between two blocks was 100 cm. Inter cultural practices were done uniformly for all the genotypes. Thinning was done 25 days after sowing and weeding was done twice, where the first weeding was done during thinning and the second weeding was after two months of sowing. Harvesting was started when 80% of the spikes of each plot reached maturity i.e. when the grains become hard and contained 14-16% moisture. Data on the following characters were collected from five randomly selected plants from the middle of the paired rows in order to avoid border effects. The recorded data on different parameters were statistically analyzed by using MSTAT software to find out the significance of variation resulting from the genotypes. The analysis of variance was done according to Goulden's methods (1959).
RESULTS AND DISCUSSION
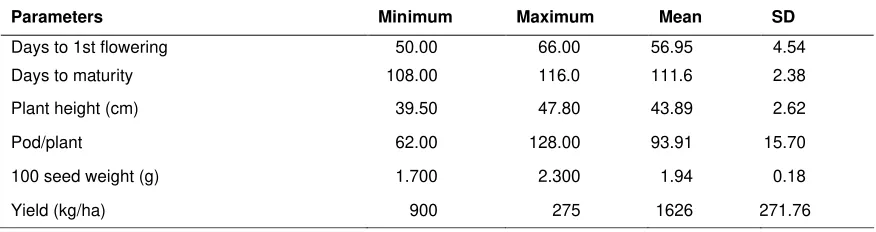
Range (minimum and maximum), mean and standard deviation of six characters of lentil genotypes namely days to 1st flowering, days to maturity, plant height, pods per plant, 100 seed weight and yield are presented in Table 1. The mean value of above parameters was 56.95 days, 111.60 days, 43.89 cm, 93.91, 1.94 g and 1626 kg/ha respectively and the standard deviation of the above parameters was 4.24, 2.38, 2.62, 15.70, 0.18 and 271.76 respectively indicating considerable variability which exists among the genotypes.
Table 1. Minimum, maximum, mean and standard deviation (SD) of different characters of 22 lentil genotypes
Parameters Minimum Maximum Mean SD
Days to 1st flowering 50.00 66.00 56.95 4.54
Days to maturity 108.00 116.0 111.6 2.38
Plant height (cm) 39.50 47.80 43.89 2.62
Pod/plant 62.00 128.00 93.91 15.70
100 seed weight (g) 1.700 2.300 1.94 0.18
Correlation Coefficient
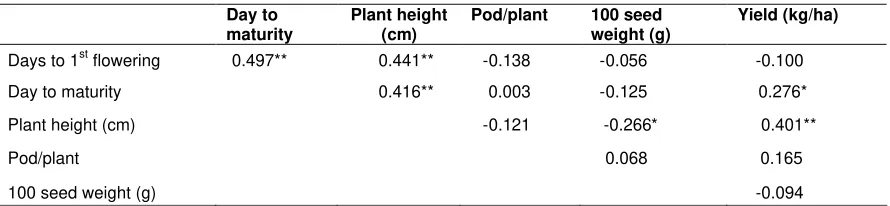
Yield is a complex product being influenced by several interdependent quanti-tative characters ( Sirohi and Sigh, 2007; Rathi, 2004). Selection for yield may not be effective unless the other yield components influencing it directly or indirectly are taken into consideration.(Singh and Gupta, 2004). Results of genotypic and phenol-typic correlation coefficient of yield and its contributing characters of different genotypes of lentil are shown in Table 3 and Table 4, and the expected character is discussed as follows: Days to the first flowering displays positive relationships with days to maturity and plant height at genotypic
and phenotypic al 1% level of significant (Table 3 and 4). Days to the first flowering shows insignificant negative asso-ciation with pods per plant, 100 seed weight and yield both at genotypic and phenotypic level. Singh et al. (1999) reported that days to the first flowering showed positive correlation with yield of okra which is in agreement with the present findings of lentil. Days to maturity displays positive relationships with plant height at genotypic and phenotypic level (Table 2 and 3). Days to maturity shows no correlation with pods per plant and no association with 100 seed weight and yield both at genotypic and phenotypic level.
Table 2. Genotypic correlation coefficient among yield and its contributing characters of different genotypes of lentil
Day to maturity
Plant height (cm)
Pod/plant 100 seed weight (g)
Yield (kg/ha)
Days to 1st flowering 0.514** 0.523** -0.148 -0.077 -0.101
Day to maturity 0.670** 0.016 -0.138 0.320*
Plant height (cm) -0.183 -0.376** 0.407**
Pod/plant 0.094 0.189
100 seed weight (g) -0.127
Remarks= * = Correlation is significant at the 0.05 level. ** = Correlation is significant at the 0.01 level.
Table 3. Phenotypic correlation coefficient among yield and its contributing characters of different genotypes of lentil
Day to maturity
Plant height (cm)
Pod/plant 100 seed weight (g)
Yield (kg/ha)
Days to 1st flowering 0.497** 0.441** -0.138 -0.056 -0.100
Day to maturity 0.416** 0.003 -0.125 0.276*
Plant height (cm) -0.121 -0.266* 0.401**
Pod/plant 0.068 0.165
100 seed weight (g) -0.094
Multivariate Analysis Principal Component Analysis (PCA)
The principal component analysis yielded Eigen values of each principal component axis of ordination of genotypes with the first accounting for the variation among the genotypes. (Charaborty and Haque, 2000) Principal component analysis was carried out with 22 genotypes of lentil. The first 3 Eigen
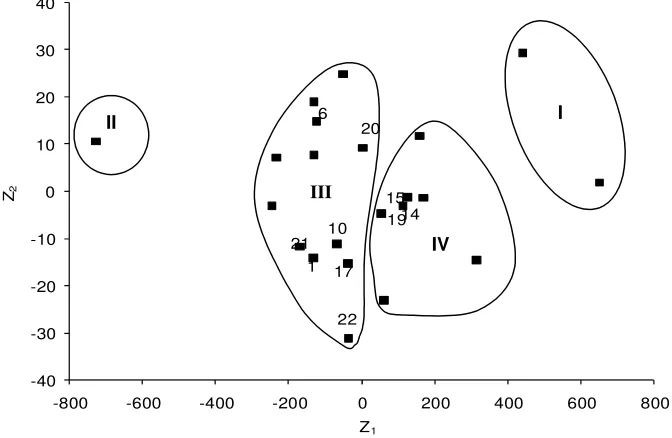
values for 3 principal coordination axes of genotypes accounted for 78.13% variation (Table 4). The first two principal axes accounted for 61.17% of total variation among the 6 characters describing 22 genotypes. Based on principal component axes I and II and principal component score Z1 and Z2, a chart (Z1-Z2) of the genotypes is presented in Figure 1.
Table 4. Eigen values and percentage of variation for corresponding 6 component characters in 22 lentil genotypes
Principal component axis
Eigen values % of total variation accounted for
Cumulative percent
I 2.381 39.69 39.69
II 1.289 21.48 61.17
III 1.017 16.96 78.13
IV 0.748 12.47 90.60
V 0.348 5.80 96.40
VI 0.216 3.60 100.00
Figure 1. Scatter distribution of 22 lentil genotypes based on their principal component scores superimposed with clusters
1 6
10 14
15
17 19 20
21
22
-40 -30 -20 -10 0 10 20 30 40
-800 -600 -400 -200 0 200 400 600 800
Z2
Z1
II
III
IV
Principal Coordinate Analysis (PCA)
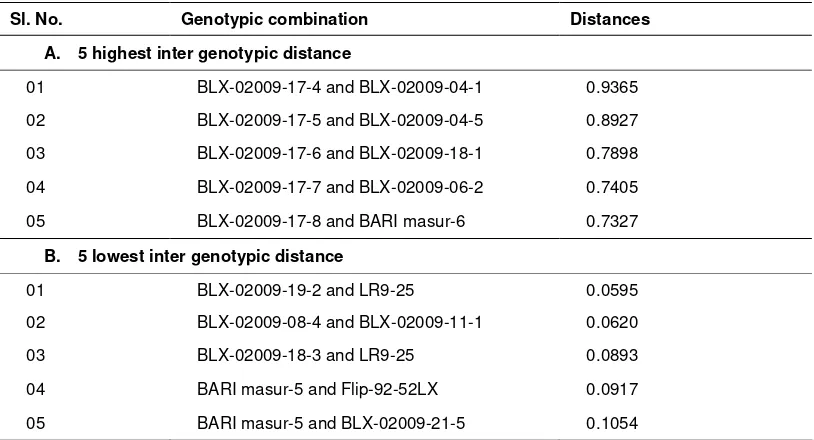
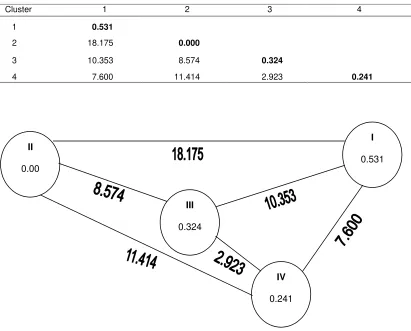
The results obtained from principal coordinate analysis show the highest inter genotypic distance between genotypes BLX-02009-17-4 and BLX-02009-04-1 (0.9365) followed by 17-5 and BLX-02009-04-5 (0.8927), and the lowest distance (0.0595) was observed between genotypes BLX-02009-19-2 and LR9-25 followed by the distance (0.0620) between genotypes BLX-02009-08-4 and BLX-02009-11-1 (Table 5). The difference between the highest and the lowest inter genotypic distance indicates the moderate variability among the 22 genotypes of lentil. The highest intra-cluster distance was recorded in cluster I (0.531) containing two genotypes (BLX-02009-04-1 and BLX-02009-04-5) (Table 7). The lowest intra-cluster distance was observed in cluster II (0.000) having one genotype viz. BLX-02009-17-4. It favored to decide that intra-group diversity was the highest in cluster I and the lowest in cluster II. Cluster III had maximum number genotypes viz. BARI masur-5, BLX-02009-06-3, BLX-02009-08-4, BLX-02009-09-4, 11-1, 16-3, BLX-02009-06-5, BLX-02009-21-5, LR9-130, Flip-92-52LX955-167, Flip-92-52LX and BARI masur-6 had an intra-cluster distance 0.324 (Table 5, Table 7 and Figure 2).
Non-hierarchical Clustering
The computations from covariance matrix gave non-hierarchical clustering among 22 genotypes and were grouped into four clusters. The clustering pattern obtained coincided with the apparent grouping patterns performed by PCA. So the results obtained through PCA were confirmed by non-hierarchical clustering. Table 6 represents the clusters occupied by 22 genotypes of lentil. It explains that cluster III contained the highest number of genotypes (twelve), cluster IV was constituted by seven genotypes, cluster I was constituted by two genotypes and cluster II was constituted by one genotype. Intra cluster mean for 6 traits is
04-5. Cluster II stood first for only one character viz. the length of days for first flowering (62.0). However, Cluster II brought the lowest seed weight (1.7 g) and Yield (900 kg/ha). Cluster III had twelve genotypes. This cluster was able to lead only one trait in respect to cluster mean value of 6 characters. The highest cluster mean value was achieved for the character of 100 seed weight (2.01 g). Cluster IV was recorded as moderate yielding associated with desired characteristics like the seed size and faster maturing.
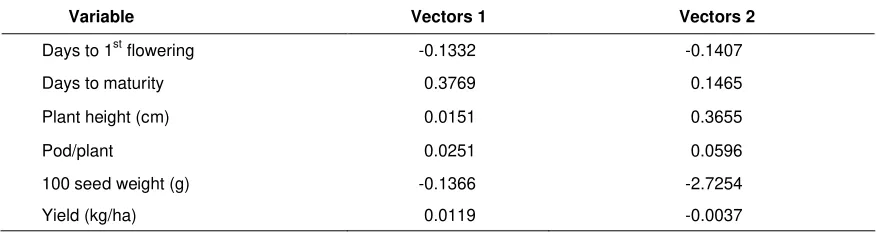
Canonical Variate Analysis
The highest inter-cluster distance (18.175) was observed between cluster I and II ( Fig. 2). intermediate distance was found between cluster II and IV (11.414), cluster I and III (10.353). That the inter-cluster distances were higher than the intra-cluster distances suggests wider genetic diversity among the genotype of yield (0.0119) which were major characters that contributed to the genetic divergence. In vector II, days to maturity (0.1465), plant height (0.3655), and pods per plant (0.0596) show their important role toward genetic divergence. The value of Vector I and Vector II reveals that both Vectors had positive values for days to maturity, plant height and pods per plant indicating the highest contribution of these traits towards the divergence among 22 genotypes of lentil. Negative values in both vectors for days to the 1st flowering, and 100 seed weight had lower contribution towards the divergence.
III are to be considered. Cluster I had the highest cluster mean for days required for maturity, plant height, pods per plant and yield. The cluster I comprised the genotypes BLX-02009-04-01 and BLX-02009-04-05. Genotype BLX-02009-17-4 in cluster II was important for
days to the first flowering and cluster III for bolder seed.
Table 5. Five highest and lowest inter genotypic distance among the 22 genotypes of lentil
Sl. No. Genotypic combination Distances
A. 5 highest inter genotypic distance
01 BLX-02009-17-4 and BLX-02009-04-1 0.9365
02 BLX-02009-17-5 and BLX-02009-04-5 0.8927
03 BLX-02009-17-6 and BLX-02009-18-1 0.7898
04 BLX-02009-17-7 and BLX-02009-06-2 0.7405
05 BLX-02009-17-8 and BARI masur-6 0.7327
B. 5 lowest inter genotypic distance
01 BLX-02009-19-2 and LR9-25 0.0595
02 BLX-02009-08-4 and BLX-02009-11-1 0.0620
03 BLX-02009-18-3 and LR9-25 0.0893
04 BARI masur-5 and Flip-92-52LX 0.0917
05 BARI masur-5 and BLX-02009-21-5 0.1054
Table 6. Distribution of 22 genotypes of lentil in four clusters Cluster Accession serial no. Genotypes or Accession number
1 2 BLX-02009-04-1 and BLX-02009-04-5
2 1 BLX-02009-17-4
3 12 BARI masur-5, BLX-02009-06-3,
BLX-02009-08-4, BLX-02009-09-4,
BLX-02009-11-1, BLX-02009-16-3,
BLX-02009-06-5, BLX-02009-21-5,
LR9-130, Flip-92-52LX955-167,
Flip-92-52LX and BARI masur-6
Table 7. Cluster mean for 6 characters of 22 lentil genotypes Cluster Variables
1 2 3 4
Days to 1st flowering 54.50 62.00 55.67 59.14
Days to maturity 115.00 111.00 111.00 111.86
Plant height (cm) 47.15 44.60 42.68 44.91
Pod/plant 115.50 97.00 92.17 90.29
100 seed weight (g) 1.80 1.70 2.01 1.90
Yield (kg/ha) 2170.00 900.00 1512.83 1768.43
Table 11. Average intra (bold) and inter cluster distances (D2) for 22 lentil genotypes
Cluster 1 2 3 4
1 0.531
2 18.175 0.000
3 10.353 8.574 0.324
4 7.600 11.414 2.923 0.241
Figure 2. Diagram showing intra and inter-cluster distances of 22 lentil genotypes. Contribution of characters towards divergence of the genotypes
II
0.00
III
0.324
IV
0.241
I
Table 8. Latent vectors for 11 principal component characters of 22 lentil genotypes
Variable Vectors 1 Vectors 2
Days to 1st flowering -0.1332 -0.1407
Days to maturity 0.3769 0.1465
Plant height (cm) 0.0151 0.3655
Pod/plant 0.0251 0.0596
100 seed weight (g) -0.1366 -2.7254
Yield (kg/ha) 0.0119 -0.0037
CONCLUSIONS AND SUGGESTION
Considering yield performance, cluster distance and cluster mean genotype BLX-02009-04-01 and BLX-02009-04-05 from cluster I, genotype BLX-02009-17-4 from cluster II may be considered better parents for future hybridization program for they are more divergent.
REFERENCES
Aich, A., S.S. Aich and M.P. Shrivarastava.2007. Genetic variability, correlation and coheritability studies on yield and its components in Lentil. J. Interacademicia. 11(3) : 247-250
Arunachalam V. 1981. Genetic distance in plant breeding. Indian J. Genet. 14. 226–236. Bicer, B.T. and D. Sakar. 2004. Genetic
variability and heritability for grain yield and other characters in lentil. J. Biol. Sci., 4(2): 216-218.
Chakraborty, M. and M.F. Haque. 2000. Genetic variability and component analysis in lentil (Lens culinaris Medik). J Res. Birsa Agric. Uni., 12(2): 199-204.
Chauhan, M.P., R. Nath and R.K. Srivastava. 2005. Classification on genetic diversity in Indian lentil germplasm. Legume Res., 28(2): 125-127.
Goulden, C.H. 1959. Methods of statistical ana-lysis. Wiley and Sons, Inc., New York. p. 425-428.
Gowda, C.L.L. and A.K. Kaul. 1982. Pulses in Bangladesh. BARI and FAO pub. p. 50-80.
Ramanujam, S. 1981. Biometrical basis for yield improvement in mungbean. In: Procedings 1st International Mung bean Symposium, (ed. R. Cowell) AVRDC, Shanhua. pp. 210
Rathi, A.S. 2004. Character association analysis for yield and its components in lentil. Farm Sci. J., 13(2): 170.
Sindhue, J.S. and A.E. Shinkard. 1985. Collecting lentil in Syria. Plant Genetic Resources Newsletter. 55: 24-25. Singh, S.K., D.K. Srivastava, B. Singh and J.R.
Yadav. 1999. Studies on character association in okra (Abelmoschus esculentus (L.) Moench). Journal of the Andaman Science Association. 15(1): 69-71.
Singh, R.K. and B.D. Chaudhary. 1985. Biometrical methods in quantitative genetic analysis. Kalyani Publishers, New Delhi, pp 225-252.
Singh, T. and K.K. Gupta. 2004. Genetic diversity for yield and related traits in lentil (Lens culinaris Medik.). Plant Archives. 4(1): 39-43.