I nternational Journal of Engineering and Technology (UAE) I SSN: 2227524X November 2018
1
Determining Layer Oil Shale As New Alternative Energy
Sources Using Core Analysis and Well Log Method
Bagus S Mulyanto1,a), Ordas Dewanto1,b), Sri Rizky1,c)
1)
Geophysics Engineering, Engineering Faculty, University of Lampung, Bandar Lampung 35145
a)
[email protected], b)[email protected], c)[email protected]
Abstract
Oil shale is a type of shale containing organic material is not yet mature. When heated to a certain temperature, the organic content to mature so that it can produce petroleum. Exploration with a reliable method to energy sources of the future needs to be done, because it has a particularly important role in the context of the national energy supply security in the future. Oil deposits in shale oil is quite high, estimated as relatively large reserves spread across several regions of Indonesia. To determine the content of oil shale in the basin necessary to evaluate the condition of the reservoir, by determining and analyzing the reservoir parameters. Determination and analysis of reservoir parameters is done by two methods, namely core analysis in the laboratory and log interpretation in the field. Determination of oil-bearing layer in the wells is performed quantitatively which is based on the value HTTI=14.20-75.30 103 cal cm-3) and Ro=0.70-2.17 (%). Further is qualitatively to determine layer containing shale (oil shale). First look at the layers of shale from the high GR value and then their separation sonic and resistivity in the shale layer. A layer of oil shale wells BG-6 is present at a depth of 1637-1687 meters. BGS-1 wells at a depth of 2025-2062, 2100-2125, 2175-2200, 2275-2310 meters. BGS-2 wells at a depth of 2025-2045, 2138-2160, 2275-2295, 2380-2405 meters. BGS-3 wells at a depth of 2150-2165, 2212-2225 meters. While the BGS-4 wells at a depth of 2175-2187.5, 2212.5-2245, 2300-2312.5, 2350-2388 meters.
Key words: Oil shale, organic, core analysis, log interpretation, HTTI, Ro
1. Introduction
Oil shale is a material of clay or carbonate-containing organic material, where oil shale is an energy source that can produce oil and natural gas if processed properly (Kantsler and Cook, 1980; Dewanto, 2008). Waste oil shale processing results even this is very beneficial for human life, for example in the areas of agriculture and industrial buildings (Barkia et al, 2004; Hasan, 2006; Al-Hamaiedh et al, 2010). Kogerman (2001) claims that research into oil shale research center in the USSR. The formation of this study is to see the development of research in the field of shale material quite rapidly. Berraja, Barkia, Belkbir, and Jayaweera (1988) began research on thermal analysis study on the combustion of oil shale in Tarfaya. Although the methods used have not been efficient, but from the results of these studies resulted in a fairly sophisticated warming theory at this time, the method of pyrolysis.
According to the results of Bartis et al (2005), the exploitation of oil shale that has been collected so one was sent to a treatment plant by burning directly flakes to be used as a source of electrical energy. Bartis et al also to mine oil shale underground using room and pillar method. Then Burnham et al (2006) did the results of processing oil shale extraction, which is done on the ground (ex-situ processing), although there are some new technologies extracting shale processing results in underground locations or in-situ processing.
I nternational Journal of Engineering and Technology (UAE) I SSN: 2227524X November 2018
2 This usually takes place at temperatures between 450oC (842OF) and 500oC (932OF). The decomposition process starts at a relatively low temperature (300OC/570OF), but the results faster and complete obtained at higher temperatures (and Mihkel Koel, 1999). According to Qian and Wang (2006) there are four kinds of technology still used commercially, which is Kiviter, Galoter, Fushun and Petrosix.
Geological Resources Center has been conducting investigations of oil shale oil in 53 locations in Indonesia. Supported also by Tobias (2003) conducted an inventory of oil shale solid precipitate in the Father. Moreover Tjahjono (2004) conducted a preliminary survey precipitated solid oil shale in Blora, Central Java Province.
The data may indicate the level of maturation of organic material such as TAI, TTI, Ro, and so on. In point of fact, it has a lot of experts to develop geothermal technology to determine the maturity level of the crude oil, including Subono and Siswoyo (1995), Dewanto (2001), Nakayama (1987) and so on.
Testing pyrolysis is used to determine the organic content (TOC), the maturity of organic material, detecting the content of oil or gas produced and is also used to identify the type of some mixed material. The heating process is done by the pyrolysis method refers to the previous investigators that Katz (1983), Berraja et al (1988), Kamtono et al (2005), Heryanto and Hermiyanto (2006), Hidayat and Fatima (2007), Praptisih et al. 2009.
By conducting a series of tests to obtain a couple dY/dt and Tsolid, it can be graphed the relationship between ln(dY/dt) by 1/Tsolid. Then search for the straight line equation through the linier regression, in order to get the value of the temperature at some stage of the reaction, in this case the level of mature (Suyitno, 2009; Indrati et al, 2000).
Determination of the temperature in the pyrolysis process to determine the temperature level of maturation and analysis of the rate of reaction based on some previous researchers, namely: Cahyadi et al (2011) conducted a study of the behavior of ignition of coal particles Indonesia using Thermogravimetric analysis under conditions of O2/N2 and O2/CO2, Sato et al (2010) conducted a
study on the activation free energy that have a dependency on temperature. The temperature dependence is stronger for the calculation. Determination of the temperature at each stage of maturation reaction and the reaction rate of TGA analysis refers to of some previous research results, which are: Himawanto et al (2013), Himawanto (2013), RJ (2009), Eman A. Emam (2013), Yan and Zhang (2014), Sugondo (2012), Sukma (2012), Suyitno (2009), Minarsih (2011).
Efforts to build a methodology for data use acoustic laboratory for the purpose of knowing the changing nature of the organic material in the host rock of the results of the analysis of changes in physical and chemical properties in reservoir rocks in the basin-sedimentary basins in Indonesia has been implemented by Siswoyo (1995) and Subono (1995). He did research on thermal studies in Indonesian oil basin. In this study obtained basic parameter T (temperature), K (thermal conductivity), temperature gradient (dz/dT) and JK (amount of heat). Then Siswoyo and Subono (1995) continued his research on the migration of hydrocarbons and hydrocarbon maturation of immature supported by geochemical data (Ro: vitrinite reflectance).
Research Dewanto (2001-2002) is the basic research of the results of research development Subono and Siswoyo (1995), which resulted in the determining method of early maturity of hydrocarbon and elastic properties of the parameters used as indicators to predict the rate of change of the organic material (immature hydrocarbon conversion to BBM). Dewanto et al research results closely related to the research to be proposed, the difference in the maturity level. The proposed study was conducted on level, a mature while research Dewanto (2001-2002) performed on immature level.
I nternational Journal of Engineering and Technology (UAE) I SSN: 2227524X November 2018
3 Graph of thermal conductivity of rocks sand (A) and shale (B) against porosity in wells A1 (Dewanto, 2004) showed that exponential relationship. It is seen that the smaller the price of then KB increases. In accordance with the theory that increasing the depth (Z), the price will decrease
In 2007-2008, Dewanto et al conducted research on oil shale. First, analyze and determine the content area of oil shale wells in the area 'X' Sumatra. Both analyzes changes in the oil shale into oil and gas substitute substance in the reservoir. Third, determine methods ofprocessing industry oil shale into a substance-oil substitute. The method used is thermal method supported by methods Well logging and petrophysical and geochemical of data. The results obtained are the model of the rate of change of organic matter into oilshale.Then it can be seen the formation of shale oil in the reservoir rock in each of the wells in the area 'X', and obtained by the method how to determine the presence of oil shale (depth) in each well.
Dewanto’s research (2010) is a continuation of Dewanto’s research (2007-2008). The results of the oil shale coring processing by way of direct heating of extraterrestrial ie in the laboratory. Heating oil shale to a temperature of 200OC to 400OC. The goal is to change the oil shale into oil or organic rock alteration process into mature hydrocarbon. Immature oil shale combustion-heated temperature of 200OC to 400OC. The result is wood / charcoal that has been poured dry quickly lit the fluid (such as oil), there was a fairly long flame (such as oil). This is caused by substances that lower the API degree means it contains many heavy fraction (high density) and thus a high boiling point, whereas if the degree of fire is high, it contains more light fractions such as gasoline, thus also a low boiling point. Dewanto’s research (2013) is the development of Dewanto et al’s research (2007 to 2010).
Dewanto’s research (2013) discusses the effect of the maturity of organic clay material. Level of maturity and potential of organic material in a reservoir rock, has a different price. The difference occurs because of the influence of clay material mixed with organic material in sedimentary rocks. The existence of several types of clay material with a different volume, will certainly lead to changes in the characteristics of the organic material or change the properties of physical/chemical material, so that will affect the level of maturity and potential of organic material in a reservoir rock. Research conducted has the goal: to find out how much influence the clay material containing kaolinite/illite, towards maturation and potential of organic material in the heating process material. The result of Dewanto’s research (2013) will be used in this study to determine methods of oil shale exploration.
2. Data and Methods
2.1 Place and Time
The research areas include the area 'X' in the Basin A. This research was conducted in the laboratory of Geophysical Engineering Unila Bandar Lampung. This research is also carried out field research in the area A. The study takes time for one year, which contain: measurement, data processing and data analysis.
2.2 Data-Data Required
I nternational Journal of Engineering and Technology (UAE) I SSN: 2227524X November 2018
4 2.3 Data Processing Method
2.3.1 Determination of lithology, Age, Porosity(Amdel 1998 & Harsono, 1993)
Determine the lithology at each formation of each well and determining the date and time of sedimentation of the lithology. Then determine the price of their porosity, as the base to perform work on the next stage.
2.3.2 Determination of Thermal formula
Total Heat (HTTI) is determined based on the basic principles of TTI, integrated with the basic understanding of 'heat flow' that indicates the number of calories per unit area per unit time. While the temperature gradient is not taken the same, but is a function of heat flow and thermal conductivity was observed overall formation. HTTI shows the level of maturity of organic matter, which is obtained from the amount of the cumulative number of calories unity volume.
This stage calculates the amount of heat in each of the layers of rock. The amount of heat is calculated based on the simple case Lopatin-Waples and calculation change Time Temperature Index (TTI), which is modified by inserting heat flow as parameters. So that the total maturation on a space rock (sedimentary, carbonate, shale), converted into a thermal formula, as follows:
(1)
where Q is the price of heatflow, ∆t is the sedimentation time required to reach 10OC temperature difference. The (∆Z)N is the change in depth on any increase in temperature 10OC. ∆Z=10/GT, the
GT=Q(t)/K is a temperature gradient. N is the temperature factor. Nmin is the price interval N at the lowest temperature. Nmax is the price interval N at the highest temperature. With the boundary conditions: N0 to T<100OC, and N0 to T110OC. Interval 100OC-110oC, is used as a base interval, where N=0.
To do this stage, do some calculations to obtain the parameters in equation (1), namely: calculating the thermal conductivity of rocks, calculate the temperature gradient, calculate the thermal conductivity of formations, calculate the thermal conductivity of wells, determine the heat flow, making geo maturation histories and determination of hydrocarbons in the well.
2.4 Data Analysis
The final stage, analyzing the results of data processing. The results of calculations of thermal conductivity of rocks in each to compare. Next, we see the results of the calculation of heat flow and hydrocarbon maturation in both wells. Each well we compare and analyze. Finally, it can be determined the difference or equality of outcome data processing which is based on the calculation of heat conductivity of rocks. So, the rate of maturation of hydrocarbons in both wells can be estimated by two methods, namely from the calculation and measurement of thermal conductivity of rocks.
After the stages of data processing and analysis as mentioned above, we analyze the effect of changes in the physical properties of reservoir rocks of the level of hydrocarbon maturation. Then perform the thermal model design and obtained the degree of change in organic matter into oil shale, the shale oil content in the layer and the content of oil shale depth model.
3. Results And Discussion
3.1 Thermal Conductivity
I nternational Journal of Engineering and Technology (UAE) I SSN: 2227524X
C-1. In full prices of the above is shown in Table 1. Prices of thermal conductivity of rocks obtained by calculating the thermal conductivity of rocks by ϕFrom equation KB=KFϕKS1-ϕ (Nakayama,
1987), it was obvious that ϕ greatly affect the thermal conductivity of rocks. The graphs show the exponential relationship. It is seen that the smaller the price of ϕKB increases. In accordance with the
theory that increasing the depth (Z), the price ϕ will decrease exponentially. The result Dewanto’s research (2014) showed that in wells A1 and B1, increasing its depth, the thermal conductivity of rocks (for sand and shale) increases. The relationship between KB with depth (Z), showed an
exponential relationship.
Price ϕ decreasing exponentially every increase of depth due to the influence of the pressure of overburden that affects any space rocks in the earth, so that the space rocks has the different shape and properties, such as the price of ϕ on the rock, which is becoming smaller every increase depth (Nakayama, 1987). Because the price of the smaller then K is getting bigger every increasing depth. We see changes in the price of and K, not too over for any increased depth. It does not mean the pressure has no effect, but in the well region does not happen overpresure.
3.2 Geothermal flow (Heat Flow)
Next, we see geothermal heat flow (heat flow, Q) at the BG-6 wells, BGS-1, BGS-2, 3-BGS and BGS-4. Heat flow can be determined in two ways. First by direct measurements, usually no specific studies on heat flow. Second, by calculation based on thermal conductivity and temperature gradients.
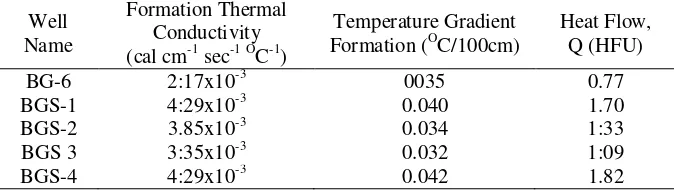
In this study, researchers determined the price of heat flow by way of calculation. From the calculations, the price of heat flow to the well BGS-4 is greater than the BG-6 wells, BGS-1, BGS-2 and BGS-3. This is because the price of thermal conductivity BGS-4 wells formation is greater than BG-6 wells, BGS-1, BGS-2 and BGS-3. Price formation temperature gradient also greatly affects the value of heat flow. BGS-4 wells have a high value of heat flow, causing heat flow in wells BGS-4 is greater than the BG-6 wells, BGS-1, BGS-2 and BGS-3. The results are shown in Table 1.
Table 1. Calculation of KFORMATION, GTFORMATION and Heat Flow (Q)
Well
Geothermal flow horizontal/lateral price is not necessarily the same, for the same depth. But if counted vertically, for example in a single well, to a depth of 0 to 20000 meters, geothermal same flow rates (unchanged). In accordance with the theory, that geothermal flow vertically from the center of the earth, geothermal energy price changes flow occur at fairly long intervals (tens of kilometers). Heat flow (geothermal heat flow) raises heat on lithology or space rock. The amount of heat contained in each lithology, the numbers are different. Many factors influence the difference in the amount of heat in space rocks, such as heat flow, sedimentation time, depth and temperature changes.
3.3 Total Heat (HTTI)
I nternational Journal of Engineering and Technology (UAE) I SSN: 2227524X November 2018
6 parameters. Total maturation on a space rock (sedimentary), modified with a thermal formulation as in equation (1).
The amount of heat indicated by the unit cal cm-3, itmeans that in the rock hall has a hot number for n cal cm-3. The magnitude of this HTTI price becomes the basis for estimating the level of hydrocarbon maturation in each of the wells, which can be compared with the data geokima maturation indicators, namely vitrinite reflectance (Ro). From some research on the relationship Ro and maturation of hydrocarbons, according to Subono (1995), disclosed that Ro=0.4-0.6 % indicate the onset of petroleum, Ro=0.7-0.8 % showed a fairly mature oil(abundant oil generation), Ro=0.8-1.3 %, indicating that hydrocarbons are very mature and for gas is generally indicated by Ro 1.3%.
Figure 1. Graph depth against HTTI and Ro Well BG-6
Figure 2. Graph depth against HTTI and Ro Well BGS-1
The larger HTTI price, the price of Ro growing, where the properties of the graph shows the exponential (Dewanto, 2001). The situation occurred because Ro (%) and HTTI 103 cal cm-3),
associated with the depth and temperature factors. If the price of the HTTI we associate with the depth factor, the obtained relationship between HTTI and depth, as shown in Figure 1, Figure 2, Figure 3, Figure 4 and Figure 5. Shown in the image, increasing its depth, HTTI price increases.
I nternational Journal of Engineering and Technology (UAE) I SSN: 2227524X November 2018
7 Figure 4. Graph depth against HTTI and Ro Well BGS-3
Figure 5. Graph depth against HTTI and Ro Wells BGS-4
3.4 BG-6, BGS-1, BGS- 2, BGS-3 and BGS-4 Wells
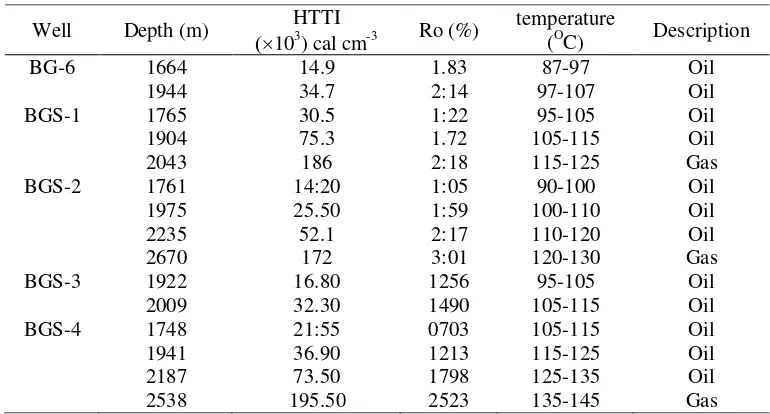
BG-6 well have a price HTTI=14.9 and 34.7 ×10³ cal cm-3)occurs at depths of 1664 and 1944 meters, and Ro prices ranging between 1.83% -2.14%, it can be concluded that at that depth showed a fairly mature petroleum, or it can be said that on the Formation (1664-1944m), formed in petroleum fairly mature, with a temperature value between 87-107 oC.
BGS-1 well have a price HTTI=30.5-75.3 ×10³ cal cm-3), occurred at a depth of 1765-1904 meters, and the price Ro ranges between 1.22-1.72 %. At such depths indicate that the hydrocarbons are very mature. Or it can be said that on the Formation (1765-1904m), the state of hydrocarbons is very mature, with a temperature of 95-115 OC. The well BGS-1 also has a value HTTI=186 ×103 cal cm-3), occurred at a depth of 2043 meters, and the price Ro is 2.18%. At that depth showed formation of gas, or it can be said that the formations (2043m) estimated that there is a gas, with the temperature value 115-125 OC.
BGS-2 well has a value HTTI=14.20, 25.50 and 52.1 (×103cal cm-3), occurs at depths of 1761,
1975 and 2235 meters, with a value of Ro is 1.05%, 1.59% and 2.17%. At such depths indicate that the hydrocarbons are very mature. Or it can be said that the formations (1761, 1975 and 2235 m), the state of hydrocarbons is very mature, with a temperature of 90-120 OC. The well BGS-2 also has a value HTTI=172 ×103 cal cm-3)occurred at a depth of 2670 meters, and the price is Ro=3.01%. At that depth showed formation of gas, or it can be said that the formations (2670m) estimated that there is a gas, with the temperature value is 120-130 OC.
BGS-3 well have price HTTI=16.80 and 32.30 ×10³ cal cm-3) occurs at depths of 1922 and 2009 meters, and Ro price ranges from 1.26% to 1.49%, it can be concluded that at that depth showed a fairly mature petroleum, or it can be said that on the Formation (1922-2009m), formed in petroleum quite mature, with a temperature value between 95-115 OC.
I nternational Journal of Engineering and Technology (UAE) I SSN: 2227524X November 2018
8 HTTI=195.5 ×10³ cal cm-3), occurs in a depth of 2538 meters, and the price is Ro 2.52%. At that depth showed formation of gas, or it can be said that the formations (2538m) estimated that there is a gas, with a temperature of 135-145 OC.
Price HTTI wells BG-6, BGS-1, BGS-2, BGS-3 and BGS-4, are shown in Table 2. If the price HTTI we associate with the depth factor, the obtained relationship between HTTI and depth, as ditunjukka n in Figure 1, 2, 3, 4, 5. As seen in the image, increasing its depth, HTTI price increases.
3.5 Determination of Oil Shale Layers Based on Analysis of Quantitative and Qualitative
Oil shale is a type of shale containing organic material is not yet mature. When heated to a petrophysical and geochemical technology, supported by geological data, seismic technology and technology geothermal (heat).
I nternational Journal of Engineering and Technology (UAE) I SSN: 2227524X November 2018
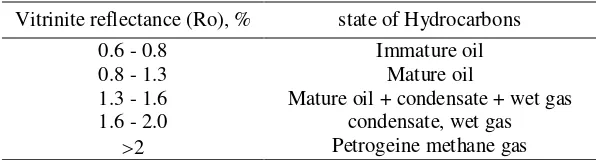
9 Table 3. The level of maturity of organic matter by price vitrinite reflectance, Ro (Dewanto, 2001)
Vitrinite Reflectance (Ro) Situation Hydrocarbon Temperature (OC)
0.35-0.40 Immature 50-60
Table 4. The level of maturity of organic matter by price vitrinite reflectance, Ro (Tissot and Walter, 1984 in Dewanto, 2001) prices usually can show maturity hydrocarbons. On the exploration of hydrocarbons, Ro is usually an indicator to estimate the degree of maturation of hydrocarbons, namely by looking at the amount of reflection at core. From some research on the relationship Ro and hydrocarbon maturation, according Subono (1995), disclosed that Ro=0.4-0.6% indicating onset of petroleum (immature hydrocarbons), Ro=0.7-0.8% showed a fairly mature oil (abundant oil generation), Ro=0.8-1.3%, indicating that hydrocarbons are very mature and for gas is generally indicated by Ro1.3%. According to Dewanto (2001), revealed that the level of maturity of hydrocarbon based Ro shown in Table 3. Meanwhile, according to Tissot and Walter (1984) are shown in Table 4.
From the results Subono (1995), it can be concluded the relationship between the amount of heat with Ro, which is the larger amount of heat on a rock’s space, Ro prices will be even greater. So that the amount of heat is closely linked to the price of Ro. The amount of heat developed from the basic principles of TTI, integrated with the basic understanding of heat flow that indicates the number of calories per unit area per unit time. While the temperature gradient is not taken the same, but is a function of heat flow and thermal conductivity was observed overall formation. Thermal conductivity is determined from the results of measurements and calculations based on porosity. The amount of heat (HTTI) can indicate the level of maturity of organic matter, which is obtained from the amount of the cumulative number of calories unity volume.
I nternational Journal of Engineering and Technology (UAE) I SSN: 2227524X November 2018
10 The oil shale layer of the BG-6 well is at a depth of 1637-1687 meters (Figure 6), due to the high GR value and the sonic-resistivity separation. At the BGS-1 wells the oil shale layer is at depths of 2025-2062 meters, 2100-2125 meters, 2175-2200 meters, 2275-2310 meters (Figure 7).
Figure 6. Graph HTTI Log-Ro-GR, Sonic-Lld, NPHI-RHOB Well BG-6
Figure 7. Graph HTTI Log-Ro-GR, Sonic-Lld, NPHI-RHOB Well BGS-1
oil shale
oil shale
oil shale
I nternational Journal of Engineering and Technology (UAE) I SSN: 2227524X November 2018
11 Determination of the layer containing oil and gas wells BG-6, 1, 2, 3-BGS and BGS-4 has been carried out quantitatively which is based on the value HTTI=1BGS-4.20-75.30 ×10³ cal cm-3) and Ro = 0.703- 2.17 (%). Furthermore, to determine layer containing shale (oil shale) need to look at the log data GR, sonic and resistivity (qualitative determination). First look at the shale layer of the high GR value then the sonic separation and resistivity of the shale layer.
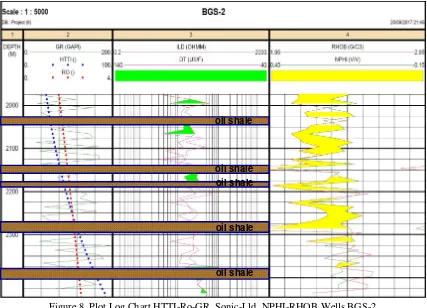
Figure 8. Plot Log Chart HTTI-Ro-GR, Sonic-Lld, NPHI-RHOB Wells BGS-2
Figure 9. Plot Log Chart HTTI-Ro-GR, Sonic-Lld, NPHI-RHOB Wells BGS-3
oil shale
oil shale oil shale
oil shale
oil shale
oil shale
I nternational Journal of Engineering and Technology (UAE) I SSN: 2227524X November 2018
12 The oil shale layers of BGS-2 wells are at depths of 2025-2045 meters, 2138-2160 meters, 2275-2295 meters, 2380-2405 meters (Figure 8). While on the well BGS-3 oil shale layer is at depths 2150-2165 meters, 2212-2225 meters (Figure 9). The oil shale layers of the BGS-4 well are at depths of 2175-2187.5 meters, 2212.5-2245 meters, 2300-2312.5 meters, 2350-2388 meters (Figure 10).
Figure 10. Plot Log Chart HTTI-Ro-GR, Sonic-Lld, NPHI-RHOB Wells BGS-4
There are several wells at a certain depth of separation of sonic-resistivity with a large GR value but not an oil shale coating, because the value of HTTI and Ro are not favorable. Then there are some wells at a certain depth of separation of sonic-resistivity but not an oil shale coating, because of the small value of GR. So, the determination of oil shale layer needs to be done quantitatively (see the value of Ro and HTTI) and qualitative (small GR and sonic-resistivity occur separation).
4. Conclusion
The oil-containing layer of the well is quantitatively based on the value of HTTI=14.20-75.30 (103 kal cm-3) and Ro = 0.703-2.17 (%), and is done qualitatively by looking at the shale layer of high GR value then the sonic separation and resistivity of the shale layer.
The oil shale layer on the BG-6 well is at a depth of 1637-1687 meters. Wells BGS-1 at depth 2025-2062 meters, 2100-2125 meters, 2175-2200 meters, 2275-2310 meters. Wells BGS-2 at a depth of 2025-2045 meters, 2138-2160 meters, 2275-2295 meters, 2380-2405 meters. BGS-3 wells at depths of 2150-2165 meters, 2212-2225 meters. While at the well BGS-4 at a depth of 2175-2187.5 meters, 2212.5-2245 meters, 2300-2312.5 meters, 2350-2388 meters.
oil shale
oil shale
oil shale
I nternational Journal of Engineering and Technology (UAE) I SSN: 2227524X November 2018
13 Acknowledgements
The author would like to thank:
1. High Education Departement (Dikti) who has provided research funding assistance. 2. LPPM Lampung University which has provided research opportunities and support.
3. Geophysical Engineering Laboratory at Lampung University, which has provided data processing opportunity so that this research can run smoothly.
References
Amdel. 1998. Geological Time Scale Chart. The Australian Mineral Development Laboratories.
Al-Hamaiedh, H., Maaitah, O., and Mahadin, S. 2010. Using Oil Shale Ash in Concrete Binder. EJGE Vol. 15, Bund. FP 601-608.
AL-Hasan, N. 2006. Behavior of concrete made using oil shale ash and cement mixtures. Oil Shale. Vol. 23, No. 2, ISSN: 0208-189X pp. 135–143.
Barkia, H., Belkbir, L. and Jayaweera, SAA. 2004. Thermal analysis studies of oil shale residual carbon. Journal of Thermal Analysis and Calorimetry. 76 (2), pp.615-622.
Bartis, James T.; LaTourrette, Tom; Dixon, Lloyd; Peterson, DJ; Cecchine, Gary. 2005 (PDF). Oil Shale Development in the United States. Prospects and Policy Issues. Prepared for the National Energy Technology Laboratory of the US Department of Energy.
Berraja, T., Barkia, H., Belkbir, L., and Jayaweera, SAA. 1988. Thermal analysis studies of the combustion of Tarfaya oil shale. Proceeding of an International Conference on Carbon, Carbon'88, Eds. B. McEnnaney and TJ Mays, Univ. Newcastle Upon Tyne, UK, 18-23.
Burnham, Alan K.; McConaghy, James R. 2006. "Comparison of the Acceptability of Various Oil Shale Processes" (https://e-reports-ext.llnl.gov/pdf/341283. pdf) (PDF). 26th Oil Shale Symposium. Golden, Colorado: Lawrence Livermore National Laboratory. UCRL-CONF-226717. Retrieved 2007-06-23.
Cahyadi and Yulianto SN. 2001. Study of Behavior of Indonesian Coal Particle Using Thermogravimetric Analysis Under O2/N2 and O2/CO2 Conditions. Journal of Energy Technology (JITE). Volume 1 Number 13Agustusi 2011, ISSN 1858-3466. Center for Energy Technology-BPPT Journal of Energy Science Technology.
Dewanto, O. 2008. Determining the Condition of Organic Rocks in Central Java 'X' Region, by Estimating the Thermal Capacity of Reservoir Rocks. Proceedings of National Seminar of Science and Technology-II 2008 University of Lampung. ISBN: 978-979-1165-74-7. V. 132-141.
Dewanto, O. 2010. Clay effect (kaolinite/illite) on maturation and organic potency (cyclic/aliphatic) as basis for processing oil shale. UI report. Jakarta.
Dewanto, O. 2012. Clay Effects (kaolinite/illite) and Carbonate (Calcite/Dolomite) on maturation and organic potential to Determine Laboratory Test Parameters on Oil Shale Material Processing. Doctoral Dissertation Progress Report. UI Jakarta.
Dewanto, O. 2013. Effect of Clay Material (Kaolinite/Illite) Against Maturation and Organic Material Potential For Basic Material Processing Shale As Alternative Energy Substitute Fuel. Proceedings of the National Seminar on Physics. UNJ Jakarta.
I nternational Journal of Engineering and Technology (UAE) I SSN: 2227524X November 2018
14 Dewanto, O. and Hermanto. 2007. Estimation of Temperature Value of Formation on Oil Well Using Core and Log Method. Proceedings of Seminar on Research Result and Community Service. Research Institute of Lampung University, September 2007, ISBN 978-979-15535-1-3.
Dewanto, O. 2001. Geothermal Flow Relation Analysis Against Early Hydrocarbon Maturation in Oil Basin in West-North Java. Journal of Science and Technology Unila. ISSN 0853-733X Vol. 7 No.3. 2001 p. 29-42.
Dewanto, O. 2002. Analysis of Porosity Relation to Thermal Conductivity of Rock Measurement and Calculation on Oil Wells. Journal of Science and Technology Unila. ISSN 0853-733X. Vol. 8 No. 2, 2002 p. 27-41.
Dewanto, O. 2004. Estimation of Heat Flow Based on Heat Conductivity of Measurement and Calculation Wells in Oil Wells in Central Sumatra. Journal of Science and Technology. Vol.10, No.3, December 2004, ISSN 0853-733X.
Dewanto, O. 2004. Estimation of Hydrocarbon Maturation Rate Using Thermal Method at A-1 and B-1 Wells in Central Sumatera Basin. Proceedings of the Indonesian Geophysical Experts Association. 29th Annual Scientific Meeting, Yogyakarta 5-7 October 2004 ". October 2004 Edition, ISBN 979-95053-4-8.
Dewanto, O. 2005. Estimation of Temperature Change on Oil Formation in Oil Reservoir Rocks. Proceedings of Seminar on Research Results and Community Service, University of Lampung. Issue II, September 2005, ISBN 979-8287-82-7.
Dewanto, O. 2006. Effect Analysis of Physical Changes of Rock Physics to Hydrocarbon Maturation Level on Reservoir Rocks. Journal of Science and Technology. Volume 12, No.2, August 2006. ISSN 0853-733X. Accredited Director General DIKTI No: 56/DIKTI/Kep/2005.
Dewanto, O., Bahri, S. and Atmojo, JP 2008. Analysis of Changes of Physical Properties of Organic Rock to Geothermal Flows in the 'X' Region of Sumatra, to Determine Gynecology and Oil Shale Areas as New Energy Sources. Proceedings of the Annual Scientific Meeting. HAGI 33rd Annual Convention & Exhibition, Hyatt Regency Bandung. ISBN: 978-979-8126-05-5.
Dewanto, O., Surtono, A., and Fatridal, R. 2007. Analysis of Changes of the Physical Properties of Rocks to the Early Formation of Petroleum in Reservoir Rocks. MIPA Science Journal. Special Edition Volume 13, No. 3, Year 2007. Accredited Directorate General of Higher Education SK No: 56/DIKTI/Kep/ 2005Eman A. Emam. 2013. Clays as Catalysts in Petroleum Refining Industry. ARPN Journal of Science and Technology. Vol.3, No.4, ISSN: 2225-7217. Department of Petroleum Refining Eng. and Petrochemicals, Faculty of Petroleum and Mining Eng., Suez University, Suez, Egypt.
Harsono, A. 1993. Introduction to Log Evaluation. Schlumberger Data Services Book. Mulia Center L.17, Kuningan, Jakarta, p.19-21.
Heryanto, R. and Hermiyanto, H. 2006. Potential source rock (source rock) hydrocarbons in the Tigapuluh Mountains, Central Sumatra. Journal of Geology of Indonesia. Vol. 1 No.1, p: 37-48.
Hidayat, R. and Fatimah. 2007. Inventory of Oil Content In Batuan Kedungjati, Semarang Regency, Central Java Province. Proceeding the Exposure of Field Results and Non-Field Activities. Geological Resource Center.
Himawanto, DA 2013. Determination of Activation Energy of Burning Char Rubbish Char Rubbish City by Using Thermogravimetry Method and Iso Thermal Furnace. Journal of Rotational Machine Engineering. Vol. 15, No. 3, pp: 35-42.
I nternational Journal of Engineering and Technology (UAE) I SSN: 2227524X November 2018
15 Indrati TY, Hartati, P., and Murdani. 2000. Determination of Sintered Pellet Activation Energy (Th, U) O2 At Grain Growth Stage. Proceedings of the Invention and Scientific Presentation of Basic Research on Nuclear Knowledge and Technology. P3TM-BATAN Yogyakarta. P.25.
Kamtono, Praptisih, and Siregar, MS 2005. Study of Potential of Source Rock in Sub Basin of Banyumas and North Serayu. Research. Geology and Mining Volume 16 No.1.
Kantsler, AJ, Cook, AC, and Smith, GC, 1980. Rank variation, calculated paleotemperatures in understanding oil, gas occurrence. Oil and Gas Journal. No. 20, p.196-205.
Katz, BJ 1983. Limitations of 'Rock-Eval' pyrolysis for typing organic matter. Organic Geochemistry 4, p.195-199.
Koel and Mihkel. 1999. "Estonian oil shale" (http://www.kirj.ee/public/oilshale/Est-OS. htm). Oil Shale. A Scientific-Technical Journal (Estonian Academy Publishers) (Extra). ISSN 0208-189X. Retrieved 2007-07-21.
Kogerman, A. 2001. Ten Years of Oil Shale. Estonian Academy Publishers. Oil Shale, Vol. 18, No. 1. ISSN 0208-189X. pp. 1-4.
Landes, KK 1967. 'Eometamorphism, and oil and gas in time and space', Am. Assoc. Petroleum Geol. Bull., v.44, n.10, p. 1682-1691.
Minarsih, T. 2011. Determination of Activation Amlodipine Besilate Energy At pH 1, 6 And 10 With High Performance Liquid Chromatography Method. PHARMACY. Vol.06 No.0 August 2011. ISSN 1693-3591.
Mulyanto, BS. and Dewanto, O. 2004. Determining the Thermal Conductivity of Wells Based on the Heat Conductivity of Rock Measurement and Calculation on Oil Wells in Central Sumatra. Proceedings of the Indonesian Geophysical Experts Association. 29th Annual Scientific Meeting. Yogyakarta 5-7 October 2004 ". October 2004 Edition, ISBN 979-95053-4-8.Nakayama, K. 1987. 'Hydrocarbon-Expulsion Model and Its Application to Niigata Area Japan', The American Association of Petroleum Geologists Bulletin, v.71, No.7 (July 1987), p. 810-812, 2 Figs.
Novitasari, D., Dewanto, O., Gyamirtie, LN. and Mulyanto, BS. 2007. Estimation of Hydrocarbon Maturation Using HTTI Method (Heat Thermal Temperature Index) on Reservoir Rock. Proceeding JCB 2007, The 32th, 36th HAGI and 29th IATMI, Annual Convention and Without Binders. Essays. Department of Mechanical Engineering Faculty of Engineering Sebelas Maret University Surakarta.
Sato, K., Takizawa, S. and Mohri, T. 2010. Theoretical Calculation of Activation Free Energy for Self-Diffusion in Prototype Crystal. Materials Transactions, The Japan Institute of Metals. Vol. 51, No. 9 (2010) pp. 1521 to 1525.
Siswoyo and Subono, S. 1995. 'Heat Flow, Hydrocarbon Maturity and Migration in Northwest Java'. CCOP Technical Bulletin, March 1995, Vol. 25, pp. 23 to 36.
I nternational Journal of Engineering and Technology (UAE) I SSN: 2227524X November 2018
16 Sugondo. 2012. Kinetic Kinetic Growth Alloy Zry-4 Sn Low. Urania. Vol. 18 No. 3. Hal: 120-181.
ISSN 0852-4777.
Sukma, HL 2012. Thermogravimetry Analysis And Blank Bunch Brick Making With Slow Pyrolysis Process. Final Energy Conversion Task. Industrial Technology Faculty. Institute of Technology Sepuluh Nopember Surabaya.
Suyitno. 2009. Formulation of Reaction Rate and Slow Pyrolysis Properties of Rice Husk Using Termogravimetri Analysis Method. Journal of Mechanical Engineering. Vol. 11, No. 1, 12-18. UNS, Surakarta.
Tjahjono, JAE. 2004. Survey Introduction of Solid Bitumen Deposition in Sendangharjo Area and Surrounding, Blora Regency, Central Java Province. DIM, Bandung.
Tobing, SM. 2003. Inventory of Solid Bitumen with 'Outcrop Drilling' in Ayah Region, Kebumen District, Central Java Province. DIM, Bandung.
Waples, DW. 1985. Geochemistry in Petroleum Exploration. Brown and Ruth Laboratories Inc, Denver Colorado, 33pp.
Waples, DW. 1985. Geochemistry in Petroleum Exploration. International Human Resources Developmen Co., Boston, 232 h.