The
GALE
ENCYCLOPEDIA
of
Science
The
GALE
ENCYCLOPEDIA
of
Science
THIRD EDITION
K. Lee Lerner and
Brenda Wilmoth Lerner,
Editors
VOLUME 6
Gale Encyclopedia of Science, Third Edition
K. Lee Lerner and Brenda Wilmoth Lerner, Editors
Project Editor
Kimberley A. McGrath
Editorial
Deirdre S. Blanchfield, Chris Jeryan, Jacqueline Longe, Mark Springer
Editorial Support Services
Andrea Lopeman
Indexing Services
Synapse
Permissions
Shalice Shah-Caldwell
Imaging and Multimedia
Leitha Etheridge-Sims, Lezlie Light, Dave Oblender, Christine O’Brien, Robyn V. Young
Product Design
Michelle DiMercurio
Manufacturing
Wendy Blurton, Evi Seoud
© 2004 by Gale. Gale is an imprint of The Gale Group, Inc., a division of Thomson Learning, Inc. Gale and Design® and Thomson Learning™ are trademarks used herein under license.
For more information contact
The Gale Group, Inc. 27500 Drake Rd.
Farmington Hills, MI 48331-3535 Or you can visit our Internet site at http://www.gale.com
ALL RIGHTS RESERVED
No part of this work covered by the copyright hereon may be reproduced or used in any form or by any means—graphic, electronic, or me-chanical, including photocopying, recording,
taping, Web distribution, or information stor-age retrieval systems—without the written per-mission of the publisher.
For permission to use material from this product, submit your request via Web at http://www.gale-edit.com/permissions, or you may download our Permissions Request form and submit your request by fax or mail to:
Permissions Department
The Gale Group, Inc. 27500 Drake Rd.
Farmington Hills, MI 48331-3535 Permissions Hotline:
248-699-8006 or 800-877-4253; ext. 8006 Fax: 248-699-8074 or 800-762-4058
Since this page cannot legibly accomodate all copyright notices, the acknowledgments constitute an extension of the copyright notice. While every effort has been made to ensure the reliability of the information presented in this publication, The Gale Group, Inc. does not guarantee the accuracy of the data contained herein. The Gale Group, Inc. accepts no pay-ment for listing; and inclusion in the publica-tion of any organizapublica-tion, agency, institupublica-tion, publication, service, or individual does not imply endorsement of the editors or the pub-lisher. Errors brought to the attention of the publisher and verified to the satisfaction of the publisher will be corrected in future editions.
This title is also available as an e-book. ISBN: 0-7876-7776-0 (set)
Contact your Gale sales representative for ordering information. Printed in Canada
10 9 8 7 6 5 4 3 2 1
LIBRARY OF CONGRESS CATALOGING-IN-PUBLICATION DATA
Gale encyclopedia of science / K. Lee Lerner & Brenda Wilmoth Lerner, editors.— 3rd ed. p. cm.
Includes index.
ISBN 0-7876-7554-7 (set) — ISBN 0-7876-7555-5 (v. 1) — ISBN 0-7876-7556-3 (v. 2) — ISBN 0-7876-7557-1 (v. 3) — ISBN 0-7876-7558-X (v. 4) — ISBN 0-7876-7559-8 (v. 5) — ISBN 0-7876-7560-1 (v. 6) 1. Science—Encyclopedias. I. Lerner, K. Lee. II. Lerner, Brenda Wilmoth.
Q121.G37 2004
503—dc22 2003015731
Disclaimer:
CONTENTS
Topic List. . . vii
Organization of the Encyclopedia. . . xxvii
Advisory Board . . . xxix
Contributors . . . xxxi
Entries
Volume 1 (Aardvark–Chaos). . . 1–818
Volume 2 (Charge-coupled device–Eye). . . 819–1572
Volume 3 (Factor–Kuru) . . . 1573–2254
Volume 4 (Lacewings–Pharmacogenetics) . . 2255–3036
Volume 5 (Pheasants–Star). . . 3037–3800
Volume 6 (Star cluster–Zooplankton) . . . 3801–4378
A
Anesthesia
Coffee plant
Formula, structural
Monoculture
Rate
Wren-warblers Wrens
Wrynecks
X
X-ray astronomy X-ray crystallography X rays
Xenogamy
Z
Zebras Zero
Zodiacal light Zoonoses Zooplankton
Y
Y2K Yak Yam Yeast Yellow fever Yew Yttrium
The Gale Encyclopedia of Science, Third Edition has been designed with ease of use and ready reference in mind.
• Entries are alphabetically arranged across six volumes, in a single sequence, rather than by scientific field • Length of entries varies from short definitions of one or
two paragraphs, to longer, more detailed entries on more complex subjects.
• Longer entries are arranged so that an overview of the subject appears first, followed by a detailed discussion conveniently arranged under subheadings.
• A list of key terms is provided where appropriate to de-fine unfamiliar terms or concepts.
• Bold-faced terms direct the reader to related articles. • Longer entries conclude with a “Resources” section,
which points readers to other helpful materials (includ-ing books, periodicals, and Web sites).
• The author’s name appears at the end of longer entries. His or her affiliation can be found in the “Contributors” section at the front of each volume.
• “See also” references appear at the end of entries to point readers to related entries.
• Cross references placed throughout the encyclopedia direct readers to where information on subjects without their own entries can be found.
• A comprehensive, two-level General Index guides readers to all topics, illustrations, tables, and persons mentioned in the book.
AVAILABLE IN ELECTRONIC FORMATS
Licensing. The Gale Encyclopedia of Science, Third Editionis available for licensing. The complete database is provided in a fielded format and is deliverable on such media as disk or CD-ROM. For more information, con-tact Gale’s Business Development Group at 1-800-877-GALE, or visit our website at www.gale.com/bizdev.
ACADEMIC ADVISORS
Marcelo Amar, M.D.
Senior Fellow, Molecular Disease Branch National Institutes of Health (NIH) Bethesda, Maryland
Robert G. Best, Ph.D. Director
Divison of Genetics, Department of Obstetrics and Gynecology
University of South Carolina School of Medicine Columbia, South Carolina
Bryan Bunch Adjunct Instructor
Department of Mathematics Pace University
New York, New York Cynthia V. Burek, Ph.D.
Environment Research Group, Biology Department Chester College
England, UK David Campbell Head
Department of Physics
University of Illinois at Urbana Champaign Urbana, Illinois
Morris Chafetz
Health Education Foundation Washington, DC
Brian Cobb, Ph.D.
Institute for Molecular and Human Genetics Georgetown University
Washington, DC Neil Cumberlidge Professor
Department of Biology
Northern Michigan University Marquette, Michigan
Nicholas Dittert, Ph.D.
Institut Universitaire Européen de la Mer University of Western Brittany
France
William J. Engle. P.E.
Exxon-Mobil Oil Corporation (Rt.) New Orleans, Louisiana
Bill Freedman Professor
Department of Biology and School for Resource and Environmental Studies
Dalhousie University
Halifax, Nova Scotia, Canada Antonio Farina, M.D., Ph.D.
Department of Embryology, Obstetrics, and Gynecology
University of Bologna Bologna, Italy
G. Thomas Farmer, Ph.D., R.G.
Earth & Environmental Sciences Division Los Alamos National Laboratory
Los Alamos, New Mexico Jeffrey C. Hall
Lowell Observatory Flagstaff, Arizona Clayton Harris Associate Professor
Department of Geography and Geology Middle Tennessee State University Murfreesboro, Tennesses
Lyal Harris, Ph.D.
Tectonics Special Research Centre Department of Geology & Geophysics
ADVISORY BOARD
The University of Western Australia Perth, Australia
Edward J. Hollox, Ph.D. Queen’s Medical Centre University of Nottingham Nottingham, England
Brian D. Hoyle, Ph.D. (Microbiology) Microbiologist
Square Rainbow Nova Scotia, Canada Alexander I. Ioffe, Ph.D. Senior Scientist
Geological Institute of the Russian Academy of Sciences
Moscow, Russia Jennifer L. McGrath Northwood High School Nappannee, Indiana David T. King Jr., Ph.D. Professor
Department of Geology Auburn University Auburn, Alabama Danila Morano, M.D.
Department of Embryology, Obstetrics, and Gynecology
University of Bologna Bologna, Italy
Abdel Hakim Ben Nasr, Ph.D. Department of Genetics
Molecular Oncology and Development
Program/Boyer Center for Molecular Medicine Yale University School of Medicine
New Haven, Connecticut William S. Pretzer Curator
Henry Ford Museum and Greenfield Village Dearborn, Michigan
Judyth Sassoon, Ph.D., ARCS
Department of Biology and Biochemistry University of Bath
Bath, England, U.K. Yavor Shopov, Ph.D.
Professor of Geology & Geophysics University of Sofia
Bulgaria
Theodore Snow
Professor, Department of Astrophysical and Planetary Sciences
Fellow, Center for Astrophysics and Space Astronomy University of Colorado at Boulder
Boulder, Colorado
Michael J. Sullivan, M.D., Ph.D., FRACP Cancer Genetics Laboratory
University of Otago Dunedin, New Zealand Constance K. Stein, Ph.D.
Director of Cytogenetics, Assistant Director of Molecular Diagnostics
SUNY Upstate Medical University Syracuse, New York
Robert Wolke Professor emeritus Department of Chemistry University of Pittsburgh Pittsburgh, Pennsylvania Richard Addison Wood Meteorological Consultant Tucson, Arizona
Diego F. Wyszynski, M.D., Ph.D. Department of Medicine, Epidemiology &
Biostatistics
Boston University School of Medicine Boston, Massachusetts
Rashmi Venkateswaran Undergraduate Lab Coordinator Department of Chemistry University of Ottawa Ottawa, Ontario, Canada
LIBRARIAN ADVISORS
Donna Miller Director
Craig-Moffet County Library Craig, Colorado
Judy Williams Media Center
Greenwich High School Greenwich, Connecticut Carol Wishmeyer
Science and Technology Department Detroit Public Library
Detroit, Michigan
Advisor
y Boar
Nasrine Adibe Professor Emeritus Department of Education Long Island University Westbury, New York Mary D. Albanese Department of English University of Alaska Juneau, Alaska Margaret Alic Science Writer
Eastsound, Washington James L. Anderson Soil Science Department University of Minnesota St. Paul, Minnesota Monica Anderson Science Writer
Hoffman Estates, Illinois Susan Andrew
Teaching Assistant University of Maryland Washington, DC John Appel Director
Fundación Museo de Ciencia y Tecnología
Popayán, Colombia David Ball
Assistant Professor Department of Chemistry Cleveland State University Cleveland, Ohio
T. Parker Bishop Professor
Middle Grades and Secondary Education
Georgia Southern University Statesboro, Georgia
Carolyn Black Professor
Incarnate Word College San Antonio, Texas Larry Blaser Science Writer Lebanon, Tennessee Jean F. Blashfield Science Writer Walworth, Wisconsin Richard L. Branham Jr. Director
Centro Rigional de
Investigaciones Científicas y Tecnológicas
Mendoza, Argentina Patricia Braus Editor
American Demographics Rochester, New York David L. Brock Biology Instructor St. Louis, Missouri Leona B. Bronstein Chemistry Teacher (retired) East Lansing High School Okemos, Michigan Dana M. Barry
Editor and Technical Writer Center for Advanced Materials
Processing
Clarkston University Potsdam, New York Puja Batra
Department of Zoology Michigan State University East Lansing, Michigan Donald Beaty
Professor Emeritus College of San Mateo San Mateo, California Eugene C. Beckham
Department of Mathematics and Science
Northwood Institute Midland, Michigan Martin Beech Research Associate Department of Astronomy University of Western Ontario London, Ontario, Canada Julie Berwald, Ph.D. (Ocean
Sciences) Austin, Texas Massimo D. Bezoari Associate Professor Department of Chemistry Huntingdon College Montgomery, Alabama John M. Bishop III Translator
New York, New York
Sarah de Forest
David Goings, Ph.D. (Geology) Geologist
Amy Kenyon-Campbell University College of the Fraser
Valley Reuben H. Fleet Space Theater
and Science Center San Diego, California Adrienne Wilmoth Lerner Graduate School of Arts &
G. H. Miller
University of Arkansas at Little Rock
Vita Richman
University of Colorado at Boulder Boulder, Colorado
Department of Earth and Physical Sciences
Policy Analyst, Air Quality Issues U.S. General Accounting Office Raleigh, North Carolina
Laurie Toupin Science Writer
Pepperell, Massachusetts Melvin Tracy
Science Educator Appleton, Wisconsin Karen Trentelman Research Associate Archaeometric Laboratory University of Toronto Toronto, Ontario, Canada Robert K. Tyson Senior Scientist W. J. Schafer Assoc. Jupiter, Florida James Van Allen Professor Emeritus Department of Physics and
Astronomy University of Iowa Iowa City, Iowa Julia M. Van Denack Biology Instructor Silver Lake College Manitowoc, Wisconsin Kurt Vandervoort
Department of Chemistry and Physics
West Carolina University Cullowhee, North Carolina Chester Vander Zee Naturalist, Science Educator Volga, South Dakota
Pella, Iowa
Frederick R. West Astronomer
Hanover, Pennsylvania Glenn Whiteside Science Writer Wichita, Kansas John C. Whitmer Professor
Department of Chemistry Western Washington University Bellingham, Washington Donald H. Williams Department of Chemistry Hope College
Holland, Michigan Robert L. Wolke Professor Emeritus Department of Chemistry University of Pittsburgh Pittsburgh, Pennsylvania Xiaomei Zhu, Ph.D.
Postdoctoral research associate Immunology Department Chicago Children’s Memorial
Hospital, Northwestern University Medical School Chicago, Illinois
Jim Zurasky Optical Physicist
Nichols Research Corporation Huntsville, Alabama
Rashmi Venkateswaran Undergraduate Lab Coordinator Department of Chemistry University of Ottawa Ottawa, Ontario, Canada R. A. Virkar
Chair
Department of Biological Sciences
Kean College Iselin, New Jersey Kurt C. Wagner Instructor
South Carolina Governor’s School for Science and Technology
Hartsville, South Carolina Cynthia Washam Science Writer Jensen Beach, Florida Terry Watkins Science Writer Indianapolis, Indiana Joseph D. Wassersug Physician
Boca Raton, Florida Tom Watson
Environmental Writer Seattle, Washington Jeffrey Weld
Instructor, Science Department Chair
Pella High School
Star formation
The Pleiades open star cluster (M45), which is situated in the constellation Taurus. The Pleiades cluster is about 400 light years from Earth and is young (only about 50 million years old) on a galactic time scale. The cluster is still em-bedded in a cloud of cold gas and interstellar dust, material left over from its formation. Photo Researchers, Inc. Repro-duced by permission.
Star cluster
Starclusters are groups of stars that occur close to each other in space, appear to have roughly similar ages, and therefore, seem to have had a common origin. Star clusters are typically classified into one of two large sub-groups, galactic clusters and globular clusters. Galactic clusters are sometimes also known as open clusters. As-tronomers have identified thousands of galactic star clus-ters in the Milky Way, but no more than about 200 glob-ular star clusters.
The two types of star clusters found in the Milky Way differ from each other in a number of ways. First, galactic clusters occur in the planeof the galaxy, while globular clusters are found outside the galactic plane in the region known as the galactic halo. Second, globular clusters tend to be much larger than galactic clusters with an average of a few thousand to a million stars in the former and a few hundred stars in the latter. In fact, some galactic clusters contain no more than a half dozen stars. Probably the most famous of all galactic clusters is the Pleiades, or the Seven Sisters. This grouping consists of six or seven stars as seen by the naked eye(depending on the accuracy of one’s eye-sight), but of many more when viewed by telescope. Third, globular clusters, as their name suggests, tend to have a rather clearly defined spherical shape with a higher con-centration of stars at the center of the sphere. In contrast, galactic clusters, as their alternative name also suggests, tend to be more open and lacking in any regular shape.
Fourth, the compositions of stars found in each kind of cluster are quite different. The stars that make up galac-tic clusters tend to consist primarily of hydrogen(more
than 90%) and helium (almost 10%), with small amounts of heavier elements (less than 1%). Stars in globular clus-ters, on the other hand, contain even smaller amounts of heavier elements. This difference suggests that the stars in galactic clusters are much younger than those in globular clusters. When the latter were formed, the universe still consisted almost entirely of hydrogen and helium, so those were the only elements used in the formation of globular cluster stars. Much later in the history of the uni-verse, some heavier elements had been formed and were present at the formation of galactic cluster stars.
Star formation
Starformation is the process by which a cold, dark cloud of gas and dust is transformed into a brilliant star with a surface temperature anywhere from 3,000-50,000K (4,900–90,000°F; 2,700–50,000°C). Many re-gions of our galaxyare filled with cold cloudsof gas that begin to contract, under certain conditions, as a re-sult of their own gravitational attraction. As one of these clouds contracts, it heats up and tends to become spheri-cal. The heating, however, produces pressurein the gas that counteracts the contraction, and eventually the con-traction may stop if the gravity and gas pressure balance one another. If the cloud has become hot enough to begin thermonuclear fusion reactions at its center, it can then sustain itself against its own gravity for a long time. Such a cloud is then called a star.
The interstellar medium
When you look up on a clear night, you see stars— thousands of them—glittering against the seemingly empty backdrop of space. But there is something else out there; vast clouds of cold, dark gas and dust, visible only by the dimming effect they have on starlight shining through them. This is the interstellar medium, and it is the birthplace of the stars.
In most places the interstellar medium is almost a vacuum, a million trillion times less dense than air. In other places, however, there are much greater concentra-tions of clouds, sometimes so thick and dense that we cannot see through them at all. Such a cloud is the fa-mous Horsehead Nebula in the constellation Orion. Often these clouds are enormous, thousands of times as massive as the Sun.
Horse-Star formation
An infrared image of the molecular cloud and region of star formation NGC 7538. The bright areas (just below center, and left of bottom center) are sites where stellar formation is taking place. Giant clouds of dust are fragmenting and forming new protostar systems; the ultraviolet radiation of the newborn stars is lighting up the surrounding dust. The larger hazy glow (right of top center) is radiation from the protostars pouring out from a gap in the dust clouds.Photograph by Ian Gatley. Photo Researchers, Inc. Reproduced by permission.
particles are squeezed together, their mutual gravitation-al attraction grows. So tightly are they now packed that they begin to coalesce under their own gravity. The shock has transformed the cloud: many parts are still thin and diffuse, but now there are multitudes of condensing blobs of gas. They did not contract by themselves before, but now they have been given the necessary impetus.
When a blob of gas condenses,energyis released, and one of the beautiful theorems of physicsshows us that half the energy goes into heating the gas. So as the blobs in the disrupted cloud condense, they get progres-sively hotter. Eventually they begin to glow a dull red, much as an electric burner on your stove begins to glow when it becomes sufficiently hot.
This process of contraction cannot continue indefi-nitely. As the temperature in a contracting blob of gas becomes higher, the gas exerts a pressure that counter-acts the inward forceof gravity. At this point, perhaps millions of years after the shock wave slammed into the dark cloud, the contraction stops. If the blob of gas has become hot enough at its center to begin thermonuclear head Nebula, the matteris much more thinly distributed
than in the Sun. Therefore, the matter in the cloud tends not to condense. It remains roughly the same size, slowly changing its shape over the course of millennia.
The birth of a star
Imagine a cloud, drifting along through the interstel-lar medium. The cloud is unthinkably cold, in excess of -400°F (-240°C). It is not very dense, but it is so large that it renders the stars behind it either invisible or as dim, red points of light. It is made mostly of hydrogen, and has had its present shape and size for thousands of years.
Then, one year, something happens. A hundred par-secs away (about 190 trillion miles), a star explodes. It is a supernova, the violent end to a massive star’s life. An expanding, devastating blast races outward, forming a shock wave. It sweeps everything before it, clearing the space through which it passes of the interstellar medium. And eventually, it encounters the cloud.
fusion of hydrogen into helium, it will remain in this sta-ble configuration for millions or billions of years. It has become a star.
Nature is filled with symmetries, and this is one of the most enchanting. The death of one star triggers the birth of new stars. And what of the rest of the dead star, the expanding blast of gas and dust that encountered no interstellar clouds? Eventually it comes to a halt, cooling and fading into darkness, where it becomes part of the interstellar medium. Perhaps, millions of years in the fu-ture, a shock wave will plow into it.
Other methods of star formation
The scenario described above leads to a situation like that shown in the Great Orion Nebula. Brilliant, newly born stars blaze in the foreground, while the great cloud surrounding them glows in the background. This nebula glows because the intense radiation from the massive young stars near it is heating it. Contrast this with the Horsehead Nebula, which has no such sources of heatand therefore is dark.
These newly formed stars can themselves trigger star formation. Radiation—that is, light—exerts pressure on surrounding matter. The young stars in the Orion Nebula are huge by stellar standards, and their radiation is intense. Many of them lose masscontinuously in a stellar wind that streams out into the cloud. After a few million years, the most massive of them will explode as supernovae. These effects can cause other parts of the neighboring cloud to begin contracting. Therefore, star formation might be able to bootstrap its way through an entire cloud, even if only part of the cloud is disrupted by a shock wave.
An interstellar cloud does not always have to be dis-rupted by a shock wave to form stars, however. Some-times a cloud may collapse spontaneously, and the process describing this phenomenon was discovered by the as-tronomer James Jeans (1877-1947). Above the so-called “Jeans mass,” which depends on the temperature and den-sityof the cloud, a cloud will break up and contract spon-taneously under its own gravity. Large clouds can break up into numerous cloudlets this way, and this process leads to the formation of star clusterssuch as the Pleiades. Often, two stars will form very close to one another, sometimes separated by a distance less than that from the Earthto the Sun. These binarysystems, as well as multi-plesystems containing three to six stars, are quite com-mon. They are more common, in fact, than single stars: most of the stars you see at night are actually binaries.
Current research on star formation
An important avenue of research involves studying the cycle of star births and deaths in the galaxy. Formation
of stars depletes the interstellar medium, since some of its gas goes into making the stars. But then, as a star shines, a small part of its matter escapes its gravity and returns to the interstellar medium. More importantly, massive stars return a large fraction of their matter to the interstellar medium when they explode and die. This cycle of deple-tion and replenishment is critically important in under-standing the types of stars we see in the galaxy, and the evolutionof the galactic system as a whole.
The advent of powerful new telescopes like the Hubble Space Telescopehas opened astronomer’s eyes to new stars that may require new theories of formation. In 1997 the brightest star ever seen was discovered at the core of our own galaxy, the Milky Way. Named the Pis-tol Star, it has the energy of 10 million Suns and would fill the distance of the Earth’s orbitaround the Sun. The Pistol Star is about 25,000 light-years from Earth; it is so turbulent that its eruptions create a gas cloud four light-years across. It had been thought that a star so big could not have formed without blowing itself apart, and so the Pistol Star may require astronomers to reexamine their ideas about stellar formation, especially of supermassive stars near the centers of galaxies.
While some astronomers study the galactic or the in-terstellar medium, others study newly forming proto-stars. Protostars are hot, condensing blobs of gas that have not quite yet achieved starhood, and they are hard to observe for two reasons. First, the phase of star forma-tion is quite short by astronomical standards, so there are not nearly as many protostars as there are fully formed stars. Second, protostars are often thickly shrouded by the remnants of the cloud from which they are forming. This makes them appear much dimmer, and so much harder to observe and study.
Fortunately, newly forming stars do have some ob-servable characteristics. A protostar may be girdled by a disk of dust and gas, and an exciting possibility is that these disks are protoplanetary systems. Our own solar systemis thought to have formed from such a disk that surrounded the newly forming Sun, and disks around other stars such as Beta Pictoris may be current sites of planetary formation. Additionally, a protostar with a disk may produce two “beams” of gas that stream outward from its poles along the lines of magnetic field associat-ed with the disk. These so-callassociat-ed bipolar outflowsare classic signatures of a protostar with a disk.
It is not necessary to observe only our own Milky Way Galaxy to find newly forming stars. Modern tele-scopes, including the Hubble Space Telescope, are used to study star-forming regions in other galaxies. High-res-olution observations can detect individual stars in the Milky Way’s satellitegalaxies and in some other nearby
galaxies. In more distant galaxies, the regions of heated gas produced by new stars are visible. Observations of star formation in other parts of the Universe help confirm and give us a broader perspective on our theories regard-ing star formation in our own celestial neighborhood.
See also Binary star; Gravity and gravitation; Inter-stellar matter; Star cluster; Stellar evolution.
Resources
Periodicals
Croswell, K. “Galactic Archaeology.”Astronomy(July 1992): 28. Meyer. “Quasars From a Complete Spectroscopic Survey.”
Monthly Notices of the Royal Astronomical Society324, no. 2 (2001): 2001.
O’ Dell, C.R., “Secrets of the Orion Nebula.”Sky & Telescope
(Dec 1994): 20.
Jeffrey C. Hall
Starburst galaxy
Billions of large, essentially independent groups of stars exist in the universe. These are called galaxies. A galaxyis labeled a starburst galaxy if an exceptionally high rateof star formationis found to be taking place within it. This often occurs in galaxies that are in the process of or have recently undergone a merging or colli-sion with another galaxy. Although astronomers do not know exactly what causes starbursts in galaxies, or what creates observed ripples in gas and dust of the outer re-gions of some of them, both phenomena occur in colli-sions between galaxies. The gravitational pull of the stars of two galaxies passing close to one another seems to cause increased starformation activity and the rip-pling effect.
First identified by an excess of infrared (heat) radi-ationfrom dust within galaxies, violent star formation is usually associated with very distant galaxies. However, it is occurring in some of the nearby galaxies such as the closest starburst galaxy, NGC 253. Within a region 1,000 light-years (about six quadrillion miles) across, the Hub-ble Space Telescope(HST) high resolution camera has shown very bright star clusters, dust lanes, which trace regions of dense gas, and filaments of glowing gas in the starburst core of this galaxy. The HST has identified sev-eral regions of intense star formation, which include a bright, super-compact star cluster. This confirms the theory that stars are often born in dense clusters within starbursts. In NGC 253, dense gas coexists with and ob-scures the starburst core. Other measurements revealed unusual motions of the gas in the nucleus of NGC 253,
which seem to indicate a fast-rotating ring of cold gas as well as gas flowing outward from the nucleus. Similar features have been found in other starburst galaxies.
Ground-based telescopes have shown that the core of one starburst galaxy contains massive clumps of young stars and nebulous ripples in its outermost stellar disk. These observations were made long after any colli-sion, but it is expected that this galaxy, and all starburst galaxies, will eventually settle down to reduced star for-mation levels, and may one day resemble normal spiral galaxies similar to the Milky Way.
Clint Hatchett
Starch
see
Carbohydrate
Starfish
Starfish are marine invertebrates in the phylum Echinodermata, which also includes sea urchins, brittle stars, sea lilies, and sea cucumbers. Starfish belong to the class Asteroidea, which includes 1,500 speciesinhabiting the shallow margins of all of the world’s oceans. Starfish vary widely in appearance. Some species grow up to 3 ft (1 m) in diameter; others are barely 0.5 in (1.3 cm) across. Starfish come in a rainbow of colors including bright red, cobalt blue, yellows, and the familiar orange-brown.
Starfish are radially symmetrical with from 5 to 50 arms radiating from a central disk. The skin of starfish is thick with bony plates (ossicles), spines, tiny pincers on stalks (the pedicillerae which keep the animal’s skin clean of debris), and bumps, between which are tiny folds of skin which function as the starfish’s gills.
The nervous system of starfish consists of three main networks: the ectoneural (oral), the hyponeural (deep oral), and the entoneuoral (aboral) systems. There is no central ganglion, but this rather simple arrangement effectively allows the starfish to move (including the ability to right itself should it be turned over) and sense the world around it.
The eyes of starfish are extremely simple, are located at the tip of each arm, and are primarily light-sensing dots. Starfish can tell lightfrom dark, but are unlikely to see much more than that. The sense of smell, however, is quite sensitive. Chemoreceptors on the starfish’s skin can detect the faintest smell of its prey(clams), and even de-termine the direction from which it is coming. The starfish then sets off to catch its prey, slowly and deliberately, at the rate of 6 in (15.25 cm) per minute. As it moves it does
Starlings
An ochre sea star (Pisaster ochraceus) on the California coast.Photograph by Robert J. Huffman. Field Mark Publica-tions. Reproduced by permission.
not pinwheel, but follows one arm. The underside of each arm is lined with hundreds of tiny tube feet. Each tube foot ends in a suction cup, and is the terminal point of an elaborate hydraulic system within the animal.
This hydraulic system has as its starting point a small reddish spot on the top of the central disk, the madreporite. The madreporite is comparable to the drain of a sink, as it serves as the entry for water into the stone canal, which joins the ring canal, off which radi-ate the tubes that run down the starfish’s arms and branch off into the tube feet. Movement is an elaborate process for a creature with so many feet, which are ex-tended and placed on the substratum by filling each tube foot with water. To attach the tube foot, the starfish cre-ates suction by drawing water out again and closing a tiny valve on the ampulla, a bulb at the top of the tube. The animal then contracts a muscle and draws itself for-ward on its tube feet, which are tremendously strong and able to keep a starfish clinging to rocksin all but the heaviest storms.
Starfish also use their tube feet to prey on bivalve molluscs. When a starfish encounters a clam, it attaches its tube feet and begins to pull. It can pull for hours, or even days. Eventually, the clam’s adductor muscle that keeps the shell closed tires under this relentless tug, and the clam’s shell opens a bit. The starfish does not need much of an opening-just enough to get part of its diges-tive systemin. Starfish have two stomachs, one that re-mains inside the body and another than can be protruded through the starfish’s mouth on the underside of the body. The starfish inserts this into the clam’s shell, and releases digestive enzymes.
Because starfish lack teeth, they must convert their food to liquid form before they can ingest it. Among the other prey items this bottom-dwelling predator eats are sea urchins, other starfish, small fish,sponges, and carrion. Some species draw in mud as they crawl along the bottom and extract organic material from the mud. One genus,Acanthaster, (the crown-of-thorns starfish) has become famous for the damage it does to coral reefs, moving over the reef and stripping it clean of coral polyps. (The overabun-dance of the crown-of-thorns starfish can be partly at-tributed to the reduction in the population of its major predator, the giant triton, by humans.) Starfish have long been the bane of shellfishermen. In an effort to kill starfish, shellfishermen hack them to pieces and throw the pieces back into the sea. Unknown to hu-mans, all that was being done was the creation of more starfish, since starfish have remarkable regener-ative abilities; all species can regenerate lost arms, and some can produce a whole new starfish from an arm with a piece of the central disk attached.
Although such regeneration is a form of reproduc-tion, starfish generally reproduce by shedding eggs and sperm into the water. Once one female releases her eggs (up to 2.5 million at a time), other starfish nearby join in a kind of breeding frenzy, all releasing their sperm or eggs. The eggs float free with the planktonand develop into bipinnaria larvae, which remain free floating for an-other three weeks. They then settle to the bottom and metamorphose into the familiar starshapes.
See also Brittle star; Sea lily.
Resources
Books
Brusca, Richard C., and Gary J. Brusca. Invertebrates. Sunder-land, MA: Sinaur Associates, 1990.
Whiteman, Kate. World Encyclopedia of Fish & Shellfish.New York: Lorenz Books, 2000.
F. C. Nicholson
Starlings
Starlings
A flock of starlings swarming telephone poles.Photograph by Richard R. Hansen. Photo Researchers, Inc. Reproduced by permission.
Golden-breasted starling perched on a branch. Photograph by Tom & Pat Leeson. Photo Researchers, Inc. Reproduced by permission.
gions of Eurasia,North America, and Australia. This starling was first successfully introduced to North America in 1890 in Central Park, New York City, when 60 birds were released. There had been earlier releases of common starlings by homesick European immi-grants, but these had failed to establish a breeding pop-ulation. However, once the common starling became lo-cally established in New York, it expanded its range ex-plosively, and this species now occurs throughout most of temperate North America. In recent decades the Eu-ropean starling has consistently been the most numer-ous species tallied on the annual Christmas bird counts, and it may now be the most abundant species of bird in North America.
The European starling is an attractive bird, especial-ly during the late winter to summer when it bears its dark-glossy, spotted, nuptial plumage. These short-tailed birds flock together during the non-breeding season, and they sometimes occur in huge aggregations of hundreds of thousands of birds. The European starling forages widely for invertebrates, especially insectsliving in the ground or in grass. During winter this bird mostly eats grains and other seeds. Although not a very accom-plished singer, the renditions of the European starling are interesting, rambling assemblages of squeaks, whistles, gurgles, and imitations of the songs of other birds, and also of other sounds, such as squeaky clotheslines. Be-cause the European starling is so common and lives in cities and most agricultural areas, it is possibly the most usually inventive and consist of garrulous chatters of
whistles, squeaks, and imitated sounds. Starlings feed widely on small invertebratesand fruits. Most species nest in cavities in trees or rocks, and both sexes cooper-ate in the feeding and rearing of the young.
Most species of starlings, including the mynah bird, are distributed in tropical regions. Some of these are ex-tremely beautiful birds. In Africa, for example, some of the most attractive bird species are starlings, with their brilliant metallic-green, blue, purple, and violet plumage. Notable are the long-tailed glossy starling (Lamprotornis caudtus), the chestnut-bellied starling (Spreo pulcher), and the superb starling (Spreo super-bus). The African starlings also include the oxpeckers (Buphagus), which glean ticks and blood-sucking flies off the back of large mammals.
Many species of starlings are endangered because of the widespread destruction of their natural habitat (trop-ical forest, savanna, or shrubland). For example, the beautifully white Rothschild’s mynah (Leucospar roth-schildi) of Bali, Indonesia, is endangered because its nat-ural forest has been extensively cleared and converted into agricultural use.
Starlings in North America
re-frequently heard and seen bird in North America, and also in much of the rest of the temperate world.
Another starling introduced to North America is the crested mynah (Acridotheres cristatellus), released in Vancouver in the 1890s, where it became established but did not spread more widely.
Importance of starlings
A few species of starlings are considered to be im-portant pests. For example, in North America the Euro-pean starling is widely regarded as a problem when it oc-curs in large numbers. This species has contributed to the decline of some native species of birds, by competitively displacing them from nesting cavities, which are usually in short supply. Various native birds have been affected by this competitionwith starlings, including the eastern and mountain bluebirds(Sialia sialisand S. mexicanus, respectively), the tree swallow (Iridoprocne bicolor), and the red-headed woodpecker (Melanerpes erythro-cephalus). The European starling can also foul buildings with its excrement, corroding stone and metals and creat-ing a health hazard to people through exposure to patho-genic fungi. In addition, the European starling some-times causes agricultural damage, especially to certain tender fruits, such as cherries. For similar reasons, the Indian mynah (Acridotheres tristis) is often considered a pest in tropical regions.
However, these abundant species of starlings are also beneficial in some respects, because they eat large num-bers of potentially injurious insects, such as cutworms and other beetle larvae that can damage lawns. The Euro-pean starling and Indian mynah are also among the few non-human animals that can tolerate urban environments, and these birds provide an aesthetic benefit in cities.
A few species of starlings are easily bred in captivi-ty, and are important in the pet trade. The best known ex-ample of this is the hill mynah (Gracula religiosa), na-tive to South and Southeast Asiaand widely kept as a pet. This attractive species maintains a busy and noisy chatter, and can be easily trained to mimic human words and phrases.
See also Introduced species.
Bill Freedman
States of matter
Matterincludes all the material that makes up the universe. It has massand it takes up space. It includes
everything around us: the food we eat, the water we drink, the air we breathe, the ores deep within the earth, as well as the atmosphere above it, the substances that make up the moon, and the stars as well as the dust in the tail of a comet. It is fairly easy to observe that matter exists in different forms or states: solids, liquids, gases, and the less familiar plasmastate.
Nature of matter
All matter is composed of very small, discrete parti-cles, either atoms, ions, or molecules. The nature of a particular substance depends on the type and arrange-ment of the atoms within the molecule.
It is possible for these particles to assume different arrangements in space. For example, they can be arranged close together or far apart. They can be neat and orderly or randomand disordered. Since two parti-cles cannot occupy the same place at the same time, they can be pushed closer together only if there is empty space between particles. Sometimes they slip and slide past each other and sometimes they are locked rigidly into a specific position. The state in which any particular piece of matter exists depends on these properties. Under the right conditions, any substance can exist in all of the states of matter: solid, liquid, gas, or plasma.
The atoms, molecules, and ions that make up all matter are in constant motion, which can range from vi-brating within a fairly rigid position to moving randomly at very high speeds. Movement is always in a straight line until some other forceinterferes with the motion. Like billiard balls, the moving particles can hit other par-ticles or objects such as the walls of their container. These collisions cause the particles to change direction and, although no energyis lost, it can be transferred to other particles.
Various forces exist between the particles of matter. The degree of attraction or repulsion depends on such factors as whether the particles are electrically neutral or carry a charge, whether the charges are localized or bal-anced out, how big or small the particles are, and how far apart the particles are from each other.
Solids
Matter is said to be in the solid state when it is rigid, that is, when it retains a definite shape and volume against the pull of gravity. Strong attractive forces exist among the particles that make up solids, causing them to position themselves close together in an orderly and def-inite arrangement in space. Their motion consists mainly of vibrating in a fixed position so the shape and the vol-ume (amount of space they occupy) are maintained. The
States of matter
A piece of SEAgel sitting on soap bubbles. SEAgel (Safe Emulsion Agar gel) is a material claimed to be the first lighter-than-air solid. It is made from agar, a seaweed derivative used as a thickening agent in the food industry, and is biodegrad-able. SEAgel could be used as a thermal insulator instead of plastic foam or balsa wood. High density SEAgel could be used instead of plastic packaging. The substance is soluble in water above 122°F (50°C).Lawrence Livermore National Lab-oratory/Science Photo Library, National Audubon Society Collec-tion/Photo Researchers, Inc. Reproduced by permission.
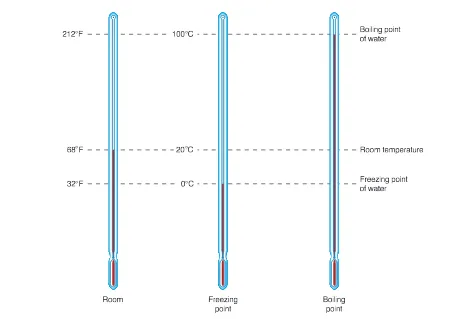
strength of the attractions between the particles. In gen-eral, heavier particles require more energy (higher tem-peratures) in order to vibrate vigorously enough to come apart. Also, the stronger the attractions between the par-ticles, the more energy is required to break them apart and change the solid into a liquid. In both cases—heav-ier particles and stronger attractions—the melting point will be higher. Water serves as a good example. Liquid water freezes at the same temperature that icemelts, and the melting and freezing points are therefore identical. This is true for all substances. Ice melts at 32°F (0°C) which is uncharacteristically high for particles the weight of water molecules. This unusually high melt-ing/freezing point is caused by the very strong attractive forces that exist between the molecules, making it very difficult for particles to move away from their neighbors and for the crystalline structure to collapse. Metals melt at much higher temperatures than ice. For example, cop-peris made into various shapes by melting it at 1,985°F (1,085°C), pouring it into molds, and cooling it. It is then usually purified further by electrolysisbefore it is com-mercially useful. Since pure substances have unique melting points which are usually quite easy to determine, chemists often use them as the first step in identifying unknown substances.
The amount of energy required to change a solid to a liquid varies from substance to substance. This energy is called the heatof fusion. Ice, for example, must ab-sorb 80 calories per gram in order to melt into liquid water. Similarly, water releases 80 calories per gram of water to freeze into ice. Each of these changes occurs at the melting/freezing point of water, 32°F (0°C). In melt-ing, since all the heat energy is used up in breaking the crystalline lattice, there is no change in temperature. However, once all the ice has melted, the absorbed ener-gy causes the temperature of the liquid water to rise. This is generally true of the melting of all solids.
Liquids
The change from solid to liquid is a physical rather than chemical change because no chemical bonds have been broken. The individual particles—atoms, ions, or molecules—that made up the solid are the same individual particles that make up the liquid. What does change is the arrangement of the particles. In the liquid, the particles are at a higher temperature, having more energy than in the solid, and this allows them to move away from their near-est neighbors. The attractions between liquid particles, though less than those of solids, is still fairly strong. This keeps the particles close to each other and touching, even though they can around past one another. They cannot be pushed closer together, and so, like solids, liquids main-tain their volume and cannot be compressed. Because atoms, ions, or molecules cannot be pushed closer
to-gether; therefore, solids cannot be compressed.
Many solids exist in the form of crystals, which have simple geometric shapes, reflecting the regular spa-tial arrangement forms and shapes depending on the arrangement of the atoms, ions, or molecules of which they are made. This arrangement is called a lattice. Other solids, such as lumps of clay, seem to have no preferred shapes at all. They are said to be amorphous (without form). This is true because the individual crystals may be very tiny or because the substance consists of several kinds of crystals, randomly mixed together. Other solids, such as glass, contain no crystals at all.
When solids are cooled to lower temperatures, the orderly arrangement of their particles stays basically the same. The vibrations become slightly slower and weaker, however, causing the particles to move closer together, and the solid contracts slightly. But when solids are heat-ed, the vibrations become faster and broader. This causes the particles to move slightly farther apart, and the solid expands a little. If heated enough, the particles will vi-brate so vigorously that the rigid structure can no longer be maintained. The lattice begins to fall apart, first into clumps, and eventually into individual particles which can slip and slide past each other as they move about freely. At this point, the solid has become a liquid.
States of matter
Gallium melts at 86°F (30° C). © Yoav Levy/Phototake NYC. Reproduced with permission.
their particles move freely around, liquids can flow, and they will assume the shape of any container.
Like solids, the particles of liquids are close to each other; therefore, the amount of space occupied by liquids is quite close to that of their corresponding solids. How-ever, because of the disorderly arrangement, the empty space between the liquid particles is usually slightly greater than that between the particles of the solid. There-fore, liquids usually have a slightly larger volume-that is, they are less dense-than solids. A very unusual exception to this is the case of ice melting to form water, when the volume actually decreases. The crystalline lattice of ice has a cage-like structure of H2O molecules with big, open
spaces in the middle of the cages. When the ice melts and the crystalbreaks down, the cages collapse and the mole-cules move closer together, taking up less space. Conse-quently, a given weight of water occupies more volume as ice than as liquid. In other words, ice is less dense than water. Therefore, ice floats on liquid water. Also, a full, closed container of water will break as it freezes because the ice must expand. A water pipe may break if it freezes in winter because of this unusual property of water.
Boiling
As the temperature of a liquid is increased, the parti-cles gain more energy and move faster and faster. Jostling about and colliding increases until eventually the particles at the surface gain enough energy to over-come the attractive forces from their neighbors and break away into the surrounding space. At this point, the liquid is becoming a gas (also called a vapor). The temperature at which this happens depends on what the substance is. This temperature, known as the boiling point, remains constant during the entire process of boiling because the added heat is being used up to break the attraction be-tween the particles. The reverse process, condensation, occurs at the same temperature as boiling. Like the melt-ing point, the boilmelt-ing point is unique for each pure sub-stance, and can be used as an analytical tool for deter-mining the identities of unknown substances.
The amount of energy required for a given amount of a liquid to vaporize or become a gas is called the heat of vaporization (or condensation). It varies from stance to substance because the particle of different sub-stances may be heavier or lighter and may exert different attractive forces. The amount of energy absorbed when 1 gram of water completely changes to a vapor is 540 calo-ries. Conversely, 540 calories are released when 1 gram of water vapor changes back to liquid.
When a liquid reaches the boiling point, particles on the surface actually gain enough energy to break away from the surface. But as heating continues, particles
throughout the liquid are also increasing in energy and moving faster. In a body of the liquid, however, the parti-cles cannot escape into the air, as those on the surface can. That is not only because they happen to be buried deep down below the surface. It is also because the atmosphere is pushing down on the entire liquid and all the particles within it, and, in order to break away, these particles deep within the liquid must acquire enough energy to overcome this additional pressure. (The surface particles can just fly off into the spaces between the air molecules.) When a group of interior particles finally do get enough energy-get hot enough-to overcome the atmospheric pressure, they can push each other away, leaving a hollow space within the liquid. This is a bubble. It is not entirely empty, howev-er, because it contains many trapped particles, flying around inside. The light-weight bubble then rises through the liquid and breaks at the surface, releasing its trapped particles as vapor. We then say the liquid is boiling.
Since the pressure inside the bubbles must overcome atmospheric pressure in order for the bubbles to form, the boiling point of a substance depends on atmospheric pressure. Liquids will boil at lower temperatures if the atmospheric pressure is lower, as it is on a mountain. At the top of Mount Everest, 29,000 ft (8,839 m) above sea level, where the pressure is only about one-third that at sea level, water boils at 158°F (70°C). At 10,000 ft (3,048 m) above sea level, water boils at 192°F (89°C). It would take longer to cook an egg where the boiling point is 192°F (89°C) than at sea level where the boiling point is 212°F (100°C). The normal boiling point of a liquid is defined as its boiling point when the atmospheric pres-sure is exactly 760 mm Hg, or 1 atmosphere.
desalinating-removing the saltfrom sea water in order to make it use-ful for human consumption, agriculture, and industry. Changes in state, both boiling and freezing, are useful for this purpose. When salt water is heated to boiling and the vapors cooled, they condense to form water again, but the salt stays behind in a very salty residue called brine. By this process, called distillation,freshwater has been recovered from salt water. Similarly, when salt water freezes, much of the salt stays behind as a very salty slush. The ice is removed from the brine and melted to produce relatively fresh water.
Gases
When a substance has reached the gaseous state, the particles are moving at relatively high speeds, and in straight lines, until they encounter other particles or some other barrier. The spaces between the particles are many times the size of the particles themselves. Generally, gas particles travel large distances through space before col-liding with another particle or object. When colcol-liding, al-though energy can be lost by one particle, it is gained by another and there is no net gain or loss of energy.
Because the particles are flying freely in the gaseous state, gases will fill whatever space is available to them. Thus, 100, 1000, or ten million particles of gas in a con-tainer spread out and fill the entire concon-tainer.
Plasma
Plasmas are considered by some to be the fourth phase of matter. They are closely related to gases. In a plasma, the particles are neither atoms nor molecules, but electrons and positive ions. Plasmas can be formed at very high temperatures-high enough to ionize (remove elec-trons from) the atoms. The resulting elecelec-trons and positive ions can then move freely, like the particles in a gas. Al-though not found on Earth except in the outermost atmos-phere, plasmas are probably more prevalent in the uni-verse than all of the other three states of matter. The stars, comets’ tails, and the aurora borealis are all plasmas. Be-cause their particles are electrically charged, plasmas are greatly influenced by electric and magnetic fields.
Much research today involves the study of plasmas and the ability to control them. One possible method for producing enormous amounts of energy through nuclear fusioninvolves the production and control of plasmas.
See also Density; Desalination; Evaporation; Gases, properties of.
Resources
Books
Caro, Paul. Water.New York: McGraw Hill, 1993.
Close, Frank. Too Hot to Handle: The Race for Cold Fusion.
Princeton: Princeton University Press, 1991.
Periodicals
Burgess, David. “Stronger than Atoms.”New Scientist140, (November 1993): 28-33.
Fortman, John J. “States of Matter.”Journal of Chemical Edu-cation70, (January 1993): 56-57.
Leona B. Bronstein
Static electricity
see
Electrostatic devices
Statistical mechanics
Statistical mechanics is a sub-branch of physicsthat attempts to explain the behavior of a macroscopic tem based on the behavior and properties of that sys-tem’s microscopic elements.
The number of these microscopic elements is usual-ly very large, and it is impossible to accurateusual-ly predict the behavior of each of these elements as they interact. However, the large number of interactions makes it theo-retically possible for statistical mechanics to predict the behavior of the system as a whole.
Statistics
Statistics is that branch of mathematicsdevoted to the collection, compilation, display, and interpretation of numerical data. In general, the fieldcan be divided into two major subgroups,descriptive statisticsand inferen-tial statistics. The former subject deals primarily with the accumulation and presentation of numerical data, while the latter focuses on predictions that can be made based on those data.
Some fundamental concepts
Two fundamental concepts used in statistical analy-sis are population and sample. The term population
refers to a complete set of individuals, objects, or events that belong to some category. For example, all of the players who are employed by Major League Baseball teams make up the population of professional major league baseball players. The term samplerefers to some subset of a population that is representative of the total population. For example, one might go down the
com-Statistical mec
plete list of all major league baseball players and select every tenth name. That subset of every tenth name would then make up a sample of all professional major league baseball players.
Another concept of importance in statistics is the distinction between discrete and continuous data. Dis-crete variables are numbers that can have only certain specific numerical value that can be clearly separated from each other. For example, the number of profession-al major league basebprofession-all players is a discrete variable. There may be 400 or 410 or 475 or 615 professional baseball players, but never 400.5, 410.75, or 615.895.
Continuous variables may take any value whatsoev-er. The readings on a thermometerare an example of a continuous variable. The temperaturecan range from 10°C to 10.1°C to 10.2°C to 10.3°C (about 50°F) and so on upward or downward. Also, if a thermometer accurate enough is available, even finer divisions, such as 10.11°C, 10.12°C, and 10.13°C, can be made. Methods for dealing with discrete and continuous variables are somewhat different from each other in statistics.
In some cases, it is useful to treat continuous variable as discrete variables, and vice versa. For example, it might be helpful in some kind of statistical analysis to assume that temperatures can assume only discrete values, such as 5°C, 10°C, 15°C (41°F, 50°F, 59°F) and so on. It is impor-tant in making use of that statistical analysis, then, to rec-ognize that this kind of assumption has been made.
Collecting data
The first step in doing a statistical study is usually to obtain raw data. As an example, suppose that a researcher wants to know the number of female African-Americans in each of six age groups (1-19; 20-29; 30-39; 40-49; 50-59; and 60+) in the United States. One way to answer that question would be to do a population survey, that is, to
in-terview every single female African-American in the Unit-ed States and ask what her age is. Quite obviously, such a study would be very difficult and very expensive to com-plete. In fact, it would probably be impossible to do.
A more reasonable approach is to select a sample of female African-Americans that is smaller than the total population and to interview this sample. Then, if the sample is drawn so as to be truly representative of the total population, the researcher can draw some conclu-sions about the total population based on the findings ob-tained from the smaller sample.
Descriptive statistics
Perhaps the simplest way to report the results of the study described above is to make a table. The advantage of constructing a table of data is that a reader can get a gener-al idea about the findings of the study in a brief glance.
Graphical representation
The table shown above is one way of representing the frequency distribution of a sample or population. A fre-quency distributionis any method for summarizing data that shows the number of individuals or individualcases present in each given interval of measurement. In the table above, there are 5,382,025 female African-Ameri-cans in the age group 0-19; 2,982,305 in the age group 20-29; 2,587,550 in the age group 30-39; and so on.
A common method for expressing frequency distrib-utions in an easy-to-read form is a graph. Among the kinds of graphs used for the display of data are his-tograms, bar graphs, and line graphs. A histogram is a graph that consists of solid bars without any space be-tween them. The width of the bars corresponds to one of the variables being presented, and the height of the bars to a second variable. If we constructed a histogram based
Statistics
TABLE 1. STATISTICS
Number of Female African-Americans in Various Age Groups
Age Number
0 - 19 5,382,025
20 - 29 2,982,305
30 - 39 2,587,550
40 - 49 1,567,735
50 - 59 1,335,235
on the table shown above, the graph would have six bars, one for each of the six age groups included in the study. The height of the six bars would correspond to the fre-quency found for each group. The first bar (ages 0-19) would be nearly twice as high as the second (20-29) and third (30-39) bars since there are nearly twice as many individuals in the first group as in the second or third. The fourth, fifth, and six bars would be nearly the same height since there are about the same numbers of indi-viduals in each of these three groups.
Another kind of graph that can be constructed from a histogram is a frequency polygon. A frequency poly-gon can be made by joining the midpoints of the top lines of each bar in a histogram to each other.
Distribution curves
Finally, think of a histogram in which the vertical bars are very narrow...and then very, very narrow. As one connects the midpoints of these bars, the frequency poly-gon begins to look like a smooth curve, perhaps like a high, smoothly shaped hill. A curve of this kind is known as a distribution curve.
Probably the most familiar kind of distribution curve is one with a peak in the middle of the graph that falls off equally on both sides of the peak. This kind of distribu-tion curve is known as a “normal” curve. Normal curves result from a number of randomevents that occur in the world. For example, suppose you were to flip a penny a thousand times and count how many times heads and how many times tails came up. What you would find would be a normal distribution curve, with a peak at equal heads and tails. That means that, if you were to flip a penny many times, you would most commonly expect equal numbers of heads and tails. But the likelihood of some other distribution of heads and tails—such as 10% heads and 90% tails—would occur much less often.
Frequency distributions that are not normal are said to be skewed. In a skewed distribution curve, the number of cases on one side of the maximum is much smaller than the number of cases on the other side of the maxi-mum. The graph might start out at zero and rise very sharply to its maximum point and then drop down again on a very gradual slope to zero on the other side. De-pending on where the gradual slope is, the graph is said to be skewed to the left or to the right.
Other kinds of frequency distributions
Bar graphs look very much like histograms except that gaps are left between adjacent bars. This difference is based on the fact that bar graphs are usually used to rep-resent discrete data and the space between bars is a re-minder of the discrete character of the data represented.
Line graphs can also be used to represent continu-ous data. If one were to record the temperature once an hour all day long, a line graph could be constructed with the hours of day along the horizontal axis of the graph and the various temperatures along the vertical axis. The temperature found for each hour could then be plotted on the graph as a point and the points then connected with each other. The assumption of such a graph is that the temperature varied continuously between the observed readings and that those temperatures would fall along the continuous line drawn on the graph.
A circlegraph, or “pie chart,” can also be used to graph data. A circle graph shows how the total number of individuals, cases or events is divided up into various categories. For example, a circle graph showing the pop-ulation of female African-Americans in the United States would be divided into pie-shaped segments, one (0-19) twice as large as the next two (20-20 and 30-39), and three about equal in size and smaller than the other three.
Measures of central tendency
Both statisticians and non-statisticians talk about “averages” all the time. But the term average can have a number of different meanings. In the field of statistics, therefore, workers prefer to use the term “measure of central tendency” for the concept of an “average.” One way to understand how various measures of central ten-dency (different kinds of “average”) differ from each other is to consider a classroom consisting of only six students. A study of the six students shows that their family incomes are as follows: $20,000; $25,000; $20,000; $30,000; $27,500; $150,000. What is the “aver-age” income for the students in this classroom?
The measure of central tendency that most students learn in school is the mean. The mean for any set of numbers is found by adding all the numbers and dividing by the quantity of numbers. In this example, the mean would be equal to ($20,000 + $25,000 + $20,000 + $30,000 + $27,500 + $150,000) ⫼6 = $45,417. But how much useful information does this answer give about the six students in the classroom? The mean that has been calculated ($45,417) is greater than the household in-come of five of the six students.
Another way of calculating central tendency is known as the median. The medianvalue of a set of mea-surements is the middle value when the meamea-surements are arranged in order from least to greatest. When there are an even number of measurements, the median is half way between the middle two measurements. In the above example, the measurements can be rearranged from least to greatest: $20,000; $20,000; $25,000; $27,500; $30,000; $150,000. In this case, the middle two measurements are