NATURAL RADIONUCLIDES AND HEAVY METALS POLLUTION IN
SEAWATER AT KUALA LANGAT COASTAL AREA
(Pencemaran Radionuklid Semulajadi dan Logam Berat di dalam Air Laut di Kawasan Persisiran
Pantai Kuala Langat)
Sabarina Md Yunus*, Zaini Hamzah, Ab Khalik Hj Wood, Ahmad Saat Faculty of Applied Sciences,
Universiti Teknologi MARA, 40450 Shah Alam, Selangor, Malaysia
*Corresponding author: [email protected]
Received: 23 November 2014; Accepted: 27 June 2015
Abstract
Rapid industrial developments along the Langat river basin play an important role in contributing to the increases of pollution loading at Kuala Langat coastal area. The major pollutant sources in this area may be originating from human activities such as industrial discharge, domestic sewage, construction, agriculture and pig farming near the tributaries that affects the water quality. In addition, Langat and Semenyih rivers flow through the mining and ex-mining area, which is related to the source of natural radionuclides contamination. Heavy metals in the aquatic environment and more likely to enter the food chain. This study is focusing to the levels of radionuclides and heavy metals in seawater. The samples were collected using appropriate water
sampler, which is then acidified until pH 2 and filtered using cellulose acetate 0.45 μm. The concentration of these radionuclides and heavy metals were determined using Inductive Coupled Plasma Mass Spectrometer (ICPMS) after dilution. In general, the radionuclides and heavy metals concentrations are lower than Malaysia Marine Water Quality Standard (MMWQS) except for few locations where the concentration levels above the standards. The higher concentration of pollutant in the seawater may have a toxic effect on sensitive plants and living organisms. The results of pollution levels of these radionuclides and heavy metals were also compared with other studies.
Keywords: heavy metals, pollution, radionuclides, uranium, thorium
Abstrak
Perkembangan perindustrian yang pesat di sepanjang lembangan Sungai Langat memainkan peranan yang penting dalam menyumbang kepada peningkatan beban pencemaran di kawasan pantai Kuala Langat. Sumber pencemar utama di kawasan ini terdiri daripada aktiviti manusia seperti pelepasan industri, kumbahan domestik, pembinaan, pertanian dan penternakan babi berhampiran anak sungai yang menjejaskan kualiti air. Di samping itu, Sungai Langat dan Semenyih mengalir melalui kawasan perlombongan dan bekas lombong yang berkaitan dengan punca pencemaran radionuklid semula jadi. Logam berat dalam persekitaran akuatik lebih cenderung untuk memasuki rantai makanan. Kajian ini memberi tumpuan kepada tahap radionuklid dan logam berat dalam air laut. Sampel telah dikumpulkan menggunakan sampler air yang sesuai, yang kemudiannya diasidkan
sehingga pH 2 dan ditapis menggunakan selulosa asetat 0.45 μm. Kepekatan radionuklid dan logam berat telah ditentukan
menggunakan plasma induktif spektrometer jisim (ICPMS) selepas pencairan. Secara umum, radionuklid dan kepekatan logam berat adalah lebih rendah daripada Malaysia Standard Kualiti Air Marin (MMWQS) kecuali di beberapa lokasi di mana tahap kepekatan di atas piawaian. Kepekatan yang tinggi bahan pencemar dalam air laut yang mungkin mempunyai kesan toksik pada tanaman yang sensitif dan organisma hidup. Keputusan tahap pencemaran ini radionuklid dan logam berat juga dibandingkan dengan kajian-kajian lain.
Introduction
Water covers over 70% of the Earth’s surface and is a very important resource for people and the environment. Water pollution has been associated with drinking water, rivers, lakes and oceans all over the world. This consequently harms the natural environment and human health. Therefore, in Malaysia, water pollution has become an issue of considerable public and scientific concern in the light evidence of their toxicity to human health and biological system. The west coast of Peninsular Malaysia has always been an interesting area for scientific studies since the area is likely to receive impacts from anthropogenic sea-based and land based activities. Most industrial areas are concentrated at west coast of Peninsular Malaysia where Kuala Lumpur is located. Kuala Langat coastal area is located at south west of Kuala Lumpur, is one of the estuarine area which is the final destination of water flow of Sungai Langat and the adjoined Sungai Semenyih. This area has a special socioeconomic and environmental significance to south of Selangor in particular and to the west coast of peninsular Malaysia in general. It supports a large percentage of the population and it is also the center of economic activities encompassing urbanization, heavy and medium industries, agriculture, fisheries, aquaculture, oil and gas exploitation, transportation and communication and recreation. It is important to note that the river is also passing through a former tin mining area that can be the source of Naturally Occurring Radioactive Materials (NORM). In the past, they were often used as convenient dumping grounds for sewage, rubbish and industrial waste. All these activities may cause pollution to the coastal water area. It is noted that the estuary act as receiver of any discharge from both land-based and sea-based sources. Many of these discharges may contain hazardous substance that can be harmful to human health as well as ecosystem once the chemical enter the food chain. Generally, pollutant sources at the Kuala Langat coastal area may originated from the discharges of agricultural activities (pesticide, fertilizer and organic waste), human population (sewage and garbage), industry (heavy metals and hydrocarbon), and shipping (sewage, garbage, oil and chemicals). These pollutants have greatly affected the quality of the river, estuary and coastal area [1, 2].
Furthermore, coastal environment is subjected to contamination by NORM through various sources of inputs from point and diffuse which have been transported via river discharge and also a contribution from atmospheric deposition. The pollution entering the coastal systems will be incorporated into biota and will engage in the chemical and biological process that is occurring in the water column, sediment and biota. Literature reported study on heavy metals and NORM in Kuala Langat coastal area confirm that Pb, Cd and 226Ra in biota were detected [3, 4]. However specific sources of the contaminant were not identified. Therefore, the main objectives of this study are to estimate the concentration levels of metals (Cd, Pb, Hg, As, Zn, and Ni) and radionuclides (U and Th), in the surface waters and to provide baseline data of these metals in order to assess the extent of pollution of the Kuala Langat coastal area to anthropogenic pollution in future.
Materials and Methods Sampling sites
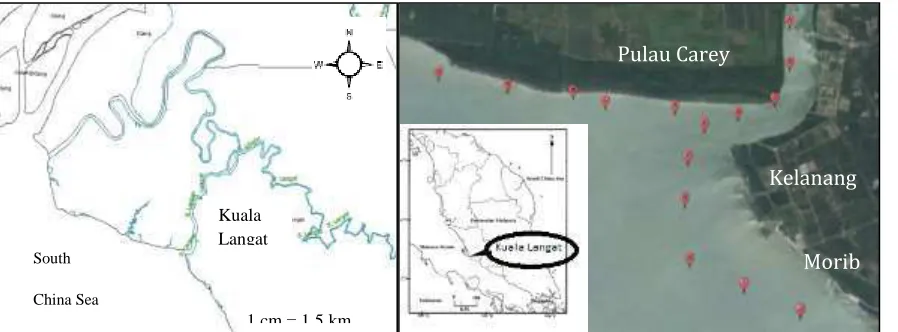
The study was carried out at Kuala Langat coastal area (Figure 1). It covers two sites of coastal water area around Carey Island, Kelanang and Morib. The coastal zone of Carey Island and Kelanang is composed of mudflat beach while Morib is generally a sandy beach. Samples collection points covering coastal water areas from the Langat River, estuary, open sea and coastal area as shown in Figure 1. It is noted that the river water flows from the upstream area in Hulu Langat to Kuala Langat at the downstream area where the Langat River becomes the main river in the basin which flows toward south-west direction and drains into the Straits of Malacca [5]. The position and elevation of each sampling points were determined by using a global positioning system (GPS). The sampling of water was carried out from15 sampling points within the study area as shown Table 1.
Sample Collection
Figure 1. Kuala Langat coastal area and sampling points (right side)
Sample and Standard Preparations
The collected samples were acidified to pH 2 with concentrated nitric acid (HNO3) in order to retard the biological activities and to ensure all chemical within the water column. Water samples were then filtered through 0.45 µm cellulose acetate membrane filters using a vacuum filtration set. This procedure was done to obtain dissolved metal while avoiding the clogging of spectrometry instrument during analysis [6]. Filtered water samples were kept at 4oC prior to analysis [7].
Diluted nitric acid was used for analytical solutions preparation and for sample dilution. All other reagents used were of analytical grade. A multi element stock standard solution containing 10 mg/L of analytes were used. Analytical standards were prepared by dilution in 1% (v/v) HNO3 in the range of 0.5 to 200 µg/L. Furthermore the blank was prepared with ultrapure water that contains 1% HNO3.
Sample Analysis
Heavy metals analysis in seawater was measured using ELAN 9000 Inductively Coupled Plasma Mass Spectrometry (ICPMS) from Perkin Elmer. Standard mixture of heavy metals and radionuclides were prepared and measured in constructing the calibration curves for each element. Results were expressed as micrograms per liter (µg/L). The LOD was estimated based on work by Shavarista et al. [8].
Results and Discussion Water Quality Parameter
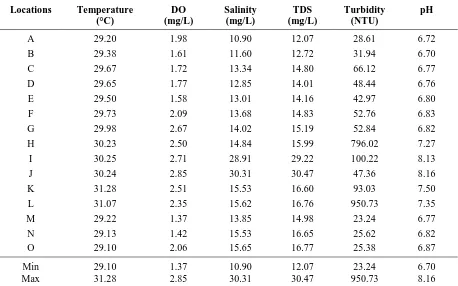
Table 1 shows the values of in situ water quality parameters measured using YSI from 15 sampling locations. The results indicate that temperatures of the surface water are ranged from 29.1 to 31.3, depending on the sampling time collections. Water temperature is one of the most important characteristics of an aquatic system. Among others, it will affect the dissolved oxygen levels in the water. While for Dissolved oxygen (DO) in this study are ranging from 1.2 to 2.8 mg/L. The lowest DO was recorded at location M, while the highest DO was observed at station J. However there is no significant variation in water DO due to temperature change, mainly due to low variability of water temperature in the tropics area. According to MMWQS, the quality of water at Kuala Langat is ranging from moderate to severely polluted since DO values in all samples is less than 4.0 mg/L. Excellent water quality has DO values more than 7 mg/L.
Pulau Carey
Kelanang
Morib
KualaLangat
1 cm = 1.5 km South
Table 1. Basic Water Quality Parameter Measured using multi probes
Locations Temperature DO Salinity TDS Turbidity pH
(°C) (mg/L) (mg/L) (mg/L) (NTU)
A 29.20 1.98 10.90 12.07 28.61 6.72
B 29.38 1.61 11.60 12.72 31.94 6.70
C 29.67 1.72 13.34 14.80 66.12 6.77
D 29.65 1.77 12.85 14.01 48.44 6.76
E 29.50 1.58 13.01 14.16 42.97 6.80
F 29.73 2.09 13.68 14.83 52.76 6.83
G 29.98 2.67 14.02 15.19 52.84 6.82
H 30.23 2.50 14.84 15.99 796.02 7.27
I 30.25 2.71 28.91 29.22 100.22 8.13
J 30.24 2.85 30.31 30.47 47.36 8.16
K 31.28 2.51 15.53 16.60 93.03 7.50
L 31.07 2.35 15.62 16.76 950.73 7.35
M 29.22 1.37 13.85 14.98 23.24 6.77
N 29.13 1.42 15.53 16.65 25.62 6.82
O 29.10 2.06 15.65 16.77 25.38 6.87
Min 29.10 1.37 10.90 12.07 23.24 6.70
Max 31.28 2.85 30.31 30.47 950.73 8.16
Turbidity is a measure of water clarity indicative of how much the suspended material in water that would decreases the passage of light through the water. Turbidity is directly related to haziness or cloudiness of the water. Turbidity in samples was range from 23.2 to 950.7 NTU. The lowest turbidity value was recorded at location O. While the highest was found at location L, where the area water appeared to be most cloudy due to high concentration of dissolved solids and suspended solid material. Silts and clay as well as organic matter from decaying plants and animals are obviously suspended solid material observed in the water column with high turbidity. The ranges of TDS were from 12.1 to 30.5 mg/L. The higher concentration of the suspended material in the water column may be due to the human activities such as recreation and agricultural activities at location H, I and J that were higher relative to Carey Island area, and suspended solid in the water.
Furthermore pH values are range from 6.7 to 8.2, seemed to be well correlated with salinity, that has range from 10.9 to 30.3 mg/L. Location I and J have higher salinity because the locations are towards the open sea. The acidity (pH) level is within acceptable international standard for surface water, and was found has no positive correlation to the metal concentration. It seems possible that these results are due to fluctuating of river flow at coastal and estuaries region that have inputs and land-based discharges. Then the fluctuation of salinity may have some effect on the rate of adsorption and desorption of metals to and from sediments. Adsorption process may have removes the heavy metal from the water column and remain attached to the sediment. However at appropriate pH or salinity desorption occurred and sends back the metal to the water column where recirculation and bio-assimilation may have taken place [2].
Concentration of Heavy Metals
Table 2. Concentration of heavy metals (µ g/L)
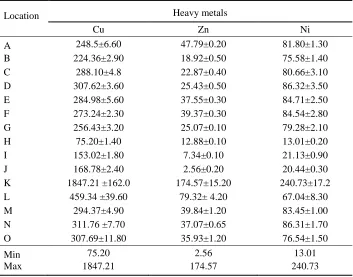
Table 2 (cont’d). Concentration of heavy metals (µ g/L)
Location Heavy metals
Cd Hg Pb As
A 0.46±0.00 0.95±0.20 2.55±0.10 58.48±0.80
B 0.13±0.06 0.77±0.20 1.62±0.10 54.52±0.40
C 0.08±0.10 0.72±0.20 9.51±0.30 69.70±0.70
D 0.26±0.10 0.67±0.20 3.42±0.10 72.48±0.70
E 0.22±0.10 0.62±0.20 2.22±0.10 65.20±1.40
F 0.40±0.05 0.44±0.20 3.46±0.10 65.93±0.70
G 0.18±0.10 0.43±0.10 1.83±0.10 66.04±1.20
H 0.04±0.10 0.08±0.10 12.22±0.30 45.65±0.80
I 0.12±0.10 0.51±0.40 2.87±0.10 61.84±0.50
J 0.07±0.01 0.58±0.50 0.29±0.04 62.89±1.50
K 40.34±10.70 217.04±41.00 630.77±124.60 768.15±65.6
L 31.8±5.90 98.11±14.60 728.02±54.30 222.06±0.61
M 0.29±0.04 0.57±0.40 3.35±0.20 67.51±2.20
N 0.20±0.02 1.08±0.20 6.97±0.20 72.30±0.30
O 0.37±0.05 1.14±0.30 9.79±0.10 73.42±1.40
Min 0.04 0.08 0.29 45.65
Max 40.34 217.04 728.02 768.15
Location Heavy metals
Cu Zn Ni
A 248.5±6.60 47.79±0.20 81.80±1.30
B 224.36±2.90 18.92±0.50 75.58±1.40
C 288.10±4.8 22.87±0.40 80.66±3.10
D 307.62±3.60 25.43±0.50 86.32±3.50
E 284.98±5.60 37.55±0.30 84.71±2.50
F 273.24±2.30 39.37±0.30 84.54±2.80
G 256.43±3.20 25.07±0.10 79.28±2.10
H 75.20±1.40 12.88±0.10 13.01±0.20
I 153.02±1.80 7.34±0.10 21.13±0.90
J 168.78±2.40 2.56±0.20 20.44±0.30
K 1847.21 ±162.0 174.57±15.20 240.73±17.2
L 459.34 ±39.60 79.32± 4.20 67.04±8.30
M 294.37±4.90 39.84±1.20 83.45±1.00
N 311.76 ±7.70 37.07±0.65 86.31±1.70
O 307.69±11.80 35.93±1.20 76.54±1.50
Min 75.20 2.56 13.01
In general the heavy metals concentration of seawater were found to decrease in the following order Cu > Ni > Zn > Pb > Hg > Cd. The concentration of Cd in the water samples ranged from 0.04 - 40.34 µg/L. The highest mean concentration of Cd was 40.34+10.70 µg/L, while the lowest mean concentration of Cd was measured at site F and H at 0.04 + 0.01 µg/L. The values of Hg and Pb were varied from 0.08 µg/L - 217.04 µg/L and 0.03 µg/L - 72.80 µg/L, respectively. The concentration of As was in the range of 45.65 – 768.15 µg/L. While, the concentration of Cu, Zn and Ni were ranging from 75.20 – 1847.21 µg/L, 2.56 – 174.57 µg/L , and 13.01 – 240.73 µg/L, respectively. In general it was found that, for all sampling points, were observed to exceed 10 µg/L of maximum concentration of As depicted in MMQWS. Of all the sampling points, the highest concentration of As was found at location K with 768.15 + 65.6 µg/L.
A recent study by [9], cover the west coast of Peninsular Malaysia from Kedah to Johor along the straits of Malacca, reported that mean concentration of As detected are lower (43.49 + 25.61 µg/L) than present study. The higher concentration of As at the study area could indicate possible contribution from industrial activities such as metal foundry activities along the river basin [5].
The results as shown in Table 2 indicate that heavy metals concentration (Cd, Hg, Pb, As, Zn, Cu and Ni) in surface water samples obtained from this study are lower than Malaysia Marine Water Quality Standards (MMWQS), except for location K and L as shown in Figure 1. Both locations show the highest concentration for all elements studied, that could be originated from the socio-economic activities from the respective land area. A number of authors have reported that concentration of heavy metals in seawater at coastal water were slightly higher than the present study [2, 9, 10-12].
Concentration of Radionuclides
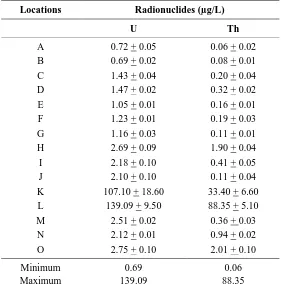
Radionuclides (uranium and thorium) concentrations determined by ICPMS in the seawater collected from 15 sampling points at Kuala Langat coastal area are shown in Table 3. Uranium and thorium concentrations in the seawater from these sampling points are relatively low except for location K and L. The uranium and thorium concentration determined varied ranging from 0.69 - to 139.09 µg/L and 0.06 - 88.35 µg/L, respectively. From the data obtained, both radionuclides uranium and thorium concentration are low in fresh water and similar trend were reported by a group of researchers [13, 14]. Seawater contained higher amount of dissolved uranium than fresh water due to salinity that will cause more dissolution of the radioactive materials into the water column. The data in Table 4 also signified the low amount of U and Th in the sea water that is in ppb level. Therefore, radionuclides (uranium and thorium) can easily found naturally in the environment in very small amount [15]. Human may cause the release of U and Th into the river water system through mining and related industrial activities. Therefore Langat River and the adjoined Semenyih River may transported suspended solid with higher U and Th content into the coastal water area thus causing elevated level of the radioactive materials in the coastal water area. Table 3 shows the highest concentration of the radionuclides was observed at the location L estuary where the distance was about 3000 - 4000 m from the Sungai Langat towards the open sea. It seems that the concentration of radionuclides is decreasing with the increasing of salinity. However in general there is no significant correlation between salinity and the radionuclides concentration as shown in Table 4.
Distribution of Heavy Metals and Radionuclides
Table 3. Concentration of radionuclides (µ g/L) Locations Radionuclides (µg/L)
U Th
A 0.72 + 0.05 0.06 + 0.02
B 0.69 + 0.02 0.08 + 0.01
C 1.43 + 0.04 0.20 + 0.04
D 1.47 + 0.02 0.32 + 0.02
E 1.05 + 0.01 0.16 + 0.01
F 1.23 + 0.01 0.19 + 0.03
G 1.16 + 0.03 0.11 + 0.01
H 2.69 + 0.09 1.90 + 0.04
I 2.18 + 0.10 0.41 + 0.05
J 2.10 + 0.10 0.11 + 0.04
K 107.10 + 18.60 33.40 + 6.60
L 139.09 + 9.50 88.35 + 5.10
M 2.51 + 0.02 0.36 + 0.03
N 2.12 + 0.01 0.94 + 0.02
O 2.75 + 0.10 2.01 + 0.10
Minimum 0.69 0.06
Maximum 139.09 88.35
Table 4. Pearson correlation analysis, between pH and salinity with heavy metals and radionuclides
pH Salinity Cd Hg Pb As Cu Zn Ni U Th
pH 1
Salinity 0.9216 1
Cd 0.4191 0.3168 1
Hg 0.3284 0.1719 0.6488 1
Pb 0.171 0.2300 0.1173 0.0157 1
As 0.2487 0.0368 0.3217 0.5761 0.2723 1
Cu 0.6837 0.5015 0.4052 0.6592 0.1997 0.8476 1
Zn 0.7748 0.7124 0.6646 0.4747 0.0247 0.3796 0.7198 1
Ni 0.876 0.7516 0.4919 0.5367 0.1394 0.6026 0.9261 0.8137 1
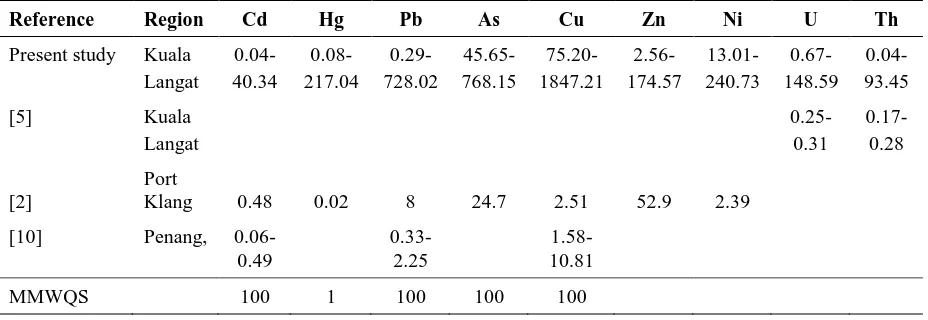
Table 5. Comparison of mean concentration of heavy metals and radionuclides obtained with marine water found comparable to the reported data in literature, except in water sample from certain locations of the study area especially near the mouth of the river, which are higher than the set marine water quality standard. The data signified that the anthropogenic activities upstream of the river system do cause some impact on the water quality that needs attention from the relevant authority. The pollutants may cause negative impact to the productive estuarine ecosystem and may cause negative health impact to human once enter the food chain.
Acknowledgement
The authors would like to thank Research Management Institute of Universiti Teknologi MARA for FRGS grant (600-RMI/FRGS5/3 (118/2012) and Environmental Studies using Conventional and Nuclear Method (ESCAN) members for their help, support and cooperation in this research works. We also acknowledge everyone who is involving directly or indirectly into this project.
References
1. Adnan, N. H., Zakaria, M. P., Juahir, H., and Ali, M. M. (2012). Faecal sterols as sewage markers in the Langat River, Malaysia: Integration of biomarker and multivariate statistical approaches. Journal of Environmental Sciences 24(9), 1600–1608.
2. Sany, S. B. T., Salleh, A., Sulaiman, A. H., Sasekumar, A., Rezayi, M., and Tehrani, G. M. (2012). Heavy metal contamination in water and sediment of the Port Klang coastal area, Selangor, Malaysia. Environmental Earth Sciences 69(6), 2013–2025.
3. Othman, M. S., and Gasim, M. B. (2005). Kepekatan Logam Berat dalam Air di Lembangan Sungai Semenyih , Selangor, Sains Malaysiana 34(2), 49–54.
4. Mohamed, C.A.R, Theng, T. L. and Ahmad, Z. (2006). Po and 210 Pb in Cockle Tissues in West Coast of Peninsula Malaysia. Journal of Nuclear and Related Technologies 3(1), 69–75
5. Hamzah, Z., Rosli, T. N. T. M., Saat, A., and Wood, A. K. (2014). An assessment of natural radionuclides in water of Langat River estuary, Selangor. AIP Conference Proceedings 228, 228–234.
6. Lim, W. Y., Aris, A. Z., and Zakaria, M. P. (2012). Spatial variability of metals in surface water and sediment in the langat river and geochemical factors that influence their water-sediment interactions. The Scientific World Journal 2012: 1-14.
7. APHA. (2005). Standard Methods for the Examination of Water and Wastewater (21st ed.). American Water Works Association, Water Environment Federation, Washington, DC, USA.
9. Looi, L. J., Aris, A. Z., Wan Johari, W. L., Md Yusoff, F., and Hashim, Z. (2013). Baseline metals pollution profile of tropical estuaries and coastal waters of the Straits of Malacca. Marine Pollution Bulletin, 74(1), 471– 6.
10. Idriss, A. (2012). Concentration of selected heavy metals in water of the Juru River, Penang, Malaysia. African Journal of Biotechnology 11(33), 8234–8240.
11. Wang, J., Liu, R. H., Yu, P., Tang, a. K., Xu, L. Q., & Wang, J. Y. (2012a). Study on the Pollution Characteristics of Heavy Metals in Seawater of Jinzhou Bay. Procedia Environmental Sciences 13, 1507–1516. 12. Yılmaz, S. and Sadikoglu, M. (2011). Study of heavy metal pollution in seawater of Kepez harbor of Canakkale
(Turkey). Environmental Monitoring and Assessment 173(1-4), 899–904.
13. Wang, R. and You, C. (2013). Uranium and strontium isotopic evidence for strong submarine groundwater discharge in an estuary of a mountainous island : A case study in the Gaoping River Estuary, Southwestern Taiwan. Marine Chemistry 157, 106–116.
14. Swarzenski, P. W. and Baskaran, M. (2007). Uranium distribution in the coastal waters and pore waters of Tampa Bay, Florida, 104, 43–57.