The tuber extract and fl our of
Dioscorea alata
normalize the blood lipid
profi le of rabbits treated with high cholesterol diets
Nelis Imanningsih,
1Deddy Muchtadi,
2Nurheni S. Palupi,
2Tutik Wresdiyati,
3Komari
11 National Institute of Health Research and Development, Ministry of Health, Jakarta, Indonesia 2 Department of Food Science and Technology. Bogor Agricultural Institute, Bogor, Indonesia 3 Department of Veterinary Science. Bogor Agricultural Institute, Bogor, Indonesia
Corresponding author: Nelis Imanningsih E-mail: [email protected]
Received: November 5, 2013; Revised: May 12, 2014; Accepted May 14, 2014
Abstrak
Latar belakang: Umbi Dioscorea alata (DA) memiliki potensi untuk mencegah kondisi hiperlipidemia karena mengandung senyawa bioaktif antosianin, serat pangan, dan diosgenin yang bermanfaat dalam menormalkan kadar lipida darah. Pada penelitian ini dipelajari pengaruh pemberian ekstrak air dan tepung umbi DA dalam menormalkan profi l lipida darah kelinci yang diberi ransum tinggi kolesterol.
Metode: Ekstrak dan tepung umbi DA diberikan kepada kelinci percobaan selama 60 hari dengan disain penelitian rancangan acak lengkap. Perlakuan ransum sebagai berikut: 1) Ransum basal sebagai kontrol negatif (K0), 2) Ransum basal + kolesterol 0.5% sebagai kontrol positif (K1), 3) Ransum basal+kolesterol 0.5% + ekstrak DA 1.8 g/100 g (KE1), 4) Ransum basal+kolesterol 0.5%+ekstrak DA 3.6 g/100 g (KE2), 5) Ransum basal mengandung 15% tepung DA + kolesterol 0.5% (KT1) dan 6) Ransum basal mengandung 30% tepung DA + kolesterol 0.5% (KT2). Kadar total kolesterol, LDL, HDL kolesterol dan trigliserida pada serum dianalisa pada awal, hari ke 28, hari ke 56 dan pada akhir penelitian.
Hasil: Pemberian ransum tinggi kolesterol sebanyak 1% meningkatkan kadar kolesterol darah sebesar 16 kali dibandingkan kontrol. Pemberian 15% dan 30% tepung DA ransum tinggi kolesterol dapat mempertahakankan profi l lipida darah kelinci ke arah normal, khususnya pada substitusi 30% tepung DA. Akan tetapi, ekstrak air tepung DA tidak dapat mempertahankan kadar lipida normal kelinci yang diberi ransum tinggi kolesterol.
Kesimpulan: Tepung DA memiliki efek anti-hiperlipidemia. (Health Science Indones 2014;1:23-9)
Kata kunci: ekstrak, tepung, Dioscorea alata, hiperlipidemia
Abstract
Background:Dioscorea alata (DA) tuber has potential to prevent the condition of hyperlipidemia due to the bioactive compound, such as anthocyanins, diosgenin, and dietary fi ber that benefi cial in normalizing blood lipid profi les. In this research, the effect of water extract and fl our of DA tuber administration was examined on rabbits treated with high cholesterol diets.
Methods: DA tuber extract and fl our were administrated to the rabbits for 60 days using completely randomised design. The ration treatment are as follows: 1) Basal ration as negative control (K0), 2) Basal ration + 0.5% cholesterol, as positive control (K1), 3) Basal ration + 0.5% cholesterol + DA extract 1.8 g/100 g (KE1), 4) Basal ration + cholesterol 0.5% + DA extract 3.6 g/100 g (KE2), 5) Basal ration with 15% DA fl our + 0.5% cholesterol (KT1) and 6) Basal ration with 30% DA fl our + 0.5% cholesterol (KT2). The Total cholesterol, HDL, LDL cholesterol in serum were analysed at baseline, days 28, days 56 and at the end of study.
Results: The administration of high cholesterol (1%) ration increased blood lipid levels by 16 fold compared to that of control. The administration of 15% and 30% of DA fl our could maintain blood lipid profi le to normal condition, in particular at 30% substitution DA fl our. However the water extract of DA can not maintain a normal blood lipids of high cholesterol treated rabbits
Conclusion: Dioscorea alata fl our has suggested to have anti-hyperlipidemia effect. (Health Science Indones 2014;1:23-9)
Hyperlipidemia is one risk factor for atheroclerosis.1
Epidemiology and experimental researches showed that food containing high cholesterol is highly related with hyperlipidemia condition. High lipid level, par-ticularly Low Density Lipoprotein-Cholesterol (LDL-Cholesterol) showed significant relationship with the development of atherosclerotic plaque.2 Many
researches related to atherosclerosis were conducted to see the effect of bioactive compounds in normalizing hyperlipidemia and preventing the oxidation of blood lipid cholesterol. Currently, natural materials become a topic of interest of research as a potential substance producing biologically active component such as antioxidant, anti-hyperlipidemia or as anti-infl ammatory substances. Tuber of Dioscorea alata (DA) has the potential to reduce the risk of cardiovascular disease with functional compounds.
The functional components of this tuber are antho-cyanins, dietary fi ber and diosgenin. Anthocyanins belongs to the polyphenolic compound which has anti-oxi dant capacity by scavenging free radicals.3 Current
research indicates that anthocyanins have physiological advantages as an antioxidant, anti-infl am matory, blood vessel relaxation, and as sta bilizing compounds of capillaries.4 Anthocyanin could also improve blood
lipid profi le by increasing High Density Lipoprotein (HDL) and lowering Low Density Lipoprotein (LDL) plasma. 5 Musilases are compound in DA tuber that
contain complex carbo hydrates and protein. The carbohydrate are mainly a dietary fi ber consisting of hexose and pentose monomers. Musilases could regulate lipid metabolism with anti-hyperlipidemia effect.6 Diosgenin is a plant steroid that has
anti-hyperlipi demia effect by suppressing cholesterol absorp tion and increased secretion of cholesterol in bile acid, 7 therefore increased fecal cholesterol excretion.8.9
With the potency, it is expected that supplementation of DA extract or fl our could normalized the blood lipid profi le of rabbits. This reserach is aimed to determine the efect of suplementation of DA extract and fl our on blood lipid profi le of rabbits fed with high cholesterol diet.
METHODS
Material and equipment
The material used in this study are: DA tuber fl our, aquadest, male New Zealand White rabbits 5 months old, that obtained from the Indonesian Research Institute for Animal Production in Ciawi, Bogor. Rabbit basal ration and experimental ration, made in
Indofeed livestock feed in Bogor. Pure cholesterol, reagent for cholesterol, LDL, HDL and triglicerides analysis (Fluitest-Chol kit) were obtained from Sigma
and Analyticon Biotechologies. The equipment are shakers, centrifuge, freeze drier, spectrophotometer, a set of rabbits growing equipment, and blood taking equipments,
The production of ration
Rations was formulated base on nutritional need for normal growth of adult rabbits.10 Material having
polyphenolic compound other than DA tuber did not included in the ration component. Ration composition calculation were performed using the WUFFDA (Windows-Based User Friendly Feed Formulation Workbook) Version 3 to obtain isocaloric and isoprotein rations. 11
0.5 g of pure cholesterol was mixed with 19.5 g of basal ration, to produce a small ration of 20 g. The rabbits in cholesterol groups (KE1, KE2, KT1 and KT2), were fed with the small ration containing cholesterol in advance, and after the small ration was consumed, 80 g of basal ration was added. Therefore total cholesterol given is 0.5 g in 100 g of basal ration/ day or 0.5% in the diet.
DA dried extract of maltodextrin, contained 25 g of anthocyanins per 100 g, whereas DA fl our contained 1.4 g of anthocyanins per 100 g, or there was as much as 0.23 anthocyanins/15 g DA fl our or 0.45 g anthocyanin/ 30 g DA fl our. To get an equivalent amount of anthocyanin presented in 15 and 30 g DA fl our, 0.9 and 1.8 g of maltodextrin extract were weight. This maltodextrin extracts was mixed with cholesterol ration, and this mixture was added by basal ration until the total weight is 20 g. This ration is given to the KE1 and KE2 group to be eaten in advance, then 80 of basal ration is added. Therefore the total ration given to these groups was 0.5 g of cholesterol plus 1.8 or 3.6 g anthocyanins extract in 100 basal ration/day.
In vivo experiment in rabbits
In vivo experiment was conducted using 5
months-male of New Zealand white rabbits with initial weight approximately 2.7 kg in each. The number of rabbits in each group was calculated based on the mean difference formula. 13 To meet sampling
size, the number of rabbits required in each group should be fi ve. Rabbits were weighed and grouped according the type of ration as follow.
K1 = Control negative, Basal Ration
K2 = Control positive cholesterol, Basal Ration + 0.5% cholesterol
KE1 = Basal Ration + anthocyanins extract equal to 15 g DA fl our (1.8 g) + 0.5% cholesterol KE2 = Basal Ration + anthocyanins extract equal to
30 g DA fl our (3.6 g) + 0.5% cholesterol KT1 = Basal Ration contain 15% DA fl our + 0.5%
cholesterol
KT2 = Basal Ration contain 30% DA fl our + 0.5% cholesterol
The rabbits were adapted to the maintenance environ-ment for 1 month. In adaptation phase, the standard ration was substituted gradually from 0% to 100% treatment ration. After one month, the rabbits were ready to eat treatment ration. During the study, the measurements of observed variable was carried out regularly. Rabbits was weight once a week, ration consumption was weighed and calculated everyday, blood lipids (total kolesterol, LDL, HDL, dan trigliserida) were measured at baseline, day 28, 56 and at the end of study.
Blood was taken from vein at the ears using butterfl y sterile syringe. To obtain serum, blood was centrifuged at 100 g for 15 min at 40C. Triacylglicerol (TG), total
cholesterol (TC), low density lipoprotein cholesterol (LDL-cholesterol), high-density lipoprotein choles terol (HDL-cholesterol), were analyzed using commercial kits (Fluitest® Chol, HDL-Chol, LDL-Chol dan Triacyglicerol, Analyticon Biotechnologies).
The study design was a completely randomised design with fi ve replications. Data were analyzed using analysis of variant (ANOVA) and Least signifi cant different (LSD) analysis to determine the difference between treatments. The value was sugested to be signifi cantly different if the P value is smaller than 0.05. All data presented ini the form of mean ± standard deviation, The ethical approval was obtained from the Research Ethics Board of National Institute of Health Research and Development, Ministry of Health of Indonesia.
RESULTS
The compositions of rabbit ration are listed in Tabel 4.1. The macro nutrient of each ingredient is analysed, and the values are used as the basis for formulation (Tabel 4.2). The purpose of the formulation is to obtain rations that contain uniform number of calories, protein, fat and crude fi ber, and comply with the required nutrient for normal growth of rabbits. According to Lebas (1997), nutrition requirements for a rabbit are 350-370 kcal/100 g of energy, 3-5 % of fat, and 15-18 % of protein, whereas the need of fi ber was 10-14 %.
Rations are formulated to contain 0 %, 15 % and 30 % of DA fl our. Formulations should meet nutritional and fi ber needs for normal growth of rabbits. Protein, fat and fi ber are ranged from 16.01-16.34 %, 3.2-4.92 %, and 10.51–11.84 %, while the energy is ranged between 360-366 kcal/100 g ration. With this composition, ration has meet the nutritional needs of a normal growth of adult rabbits. From the analysis, it can be seen that the content of protein, fat, crude fi ber in the ration of all experimantal groups are equivalent. However, the dietary fi ber content of the basal ration, DA-15 ration and DA-30 were different. Rabbits in each treatment group consumed the same amount of ration (P = 0.3818, α = 0.05). The Number of ration consumed in 60 days was between 5106.9 - 5826.2 g or 83.72 -95.51 g / day. With a number of these rations, protein and calorie intake for each group ranged between 817.61 - 939.04 g or 13:40 to 15:39 g / day, and between 18.691 to 21.324 kcal or 306-349 kcal / day. The amount of energy and protein consumed by rabbits is an important factor to ensure that the difference in the parameters is caused by differences in treatment, and not due to differences in the amount of feed intake.
The differences in ration composition did not cause a signifi cant different in weight of rabbits between groups, because the content of macro nutrient in each group was equal. Initial weight of rabbits were varied between 2255.7 - 2457.0 g (not signifi cantly different, P= 0.9961, α=0.05), and the fi nal weight were between 2987.0 - 3339.8 g. The weight gain is about 800 g/individual rabbit in 60 days, or about 90 g/individu/week.
day. Analysis of variance showed that there was no signifi cant difference in the amount of cholesterol consumed (P = 0.2622, α = 0.05 level). The intake of anthocyanin extract between groups KE1 (extract 15) and KT1 (fl our 15) or between groups extract and fl our KE2 and KT2 is designed the same. To extract the DA 15 and DA 15 fl our, the average intake 0.24 and 0.19 g / day, and to extract DA-30 and DA-30 starch intake the average was 0.45 and 0.40 g / day.
During the research, there were four times of blood lipids measurements. At the baseline, all of blood lipid parameters were in normal condition, where total cholesterol is between 54.03 - 89.88 mg / dL, HDL is between 29.65 - 41.43 mg / dL, LDL is between 43.03 - 60.05 mg / dL, and triglycerides is between 40.35 - 67.63 mg / dL. With this range, the difference in blood lipid components at baseline was not signifi cant (p = 0.5740, α = 0.05).
Table 1. The changing of blood total cholesterol level
Groups
Total cholesterol level (mg/dL)
Baseline Day-28 Day-56 End
Mean SD Mean SD Mean SD Mean SD
K0 73.53 ± 22.93 65.83 ± 21.13 c 56.35 ± 28.65 b 54.00 ± 6.35 c
K1 89.88 ± 41.66 1443.00 ± 446.84 a 2140.50 ± 904.97 a 1987.20 ± 770.66 a
KE1 70.45 ± 28.18 1424.50 ± 375.42 a 2152.00 ± 1133.90 a 1572.80 ± 218.21 ab
KE2 68.25 ± 21.21 1410.30 ± 320.30 a 2081.80 ± 701.98 a 2000.00 ± 920.13 a
KT1 54.03 ± 13.84 537.65 ± 304.08 b 680.35 ± 228.12 b 645.40 ± 228.94 bc
KT2 68.25 ± 19.13 250.55 ± 110.81 bc 438.80 ± 150.09 b 314.15 ± 150.71 c
*The value followed by different letter in the same coloumn indicated a signifi cant difference (P ≤ 0.05)
Table 2. The changing of blood LDL cholesterol level
Groups
LDL cholesterol level (mg/dL)
Baseline Day-28 Day-56 End
Mean SD Mean SD Mean SD Mean SD
K0 47.55 ± 12.45 51.45 ± 14.52 c 48.50 ± 24.13 b 42.03 ± 7.81 b
K1 60.05 ± 23.31 1409.30 ± 185.54 a 978.50 ± 182.24 a 514.48 ± 230.31 a
KE1 43.18 ± 9.66 808.25 ± 720.77 b 974.50 ± 164.53 a 625.73 ± 346.88 a
KE2 43.03 ± 5.38 1348.00 ± 151.51 a 872.25 ± 339.61 a 761.27 ± 171.01 a
KT1 48.98 ± 17.39 208.77 ± 56.91 c 149.82 ± 12.20 b 207.05 ± 65.97 b
KT2 45.90 ± 17.32 157.10 ± 21.65 c 153.95 ± 17.91 b 109.58 ± 44.28 b
*The value followed by different letter in the same coloumn indicated a signifi cant difference (p ≤ 0.05)
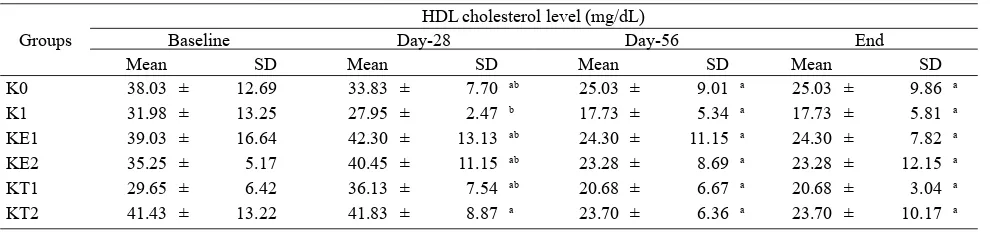
Table 3. The changing of blood HDL cholesterol level
Groups
HDL cholesterol level (mg/dL)
Baseline Day-28 Day-56 End
Mean SD Mean SD Mean SD Mean SD
K0 38.03 ± 12.69 33.83 ± 7.70 ab 25.03 ± 9.01 a 25.03 ± 9.86 a
K1 31.98 ± 13.25 27.95 ± 2.47 b 17.73 ± 5.34 a 17.73 ± 5.81 a
KE1 39.03 ± 16.64 42.30 ± 13.13 ab 24.30 ± 11.15 a 24.30 ± 7.82 a
KE2 35.25 ± 5.17 40.45 ± 11.15 ab 23.28 ± 8.69 a 23.28 ± 12.15 a
KT1 29.65 ± 6.42 36.13 ± 7.54 ab 20.68 ± 6.67 a 20.68 ± 3.04 a
KT2 41.43 ± 13.22 41.83 ± 8.87 a 23.70 ± 6.36 a 23.70 ± 10.17 a
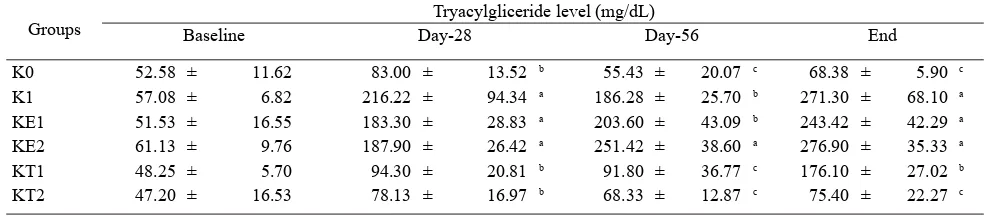
Table 4. The changing of blood tryacylgliceride level
Groups
Tryacylgliceride level (mg/dL)
Baseline Day-28 Day-56 End
K0 52.58 ± 11.62 83.00 ± 13.52 b 55.43 ± 20.07 c 68.38 ± 5.90 c
K1 57.08 ± 6.82 216.22 ± 94.34 a 186.28 ± 25.70 b 271.30 ± 68.10 a
KE1 51.53 ± 16.55 183.30 ± 28.83 a 203.60 ± 43.09 b 243.42 ± 42.29 a
KE2 61.13 ± 9.76 187.90 ± 26.42 a 251.42 ± 38.60 a 276.90 ± 35.33 a
KT1 48.25 ± 5.70 94.30 ± 20.81 b 91.80 ± 36.77 c 176.10 ± 27.02 b
KT2 47.20 ± 16.53 78.13 ± 16.97 b 68.33 ± 12.87 c 75.40 ± 22.27 c
*The value followed by different letter in the same coloumn indicated a signifi cant difference (P ≤ 0.05)
DISCUSSION
Administration of cholesterol in rabbits led to a noticeable increase in total cholesterol, LDL-cholesterol, and triacylglycerol. These results are consistent with previous studies,14, 15, 16 which found that the lipid foods
correlates with blood lipid profi le of rabbits. Rabbits in particular, are very sensitive to dietary cholesterol, a normal rabbit will synthesize and secrete about 100 mg of cholesterol per day and maintain blood cholesterol concentrations at a maximum of 100 mg / dl, but the provision of cholesterol in the diet, will increase in the extreme concentration of cholesterol in the blood rabbit.10 Total cholesterol, LDL cholesterol
and blood triacylglycerol in rabbits fed a high cholesterol diet (K1) showed a very high increase. On the measurement at day 28, it is known that the level of total cholesterol increased by 16-fold, and total and LDL cholesterol increased by 20-fold from the initial conditions (Table 1 and 2). These conditions could happen, because rabbits are herbivores that are very sensitive to dietary cholesterol, however the animal is not able to degrade or secrete cholesterol in the form of bile acids in suffi cient quantities, to balance with what has been absorbed, so that the severe hyperlipidemia condition was occurred (Weisbroth 1974).17 The
conditions of high levels cholesterol, LDL cholesterol and triacylglycerol is continuously increase until the 56th day of measurement, and a there was a slight decrease in the measurement at day 60.
The administration of cholesterol ration does not cause a signifi cant differences in HDL-cholesterol levels between treatment groups (Table 4.6.). HDL has a function to bring the non-esterifi ed cholesterol from the cells and from other accumulated lipoproteins, to the liver for bile acids secretion. 2 Low levels of
HDL-cholesterol indicates a low HDL-cholesterol carried to the
liver to balance what has been absorbed. Therefore, the levels of cholesterol in the blood is very high. The administration of water extract of DA (KE1 and KE2) to rabbits fed with high cholesterol diet can not maintain blood lipid profi le in normal conditions. Levels of total cholesterol, LDL-cholesterol, and blood triacylgliceride of rabbits in these group are closer to K1 cholesterol group (p = 0.000, α = 0.05 level). Water extract of DA tubers can not normalize blood lipid profi les of rabbits. Water extract of DA tubers contained anthocyanins which have the effect of lowering cholesterol absorption by modulating the withdrawal of cholesterol from the body to the liver, and secreted into bile acid form, through the activation of receptors that regulate the withdrawal.
18 However, this modulation effect is not shown by
giving 0.23 g and 0:45 g anthocyanin extract per day. This may be due, the unsuffi cient dose which can lead the modulation effect.
Substitution 15 and 30% DA fl our (KT-1 and KT-2) into ration, can maintain total blood cholesterol of rabbits to normal, especially in rabbits fed with 30% DA fl our substitution. Rabbit blood cholesterol levels in both groups were not signifi cantly different from those of normal control group (K0). Substitution of DA fl our into rations not only provide anthocyanin compounds, but also dietary fi ber, such as cellulose, lignin, hemicellulose and pectin. 19 The results of the
increases the excretion of bile acids. Soluble fi ber lowers plasma cholesterol through its ability to bind bile acids in the gastrointestinal tract. Because soluble fi ber binds bile acids, the formation of micelles become distracted and reabsorption of bile acids also decrease. This case will increase the excretion of the dietary fi berbile acid complex in the feces. Since the bile acids decreased, the replacement is carry out in two ways. Firstly, with taking more cholesterol from the liver and using it for the synthesis of bile acids, and not circulated to the body as VLDL ( very low density lipoprotein). Secondly, the need of hepatic cholesterol will improve the regulation, synthesis, and LDL receptor activity, causing VLDL and LDL remnant are taken from the circulation in the body. The overall effect of these changes is a reduction in levels of LDL and total cholesterol serum.20 In
addition, the avaibility of dietary fi ber also causes changes in the activity of LDL receptors. A study showed that the experimental animals fed with a high-fat diet, showed a low LDL receptor activity. However, if the high-fat diet and high cholesterol are given simultaneously with soluble fi ber, thereforen the LDL receptor function will revert to normal.21
Another thing that is expected to play a role in lowering cholesterol is the diosgenin content in DA fl our which belong to stereoidal saponin grup. A study reported that plant saponins are proven to prevent the absorption of cholesterol in the lumen of the small intestine of animal models, therefore can decrease the concentration of plasma cholesterol.22
Diosgenin also been shown to increase the excretion of cholesterol through feces and increase the secretion of cholesterol through bile acid. 8 Plant sterols and
steroids have the hipocholesterolemia effect by inhibiting the absorption of dietary cholesterol and endogenous cholesterol. The existence of sterols and steroids from food will compete with cholesterol for micellar solubility, thus lowering the amount of cholesterol that is absorbed by the intestinal mucosal cells.23
CONCLUSION
The supplementation of DA fl our DA by 15% and 30% maintain the blood lipid profi le of rabbits towards normal conditions, in particular at 30% substitution DA fl our. However the water extract of DA can not maintain a normal blood lipids of high cholesterol treated rabbits.
Acknowledgments
The author would like to thank National Institute of Health Research and Development for funding this study, and to Prof. Bastaman Basuki for technical assistance in preparing this manuscript.
REFERENCES
1. American Heart Association. Atherosclerosis. American Heart Association [Internet]. 2008. [cited 2009 November 12]. Available from http: //www.american heart.org/ presenter. jhtml?identifi er=228.html.
2. Gropper SG. Advance nutrition and human metabolism. Australia: Thomson Wadsworth. 2005.
3. Mazza G. Anthocyanins and heart health. Ann Super Sanità. 2007; 43:369-74.
4. Hasselund SS, Kjedsen SE, Seljefl ot I, et al. The effects of anthocyanins on cardiovascular risk factors and infl ammation in pre-hypertensive men: a double-blind randomized placebo-controlled crossover study. J Hum Hypertens. 2012; 27:100-6.
5. Qin Y, Xia M, Ma J, et al. Anthocyanin supplementation improves serum LDL- and HDL-cholesterol concen-trations associated with the inhibition of cholesterol ester transfer protein in dyslipidemic subjects. Am J Clin Nutr. 2009;90:485-92.
6. Chen HL, Wang CH, Chang CT, et al. Effect of Taiwanese yam (Dioscorea japonica thunb. var. Pseudojaponica
yamamoto) on upper gut function and lipid metabolism
in Balb/c mice. Nutrition. 2003;19:646–51.
7. Thewles A, Parslow RA, Colemen R. Effect of Diosgenin on biliary cholesterol transport in the rat. Biochem J. 1993;291:793-8.
8. Temel RE, Brown JM, Ma, et al. Diosgenin stimulation of fecal cholesterol excretion in mice is not NPC1L1 dependent. J Lipid Res. 2009;50:915-23.
9. Son IS., Kim JH, Sohn HY, et al. Antioxidative and hypolipidemic effects of diosgenin, a steroidal saponin of am (Dioscorea spp.), on high-cholesterol fed rats. Biosci Biotechnol Biochem. 2007;71:3063–71. 10. Lebas F, Coudert P, Rochambeau HD, et al. The
rabbit husbandry, health and production. FAO Animal Production and Health Series. 1997.
11. Thompson E. Windows-based user-friendly feed for-mulation workbook. Armidale. Univ of New England. 2009.
12. Horwittz W, Latimer G, editors. Offi cial methods of analysis of AOAC International. 18th ed. Maryland (US): AOAC International. 2007.
13. Levy PS, Lemeslow S. Sampling of population methods and application. 3rd edition. New York; A Wiley-Interscience Publication John Wiley & Sons Inc. 1999. 14. Prasad K. Hypocholesterolemic and antiatherosclerotic
15. Purohit A, Vyas KB. Antiatherosclerotic effect of capparis decidua fruit extract in cholesterol-fed rabbits. Pharmaceutical Biol. 2006;44:172-7.
16. Jain GC, Jhalani S, Agarwal S, et al. Hypolipidemic and antiatherosclerotic effect of Leptadenia pyrotechnica extract in cholesterol fed rabbits. Asian J Exp Sci. 2007;21:115-22.
17. Weisbroth SH, Flatt RE, Kraus AL. The biology of the laboratory rabbit. New York. Academic Press. 1974. 18. Xia X, Ling W, Ma J, et al. An anthocyanin-rich
extract from black rice enhances atherosclerotic plaque stabilization in apolipoprotein e–defi cient mice. J Nutr. 2006;136: 2220-5.
19. Baah FD, Maziya-Dixon B, Asiedu R, et al. Nutritional and biochemical composition of Dioscorea alata (Dios-corea spp) tubers. J Food Agri Environ. 2009;7:373 -8. 20. Anderson JW, Hanna TJ. Impact of non digestable
carbohydrate on serum lipoprotein and risk of cardio-vascular disease. J Nutr. 1999;129:1457S-1466S. 21. Yuan YV. Dietary lipids and in vivo antioxidant status
in atherosclerosis resistant and sensitive animals [disser-tation]. Columbia. University of British Columbia; 1995. 22. Matsuura. Saponin in garlic as modifi er of the risk of