RSO@9/9/2012
Probabilistic and Statistics
Week 10
Hypothesis Testing on Two Samples
UMN Lecturer Team
Objectives
• Last week, we have studied about hypothesis testing on a mean at a particular value
Why we need more than two samples
• The experiment is made on two different samples:
– An engineer wants to test the aluminum quality under two different temperatures.
– An UMN student wants to test the system information implementation results between two different groups of users: Marketing and Finance
Independent samples
Two samples are independent when they are taken from two different population where there is no way for the first sample related to the other sample.
Example:
• A student wants to test the quality of two light bulbs from two brands
two samples from different populations to find the differences between two population
• A student takes a group of Papua students and a group of Java students and test whether they have a same consumption behavior two samples from different population
When we know that
our samples are different from each other?
• The differences between two samples are shown on the differences on their means
• Both samples must normally distributed
• Both sample sizes are minimum 30
• Doesn’t matter with their population shape
Central limit theorem
Example
• We want to test whether the salary of advertising managers are different from the salary of auditing managers
• Here is the data we have:
Steps of making Hypotheses
• Hypothesize
• Choose a proper statistic test
• Step-3 Specify the value of
• making decision region
• gather sample data
• analysis the sample data
• Statistical Conclusion
Step-1
• Hypothesize:
– When we don’t care about how far the differences between them use Ho: µ1=µ2 H1: µ1≠µ2
– When we want to know how far the differences between them use Ho: µ1-µ2= H1: µ1 - µ2 ≠
• Let’s make it one by one:
• Ho: µ1=µ2
• H1: µ1≠µ2
STEP-2: Choose a proper statistic test
z distribution is used when
• data is normally distributed
• is known
• Sample statistic = 𝒙
t distribution is used when
• data is normally distributed
• is unknown
• Sample statistic = 𝒙 Differences between population means
Step-3 Specify the value of
Step 4: making decision region
• Because it is a two tailed test, we use /2= 0.025 z=1.96
• Decision region:
– Rejection region Z<-1.96 or Z>1.96
– Non Rejection region -1.96 ≤ Z ≤1.96
Step 5: gather sample data
Step 6: analysis the sample data
• Compute the statistic test
We assume µ1=µ2
Step 7: Statistical Conclusion
• Rejection region Z<-1.96 or Z>1.96
• z=2.35
• z>1.96
• z is in rejection region
• null hypothesis is rejected
• Ha is accepted
Step 8: Making business decision
• 𝑥 = $70.7001 (for advertising managers) and
𝑥 = $62.187 (for auditing managers)2
• It’s true that the salary of advertising managers are different from the salary of auditing managers
• Because of 𝑥 > 𝑥1 2 it can be concluded that
• Advertising managers’ salary is bigger than
auditing managers′
Confidence interval to estimate µ1-µ2
How big is the difference?
Example
Answer
• For CI=98% α =2% P(-z1<Z<z1)=98%
Self Study
Homework
• For Monday class:
– Do 10.4 for NIM ended with even number
– Do 10.5 for NIM ended with odd number
• For Thursday class:
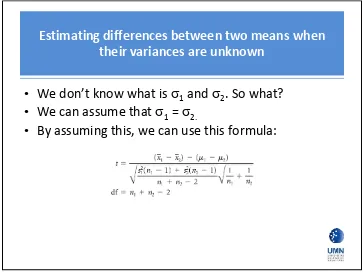
Estimating differences between two means when their variances are unknown
• We don’t know what is 1 and 2. So what?
• We can assume that 1 = 2.
• By assuming this, we can use this formula:
Example
Sebuah perusahaan menyelenggarakan training. Training diselenggarakan dalam 2 metode yang berbeda: metode A dan metode B.
Manager HRD ingin mengetahui apakah ada perbedaan yang signifikan antara kedua metode ini.
Step-1
• Hypothesize:
STEP-2: Choose a proper statistic test
z distribution is used when
• data is normally distributed
• is known
• Sample statistic = 𝒙
t distribution is used when
• data is normally distributed
• is unknown
• Sample statistic = 𝒙 Differences between population means
Step-3 Specify the value of
Step 4: making decision region
• Because it is a two tailed test, we use /2= 0.025 df=n1+n2-2=15+12-2=25
• t0.025,25 = ±2.060
• Decision region:
– Rejection region t<-2.060 or t>2.060 – Non Rejection region -2.060 ≤t≤2.060
Step 5: gather sample data
Step 6: analysis the sample data
• Compute the statistic test
We assume µ1=µ2
Step 7: Statistical Conclusion
• Rejection region t<-2.060 or t>2.060
• t=-5.20
• t<-2.06
• t is in rejection region
• null hypothesis is rejected
Step 8: Making business decision
• Significantly µ1≠µ2
• 𝑥 = 47.731 (method A) and 𝑥 = 56.5 (method B)2 • Because of 𝑥 < 𝑥1 2 it can be concluded that
• Method B is more effective than method A
How big is the difference?
• When both data is normally distributed
• Both are unknown
• 1 = 2
Example
• For the previous problems, we can estimate the CI:
47.73 − 56.50 − −5.20 19.495 15 − 1 + 18.273 12 − 115 + 12 − 2 15 +1 121 ≤ 𝜇1− 𝜇2
≤ 47.73 − 56.50 + (−5.20) (19.495)(15 − 1) + (18.273)(12 − 1)15 + 12 − 2
Homework
• For Monday class:
– Do 10.15 for NIM ended with even number
– Do 10.16 for NIM ended with odd number
• For Thursday class:
– Do 10.18 for NIM ended with 0,3,6,9
– Do 10.19 NIM ended with 1,4,7
– Do 10.20 for NIM ended with 2,5,8
When sample is not independent
• Sample is not independent:
– The same humans or objects are used before and after an experiment
Hypothesis testing for dependent samples
• The approach for dependent samples are different from the independent samples
• Make pairs of related members
• Calculate their differences
Example
Seorang investor di Bursa saham ingin mengetahui apakah ada perbedaan yang signifikan Antara rasio P/E (Price to earning) dari dua tahun yang berurutan.
9 perusahaan dipilih secara acak, tidak diketahui informasi sebelumnya, dan diasumsikan =1%. Berdistribusi normal.
Step 4: making decision region
• Because it is a two tailed test, we use /2= 0.005 df=n-1=9-1=8
• t0.005,8 = ±3.355
• Decision region:
– Rejection region t<-3.355 or t> 3.355 – Non Rejection region - 3.355 ≤t≤ 3.355
Step 5: gather sample data
Step 6: analysis the sample data
• Compute the statistic test
Step 7: Statistical Conclusion
• Rejection region t<-3.355 or t> 3.355
• t=-0.70
• - 3.355 ≤t≤ 3.355
• t is in non rejection region
Step 8: Making business decision
There is no significant differences in the average P/E ratio between year 1 and year 2.
Self Study
Homework
• For Monday class:
– Do 10.22 for NIM ended with even number
– Do 10.23 for NIM ended with odd number
• For Thursday class: