Mesoporous ZSM-5 catalysts: Preparation, characterisation
and catalytic properties. Part I: Comparison of different synthesis routes
Yi Hsin Chou
a,*, Colin S. Cundy
b, Arthur A. Garforth
a, Vladimir L. Zholobenko
caSchool of Chemical Engineering and Analytical Science, University of Manchester, P.O. Box 88, Sackville Street, Manchester M60 1QD, United Kingdom bCentre for Microporous Materials, School of Chemistry, University of Manchester, P.O. Box 88, Sackville Street, Manchester M60 1QD, United Kingdom
cSchool of Chemistry and Physics, Keele University, Staffordshire ST5 5BG, United Kingdom
Received 13 July 2005; received in revised form 30 September 2005; accepted 12 October 2005 Available online 23 November 2005
Abstract
In an attempt to improve mass-transport limitations, mesopores were created in a series of ZSM-5 catalysts by the carbon-templating procedure. A successful low-cost dry gel synthesis route was developed which almost entirely removed the need for the organic structure-directing agent (TPA/SiO2= 0.0033). Both an aqueous colloidal graphite sol and a pyrogenic (carbon black) material were investigated,
at addition levels of 16.5–100 wt.%. No major differences were observed between the two carbon sources. The addition of carbon to the synthesis composition retarded the crystallisation rate and modified the crystal morphology. The products were characterised by a vari-ety of physical techniques. Additional post-synthesis treatment (alkaline leaching) extended the mesopore system but also tended to reduce crystallinity and micropore volume.
2005 Elsevier Inc. All rights reserved.
Keywords: Hydrothermal synthesis; Dry gel synthesis; Carbon-templating; ZSM-5; Acidity
1. Introduction
The presence of mesopores in zeolite crystals assists in alleviating mass transfer limitations for reactants and prod-ucts in catalysis by reducing diffusional path lengths[1,2]. In this respect, rendering crystals mesoporous has the same effect as reducing the crystallite size of the sample. The micropore system of zeolites can be extended to a hierarchy of pore sizes in a number of ways. For example, an already porous structure can be ‘‘zeolitised’’ to provide additional micropores [3] or existing microporous crystals can be packed together to generate inter-crystalline mesopores
[4]. An alternative to these procedures is to modify the zeo-lite crystals themselves in order to create larger intra-crys-talline voids, usually by a post-synthesis combination of steaming and acid leaching [2]. More recently, a new method has been introduced in which the zeolite crystals
are allowed to ingest carbon particles during their growth
[5–9]. On calcination of the resulting
carbon-aluminosili-cate composite, mesopores are left by the removal of the nanosized carbon particles. Such multiporous crystals are of interest for applications in catalysis and sorptive separa-tion processes[3,10–13].
A limitation of the current carbon ‘‘templating’’ proce-dure appears to be the high quantity of organic structure directing agent (SDA) required for the synthesis, combined with the fairly low aluminium content in the product[3–
9,14]. The objectives of the present work were (a) to
com-pare different methods for introducing mesoporosity into high-silica zeolite crystals and (b) to generate a strongly acidic ZSM-5 catalyst with a high framework aluminium content using a minimum of SDA. To achieve the first objective, the carbon-templating procedure was compared with that of alkaline leaching [15–17] and also used in combination with it. In addition, a special form of the steam-assisted crystallisation (SAC) method [18–24] was developed to achieve both objectives. In this procedure,
1387-1811/$ - see front matter 2005 Elsevier Inc. All rights reserved. doi:10.1016/j.micromeso.2005.10.014
* Corresponding author.
E-mail address:[email protected](Y.H. Chou).
the reaction mixture is reduced to a dry powder and then heated in contact with saturated water vapour. This tech-nique has proved effective in the synthesis of a variety of zeolites, usually at modest SDA/SiO2ratios and sometimes in unusual compositional ranges.
2. Experimental
2.1. Standard hydrothermal preparations
The starting point for these preparations was a pub-lished procedure[25]. This was adapted for the hydrother-mal syntheses and extensively modified for the steam assisted conversions (Section2.2).
2.1.1. Preparation of reference sample (carbon-free, HT1)
A special seeding gel containing no aluminium (4.5Na2O:3.0TPAOH:60SiO2:1200H2O) was used to direct the formation of the final product. The seeding gel was pre-pared by dissolving 0.30 g of NaOH (99%, BDH) in 11.38 g of deionised water followed by adding 2.54 g of TPAOH (1 M aqueous solution, Lancaster Synthesis). Then 7.50 g of Ludox AS-40 silica sol (Aldrich) was introduced into the solution and the mixture was stirred at room tempera-ture for 30 min. This homogeneous gel was then sealed in a polypropylene (PP) bottle and aged at 100C for 16 h.
Using the same reagent sources as above, a feedstock gel (6.5Na2O:2.0Al2O3:60.0SiO2:1916.0H2O) was made by dissolving 0.69 g of sodium aluminate (50.9 wt.% Al2O3:31.2 wt.%Na2O:17.9 wt.%H2O, Fisher Scientific) in NaOH solution (0.62 g of NaOH in 49.72 g of deionised water) followed by adding 15.53 g of Ludox AS-40 sol. This mixture was stirred for 1 h at room temperature before addition of 3.2 g of seeding gel. The overall gel (6.36Na2O:1.86Al2O3:60.0SiO2:0.21TPAOH:1864.0H2O) was then stirred for 30 min to obtain homogeneity, trans-ferred to a PTFE-lined autoclave, and heated at 180C for 42 h. After cooling, the product was isolated by centrifugation, washed with deionised water and dried at 100C.
2.1.2. Preparation using colloidal silicalite as seed (carbon-free, CS1)
In this preparation, colloidal silicalite [26,27] was used to seed the synthesis of ZSM-5. The colloidal silicalite gel composition was 10.8(TPA)2O:60SiO2:1150H2O:240EtOH. The reaction solution was prepared by mixing 14.2 g of TEOS (98%, Aldrich), 25 g of TPAOH solution and 5.9 g of deionised water in a sealed PP bottle and then stirring at room temperature for 3 days to give a homogeneous solution. The solution was then heated at 90C for 3 days. The colloidal silicalite product was dialysed to give an aqueous sol of pH 8.3 and solids content 4.5 wt.% before being used as a seed.
The feedstock gel was identical to that used in the prep-aration of HT1, colloidal silicalite (5 wt.% with respect to the feedstock gel silica content) then being added as seed.
The synthesis and the separation of product were carried out as described in HT1.
2.1.3. Preparation with addition of carbon (HT2)
An aqueous colloidal graphite sol (Aquadag P, solids content 22 wt.%, average particle size <2lm and mostly submicron, Acheson Industries Inc.) was used as the car-bon source. After making allowance for this additional aqueous component, the preparation was otherwise similar to that for HT1. The quantity of carbon from Aquadag P was equivalent to 50 wt.% of the silica used in the reaction. Aquadag P (13.64 g) was diluted with 20.6 g of deionised water, and a pre-prepared sodium aluminate solution (0.62 g of NaOH, 0.69 g of NaAlO2and 18.48 g of deion-ised water) was added into the graphite solution under con-tinuous stirring. Ludox AS-40 (15.53 g) was then introduced into the mixture and the gel was stirred for an hour before addition of the seeding gel (3.2 g). The overall gel was stirred for a further hour and then heated in an autoclave at 180C for 42 h. The product isolation proce-dure was as for HT1.
2.2. Steam-assisted conversions (SAC)
2.2.1. Preparation of reference sample (carbon-free, SAC1)
The seeding gel as described for HT1 was used in this preparation, whilst the alkali concentration of the feedstock gel was lowered (3.5Na2O:2.0Al2O3:60.0SiO2: 870H2O). The preparation procedures were the same as for HT1 except for an additional drying procedure which was carried out prior to transferring the overall gel (3.58Na2O:1.86Al2O3:60.0SiO2:0.21TPAOH:896H2O) into a special autoclave. The water in the overall gel was gently evaporated on a hotplate (75C) under continuous stirring to obtain a thick gel. This was then dried at 100C for 16 h. The dry gel was ground into fine powder and placed in a fluoropolymer cup surrounded by sufficient water to provide saturated steam inside a PTFE-lined auto-clave at 180C for 24 h. The product isolation was as for HT1.
2.2.2. Preparation with addition of carbon
The gel preparations for the syntheses involving carbon were identical to that of the reference sample (SAC1), except for the addition of carbon prior to the drying of the overall gel. Three levels of carbon loading and two carbon sources were used, namely Aquadag P and BP2000 (carbon black with an average particle size 12 nm, Cabot Corp.). The use of additional SDA (TPABr with SiO2/TPA = 10) in the synthesis was also investigated. Detailed information is given inTable 1.
2.3. Calcination of as-made materials
2.4. Post-synthesis modification—alkaline leaching and ion-exchange
Several samples (AP4, BP1, and BP2) were treated with alkali in an attempt to increase pore volume by removing amorphous material as well as potentially developing the mesopores in the zeolite structure. Each calcined sample (660 mg) was dispersed in 20 ml 0.2 M sodium hydroxide
solution, sealed in a PP bottle and stirred at 85C for 30 min. The suspension was then cooled to 0C and the solid material was isolated, washed and dried.
The calcined sodium form of the zeolites (1 g) was ion-exchanged with 0.1 M NH4NO3 solution (150 ml) at 60C under constant agitation for 4 h. The zeolite suspen-sion was then centrifuged and the liquor was replaced by the same quantity of fresh NH4NO3 solution. The treat-ment was repeated three times (4 exchanges in all) and the zeolite was then washed thoroughly with deionised water following by drying at 100C. The ammonium forms of the zeolites were calcined again (500C) to produce the hydrogen form.
2.5. Characterisation
2.5.1. X-ray diffraction
Zeolite samples were characterised by XRD using a Phi-lips PW 1770 diffractometer with nickel filtered CuKa radi-ation scanning in the range of 3–50(2h) at an angular rate
of 0.3/min with a step size of 0.01.
2.5.2. Scanning electron microscopy
The microscope images were taken under high vacuum and medium voltage (20 kV) using a FEI Quanta 200 Envi-ronmental SEM (Philips). Samples were prepared by evenly dispersing a small amount of powdered zeolite on to a car-bon double-sided tape, which was then attached to a round metal stub and sputtered with gold.
2.5.3. Thermal gravimetric analysis
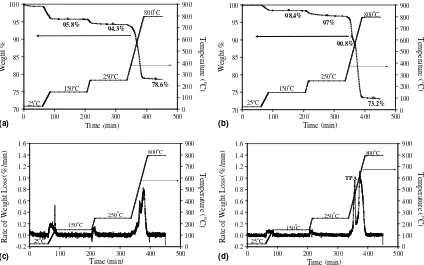
A SDT 2960 simultaneous DTA–TGA instrument was used to determine by weight the amount of water, organic template (TPA) and carbon in the prepared zeolites. Typi-cally, a small sample (10 mg) was heated in flowing air (100 ml/min). The temperature programme of the furnace used was composed of four segments. Samples were initially maintained at 25C for 1 h, then heated to 150C (5C/ min) and held for 2 h. The temperature was then increased to 250C (10C/min) and held for a further 2 h. Finally the temperature was raised to 800C (10C/min) and held for 1 h.
2.5.4. Nitrogen physisorption
The powdered sample (0.15 g) was previously degassed under vacuum at 350C for 16 h and nitrogen adsorption at 196C was carried out using a Micromeritics ASAP 2010 instrument.
2.5.5. Fourier transform infrared spectroscopy
Transmittance FTIR spectra of self-supported zeolite discs (10 mg) were collected using a Nicolet Prote´ge´ 460 spectrometer equipped with an MCT detector by averaging 200 accumulated scans in the 1300–4000 cm 1region at a resolution of 2 cm 1. The sample discs were activated under vacuum (1.32 mPa) at 450C for 6 h (the tempera-ture was ramped from ambient temperatempera-ture at 1C/min). Acidic properties of the activated samples were evaluated using pyridine (Py) adsorption. Typically, an excess of pyr-idine was admitted by injection of 0.1ll aliquots into the transmittance cell at 150C until no changes were observed in the spectra. Following each adsorption step, the sample was evacuated for 5 min at 150C to remove weakly bound pyridine, and the FTIR spectrum was collected. The obtained infrared spectra were analysed (including integra-tion, subtraction and determination of peak positions) using specialised Nicolet software, Omnic 4.1.
The Brønsted site density was calculated from the pyri-dine uptake using the Beer–Lambert law [28] with an absorption coefficient of 1.0038 derived by calibration against a standard ZSM-5 (Si/Al = 36, Zeolyst) containing very little extra-framework aluminium.
3. Results and discussion
3.1. Standard hydrothermal synthesis with and without carbon
The strategy adopted has been to select a reliable stan-dard preparation of high-Al ZSM-5 and then to adapt this in various ways for carbon-modified syntheses. The route chosen was based on that of Lechert and Kleinwort, as described in the IZA collection of verified syntheses [25]. The method is fundamentally that of an ‘‘inorganic’’ (i.e. non-organic-templated) route[29,30], but modified by the use of a Na,TPA-based seeding gel in order to encourage the crystallisation of an unusually Al-rich composition.
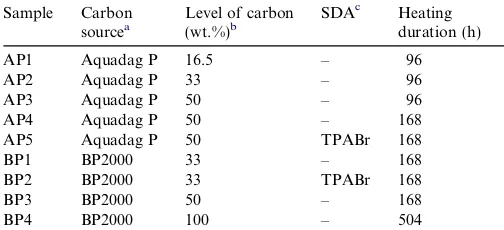
Table 1
Conditions for ZSM-5 syntheses at 180C
Sample Carbon
AP5 Aquadag P 50 TPABr 168
BP1 BP2000 33 – 168
BP2 BP2000 33 TPABr 168
BP3 BP2000 50 – 168
BP4 BP2000 100 – 504
a
Water in Aquadag P was taken into account in calculating the overall reaction composition.
b
Relative to the weight of the silica used in the overall gel (e.g. 6.2 g of BP2000 was used in the synthesis of BP4 where the quantity of silica was also 6.2 g).
cWhere indicated the gel composition with added TPABr was
3.5Na2O:6.0TPABr:2.0Al2O3:60.0SiO2:870H2O otherwise only minimal
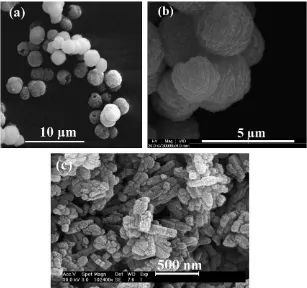
In the version employed here, the preparation was found to crystallise reproducibly to give a ZSM-5 sample with Si/Al = 23 and the morphology shown in Fig. 1((a) and (b)). The synthesis involving colloidal silicalite as a seed (CS1) was found to have a very different morphology from HT1with very small crystallite size (150 nm,Fig. 1(c)).
A trial was then carried out to determine whether any carbon could be incorporated by simply adding an aqueous colloidal graphite dispersion (Aquadag P) to the aqueous reaction mixture. Although the black products (HT2) made by this procedure contained up to 18 wt.% carbon (from TGA), optical and electron microscopic examination showed them to be physical mixtures of carbon particles and ZSM-5 particles having the same morphology as the carbon-free reference sample (HT1). The colloidal graphite clearly had only ‘‘bystander’’ status and consequently little or no influence on the zeolite synthesis. A further proof of this was the observation that the added carbon had no effect on the crystallisation time.
3.2. Steam-assisted conversion with and without carbon
Following the exploratory work described above, the standard preparation was modified to render it suitable for the steam-assisted conversion (SAC) technique [17– 23], principally by a reduction in the base level. At 180C, the SAC synthesis yielded a well-crystallised sample of ZSM-5 (Si/Al = 20) in 1 day. However, the mor-phology was quite different from that of the normal
hydro-thermal route (Fig. 2). Rather than the polycrystalline aggregates produced by the bulk solution synthesis, the SAC preparation consisted of well-formed single crystals (some intergrown) in the 6–10lm size range.
The SAC method was then used for the incorporation of carbon, utilizing both colloidal (Aquadag P) and nanosized solid (Cabot BP2000) sources. However, the progress of the reaction was now found to be considerably modified by the presence of the carbon, the overall reaction rate slowing down as the level of carbon was increased.
3.3. Carbon-zeolite composite crystals
A range of materials were synthesised with varied levels and type of added carbon. As a further modification, TPA cation (as TPABr) was added in pore-filling quantities (SiO2/TPA = 10) in an attempt to influence further the product crystal size and morphology.
3.3.1. X-ray diffraction
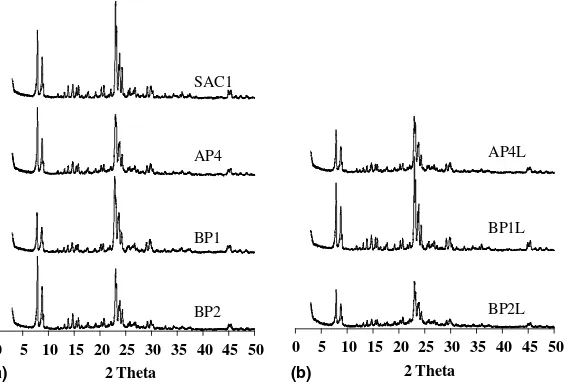
All the carbon containing zeolite samples (AP1-5, BP1-4) were characterised by XRD and some selected patterns are shown in Fig. 3 where SAC1 (no carbon) was found to have reached high crystallinity in 24 h (Fig. 3(a)). The crystallisation rate was found to reduce with increas-ing carbon quantity (16.5–50 wt.%), leadincreas-ing to incomplete reaction even when 96 h heating time was allowed. How-ever, an extended heating time (168 h) improved crystal-linity of AP4 to 80%. The decreasing crystallisation rate
was also observed in the BP series, BP4 (100 wt.%) requiring three times longer heating (504 h) to gain approximately the same crystallinity as BP1 (33 wt.%). Moreover, the addition of TPABr caused the lower crys-tallinity (70%) of BP2 even though the heating time was
extended to 168 h and the carbon level was the same as that for BP1.
As mentioned, a range of crystallinities were observed for the synthesised zeolites, i.e. these samples contained dif-ferent levels of amorphous material. Several samples (AP4, BP1 and BP2) were selected for alkaline leaching (0.2 M NaOH, 85C) and the XRD patterns are shown in
Fig. 3(b). It is notable that BP1L shows sharper and more
intense diffraction peaks after the caustic wash while the others (BP2L and AP4L) have reduced diffraction intensi-ties. One possible explanation could be that the caustic solution successfully dissolves the amorphous material in sample BP1 but at the same time extracts some Si from the framework (desilication). However, in AP4 and BP2 the desilication effect was perhaps too severe and conse-quently led to the partial collapse of the framework. There-fore, it is reasonable to assume that AP4 and BP2 had more open structures (possibly larger mesopores) than BP1,
allowing the caustic solution to attack the framework more effectively under similar conditions.
3.3.2. Crystal sizes and morphologies
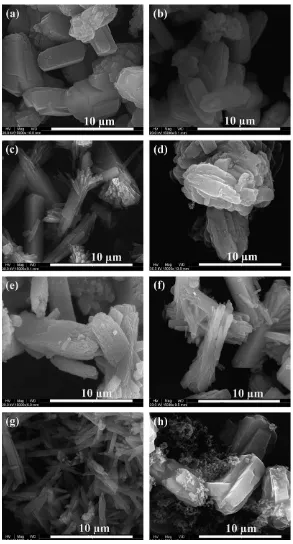
The SEM images of selected samples are shown in
Fig. 4. Whilst the primary particle size remained similar
between SAC1 and the majority of the carbon-loaded sam-ples (6–10lm), there was a marked change in morphol-ogy across the AP and BP series. As the carbon content of the synthesis mixture rose, the crystal blocks of the prod-uct became increasingly fissured and polycrystalline. Finally, at 100% loading in sample BP4,Fig. 4(h), the ori-ginal block structure was lost and the product crystals consisted of lath-like strips. This variation of morphology confirmed that the carbon was exerting a definite effect upon the crystallisation of zeolite.
The addition of reagent quantities of TPA to the synthe-sis composition (samples AP5 and BP2) did not lead to for-mation of smaller crystals, but again modified the crystal morphology,Fig. 4(d) and (h). Surprisingly, there was no obvious change in morphology when the nanoparticulate BP2000 replaced Aquadag P as the carbon source in the synthesis,Fig. 4(b) and (e).
Fig. 2. Carbon-free ZSM-5 sample (SAC1) synthesised by the steam-assisted conversion (SAC) route (a) low magnification (·15,000), (b) high magnification (·60,000).
0 5 10 15 20 25 30 35 40 45 50
2 Theta
SAC1
AP4
BP1
BP2
0 5 10 15 20 25 30 35 40 45 50 2 Theta
BP1L
BP2L AP4L
(a) (b)
3.3.3. Thermal analysis
The carbon contents in the uncalcined products were determined by TGA. The example TGA and DTG plots of AP4 and AP5 are shown inFig. 5.
The weight losses before 250C were due to the mois-ture desorbed from the samples. The only difference between AP4 and AP5 in the synthesis was the quantity
of TPA used (30 times larger in the latter) and hence the majority of micropores in AP5 were filled with TPA. As a consequence, AP5 contained less moisture (3% measured weight loss between 25 and 250C,Fig. 5(b)) compared to AP4 (5.7%). The most prominent weight loss was observed between 250 and 800C and can be attributed to the removal of carbon with an additional weight loss due to
Fig. 4. SEM images of calcined samples (nominal carbon contents of precursors in parentheses): (a) AP1 (16.5%); (b) AP2 (33%), (c) AP4 (50%); (d) AP5 (50%); (e) BP1 (33%); (f) BP3 (50%); (g) BP4 (100%); and (h) BP2 (33%). Samples AP5 (d) and BP2 (h) were synthesised with TPA/SiO2= 0.10, otherwise
the decomposition of TPA (in AP5 only,Fig. 5(b) and (d)).
Table 2details the carbon levels used in the synthesis and
the carbon determined from post-synthesis TGA experi-ments. The carbon contents determined in the final prod-ucts are between 70% and 90% of the nominal added carbon in the reaction precursor for the BP series. The rea-son for the apparently much larger discrepancies (50%)
with the AP materials is not at present known.
3.3.4. Sorption studies
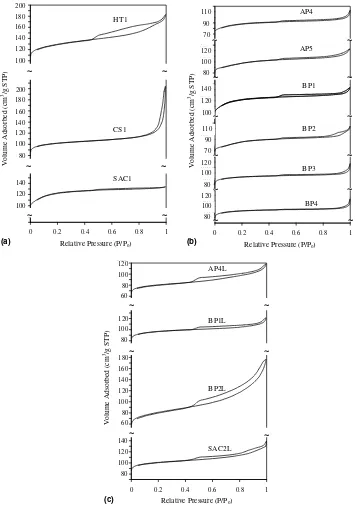
The nitrogen adsorption isotherms of selected zeolite samples are given inFig. 6. The samples from traditional hydrothermal syntheses (HT1 and CS1) have different types of hysteresis loops. The shape of the HT1 curve
(Fig. 6(a)) indicates two types of mesopores resulting from
the morphology of spherical polycrystalline aggregates
(Fig. 1): slit-shaped pores (p/p0= 0.42–0.9) and more
spherical voids (p/p0= 0.9–1.0). The hysteresis loop of
CS1 appears only at high relative pressure (p/p0= 0.9– 1.0) and reflects inter-crystalline voids in the packing of small crystals (150 nm). Sample SAC1 shows only a very
small hysteresis loop which suggests the presence of some slit-like inter-crystalline voids deriving from the packing of block-like crystals (Fig. 2).
The nitrogen adsorption isotherms of the carbon-modi-fied zeolites (AP4, AP5, BP1-4) are shown inFig. 6(b). The hysteresis loops of the carbon-derived samples are all larger than that of the carbon-free control (SAC1), suggesting an increase in mesopore volume. The relatively low micropore volumes may result either from incomplete crystallisation or partial pore blockage. The hysteresis loops in BP1 and BP3 indicate the presence of both inter-crystalline voids and intra-crystalline slits. However, the latter feature has disappeared from the disaggregated laths of sample BP4
(Fig. 3(h)).
The caustic-leached samples (APL4, BPL1 and BPL2) were also characterised by nitrogen adsorption and the resulting isotherms are shown inFig. 6(c). For comparison purposes the isotherm of leached sample SAC2 (SAC2L) is also included. (This sample was very similar to SAC1 but showed a reduced micropore volume: 80 cm3/g instead of 100 cm3/g). In all cases there is a marked increase in meso-pore volume, with BP2 showing the largest effect. The micropore uptake of the carbon-modified samples was reduced, probably due to partial extraction of silicon from the lattice and structure degradation. However, the micro-pore uptake of the ‘‘blank’’ SAC2 was slightly increased, perhaps suggesting that the original difference from the sister-sample SAC1 may have been due to partial pore
78.6%
Weight % Weight %
0
Fig. 5. TGA plots of as-made ZSM-5 (a) AP4, (b) AP5 (with the decomposition of TPA clearly visible) and DTG plots (c) AP4, (d) AP5 (with an additional TPA peak).
Table 2
Carbon content in the synthesis mixture and the final product
Sample Carbon content (wt.%)
Reaction precursora Reaction productb
AP4 33.3 15.7
AP5 (TPA) 33.3 17.6
BP1 24.8 19.6
BP2 (TPA) 24.8 17.6
BP3 33.3 28.8
BP4 50.0 43.5
blockage by alkali-soluble amorphous material. This is confirmed by the XRD patterns of the two samples in which SAC2 shows only a slight overall reduction in crys-tallinity in comparison with SAC1 but where the intensities of the low angle lines around 7–8(2h) (sensitive to
intra-pore material) are reduced by 20%.
Further analysis of sorption data will form the subject of a future publication.
3.3.5. Acidity (FTIR spectroscopy)
FTIR-pyridine was used to determine the true frame-work Si/Al ratio in some selected products (H-form) and
the spectra of three samples (SAC1, HT1, and CS1) are shown inFig. 7.
Among the three samples, SAC1 has the highest concen-tration of bridging acid sites (3610 cm 1) and the lowest concentration of extra-framework Al (3660 cm 1) and sila-nol groups (3745 cm 1). The increased absorption at 3745 cm 1for HT1 and CS1 derives from the high external surface area (small crystallite size). The absorption peak at 3610 cm 1 was found to have disappeared after several injections of pyridine which suggests that all the bridging acidic sites were accessible. Also, inFig. 7(b) SAC1 shows the lowest ratio of Lewis acid sites (1450 cm 1) to Brønsted 0
Relative Pressure (P/Po) Relative Pressure (P/Po)
Volume Adsorbed (cm
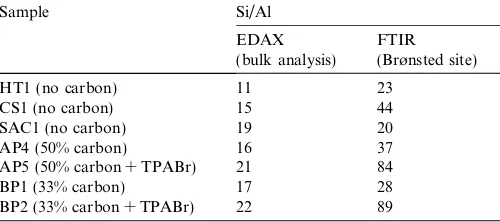
acid sites (1540 cm 1). In other words, SAC1 (L/B = 0.2) synthesised under the dry gel system has fewer structural defects than HT1 (L/B = 0.5) and CS1 (L/B = 0.9) made under traditional hydrothermal conditions.Table 3details the Si/Al values for the measured samples, all of which are higher than expected (reaction mixture Si/Al = 15). It is notable that AP5 and BP2 with reagent quantities of TPA in the syntheses had much higher Si/Al values than the others. Such reaction compositions crystallise MFI products in the absence of added aluminium. The presence of stoichiometric TPA has thus excluded much of the gel aluminium from the crystalline product.
4. Conclusions
This work reports low-cost ZSM-5 syntheses with mes-opores incorporated into the product crystals. A series of ZSM-5 catalysts have been successfully synthesised under various conditions using carbon-templating. In terms of heating method, the SAC procedure was found to result in fewer framework defects (FTIR) than conventional hydrothermal synthesis. High aluminium ZSM-5 with a large crystal size (6–10lm) was obtained by the SAC method using a greatly-reduced proportion of organic tem-plate compared to the quantities used by Jacobsen [5–8]. The addition of carbon retarded the crystallisation rate and modified the crystal morphology. It was found that BP4, containing the highest level of carbon (100 wt.% with respect to reaction silica) required three times the heating
duration (504 h) of BP3 (50 wt.%) to show comparable crystallinity. With the increasing carbon content in BP1 (33 wt.%), BP3 (50 wt.%), and BP4 (100 wt.%) the crystal morphology became increasingly fragmented, the crystals finally becoming transmuted into irregular lath-like frag-ments at the highest carbon loading. Hysteresis loops in the nitrogen adsorption–desorption isotherms indicate the presence of both inter- and intra-crystalline mesopores in the carbon-templated ZSM-5 materials. However, incom-plete crystallisation or partial blockage of micropores leads to relatively low micropore volumes in some products. Although two different carbon sources were used, their behaviour in the syntheses appeared to be very similar.
The bulk Si:Al ratio for a number of products was ana-lysed by EDAX and the result for each sample was very close to the value in the synthesis gel (Si/Al = 15). How-ever, values from FTIR acidity measurements were higher than expected. Hence, it can be concluded that, although the majority of the aluminium in the reaction precursor was present in the final product, reduced levels were incor-porated into the ZSM-5 framework. As the carbon content in the synthesis was increased, the framework aluminium decreased (Table 3). Even less incorporation of aluminium was observed in the preparations with additional TPABr as the reaction passed from an essentially inorganic to a TPA-templated synthesis. The influence of the carbon appears also to derive from a real chemical effect in which the progression of the crystallisation is retarded. Possibly, the nanosized carbon is acting in a manner similar to that of a polymeric growth inhibitor. Mass transfer limitations could also exert some control1: the nanoparticulate carbon may coat the reactant surfaces at the drying stage, thus reducing reactivity during the synthesis step.
The post-synthesis treatment (alkaline leaching) proba-bly dissolved amorphous material and generated more mesoporosity, but it also led to slightly reduced crystallin-ity and micropore volume. Sample BP2 suffered a more severe impact from alkaline leaching than either AP4 or BP1, which tends to suggest a more open structure, allow-ing the caustic solution to attack its framework easily. It is also possible that the relatively more effective leaching of
Table 3
Values of Si/Al for selected samples (the Si/Al in the reaction mixture was 15)
HT1 (no carbon) 11 23
CS1 (no carbon) 15 44
SAC1 (no carbon) 19 20
AP4 (50% carbon) 16 37
AP5 (50% carbon + TPABr) 21 84
BP1 (33% carbon) 17 28
BP2 (33% carbon + TPABr) 22 89
1
We thank Professor Thomas Bein for this suggestion. 3000
Wavenumber (cm-1)
Absorbance
Wavenumber (cm-1)
Absorbance
(b)
SAC1
HT1
CS1
BP2 was due to its more siliceous framework which facili-tated an enhanced attack by the caustic solution.
Acknowledgements
The authors are indebted to the late Mr. R.J. Plaisted for his experimental guidance and helpful discussions, and to Dr. Patrick Hill for his assistance in the operation of the electron microscope.
References
[1] A. Corma, Chem. Rev. 97 (1997) 2373.
[2] S. van Donk, A.H. Janssen, J.H. Bitter, K.P. de Jong, Catal. Rev. 45 (2003) 297.
[3] M.W. Anderson, S.M. Holmes, N. Hanif, C.S. Cundy, Angew. Chem. Int. Ed. 39 (2000) 2707.
[4] A.H. Janssen, I. Schmidt, C.J.H. Jacobsen, A.J. Koster, K.P. de Jong, Micropor. Mesopor. Mater. 65 (2003) 59.
[5] C. Madsen, C.J.H. Jacobsen, Chem. Commun. (1999) 673. [6] I. Schmidt, C. Madsen, C.J.H. Jacobsen, Inorg. Chem. 39 (2000)
2279.
[7] C.J.H. Jacobsen, C. Madsen, T.V.W. Janssens, H.J. Jakobsen, J. Skibsted, Micropor. Mesopor. Mater. 39 (2000) 393.
[8] C.J.H. Jacobsen, C. Madsen, J. Houzvicka, I. Schmidt, A. Carlsson, J. Am. Chem. Soc. 122 (2000) 7116.
[9] I. Schmidt, A. Boisen, E. Gustavsson, K. Stahl, S. Pehrson, S. Dahl, A. Carlsson, C.J.H. Jacobsen, Chem. Mater. 13 (2001) 4416. [10] M.E. Davis, Nature 417 (2002) 813.
[11] P. Yang, T. Deng, D. Zhao, P. Feng, D. Pine, B.F. Chmelka, G.M. Whitesides, G.D. Stucky, Science 282 (1998) 2244.
[12] Y. Whang, Y. Tang, A. Dong, X. Wang, N. Ren, W. Shan, Z. Gao, Adv. Mater. 14 (2002) 994.
[13] J. Sun, Z. Shan, T. Maschmeyer, J.A. Moulijn, M.O. Coppens, Chem. Commun. (2001) 2670.
[14] F.A. Topsoe, C.J.H. Jacobsen, M. Brorson, C. Madsen, F. Schmidt, U.S. Patent 6,241,960, 1999.
[15] J.C. Groen, L.A.A. Peffer, J.A. Moulijn, J. Perez-Ramirez, Micropor. Mesopor. Mater. 69 (2004) 29.
[16] T. Suzuki, T. Okuhara, Micropor. Mesopor. Mater. 43 (2001) 83. [17] J.C. Groen, J. Perez-Ramirez, L.A.A. Peffer, Chem. Lett. (2002) 94. [18] M. Matsukata, N. Nishiyama, N. Ueyama, Micropor. Mater. 1
(1993) 219.
[19] M. Matsukata, N. Nishiyama, K. Ueyama, Micropor. Mater. 7 (1996) 109.
[20] M. Matsukata, M. Ogura, T. Osaki, P. Rao, M. Nomura, E. Kikuchi, Top. Catal. 9 (1999) 77.
[21] M. Matsukata, M. Ogura, T. Osaki, E. Kikuchi, A. Mitra, Micropor. Mesopor. Mater. 48 (2001) 23.
[22] M. Matsukata, T. Osaki, M. Ogura, E. Kikuchi, Micropor. Mesopor. Mater. 56 (2002) 1.
[23] P. Rao, K. Ueyama, M. Matsukata, Appl. Catal. A 166 (1998) 97. [24] P. Rao, C. Leon, K. Ueyama, M. Matsukata, Micropor. Mesopor.
Mater. 21 (1998) 305.
[25] H. Robson, K.P. Lillerud (Eds.), Verified Syntheses of Zeolitic Materials, second ed., Elsevier, London, 2001, p. 198.
[26] C.S. Cundy, J.O. Forrest, R.J. Plaisted, Micropor. Mesopor. Mater. 66 (2003) 143.
[27] A.E. Persson, B.J. Schoeman, J. Sterte, J.-E. Otterstedt, Zeolites 14 (1994) 557.
[28] F. Thibault-Starzyk, B. Gil, S. Aiello, T. Chevreau, J.-P. Gilson, Micropor. Mesopor. Mater. 67 (2004) 107.