Vol. 43 (2000) 279–293
Ownership structure and the quality of medical care:
evidence from the dialysis industry
Jon M. Ford
∗,1, David L. Kaserman
Department of Economics, Auburn University, Auburn, AL 36849-5242, USA
Received 4 August 1997; received in revised form 14 February 2000; accepted 14 February 2000
Abstract
Quality-of-care issues in the US dialysis industry have led to proposals to proscribe physician ownership of these facilities. The logic behind this approach relates to a profits/quality tradeoff created by the existing reimbursement structure. Given that tradeoff, separating ownership from quality-of-care decision making ostensibly could improve performance. Our empirical results, how-ever, do not support that expectation. We find that, within the for-profit sector, physician-owned clinics deliver significantly higher quality-of-care than their corporate-owned counterparts. No significant difference was found between physician-owned for-profit and not-for-profit clinics. © 2000 Elsevier Science B.V. All rights reserved.
JEL classification: I18; L84
Keywords: Health; Government policy; Regulation; Public health; Industry studies; Personal and professional
services
1. Introduction
In recent years, the ownership structure of firms providing health care services has be-come an important public policy issue. Concerns about cost containment, conflicts of in-terest, and quality of care have motivated policy makers to consider and impose various constraints on the pattern of ownership in markets for medical services.2 An example is the recent series of legislative actions taken by the US Congress known as Stark I and
∗Corresponding author.
1This topic was first addressed in my doctoral dissertation titled ‘Four Essays on the Dialysis Industry’ completed
on 10 June 1996 at Auburn University.
2See Eichenwald (1995), and Mitchell and Scott (1992).
Stark II. These laws place various restrictions on physician ownership of medical facilities and self-referrals.3
The principal motivation behind this series of legislation concerns the potential conflict of interest that can arise when physicians have a financial interest in various ancillary medical services provided. When physicians are owners of these ancillary facilities (imaging labo-ratories, clinical labolabo-ratories, rehabilitation centers, etc.), a profit motive to over-prescribe their usage can arise.4 The resulting increase in treatment costs has led third-party payors such as Medicare and private insurers to push for and obtain legislation that attempts to sever the tie between referral decisions and profitability by proscribing physician ownership of these facilities.5
In the past, similar policy action has been considered that would restrict physician owner-ship of for-profit dialysis clinics.6 The perceived problem here, however, is economically distinct from the self-referral problem that motivated the prior legislation. Specifically, while the self-referral issue pertains primarily to the link between ownership and cost, the concern in the dialysis industry relates to the potential connection between ownership structure and quality of care.
As we explain below, the reimbursement mechanism currently used to fund dialysis clinics creates a distinct tradeoff between profits and the quality of care delivered. Given that tradeoff, the ownership structure of the clinic may affect where the firm chooses to locate along the resulting profit/quality frontier. In particular, different ownership structures among for-profit clinics (viz. physician versus corporate owned) may differ systematically in the relative weights they place on profits versus quality of care. Similarly, not-for-profit clinics may differ from their for-profit counterparts in selecting optimal quality levels.7 If ownership structures do influence quality, such impacts should be considered when making policy decisions that influence these structures.
Concern about ownership structure in the dialysis industry has arisen largely from the observed performance of this industry over the past decade or so. Specifically, the observed mortality rate among dialysis patients in the US is more than twice that of many other developed countries.8Moreover, the relatively poor performance of the US dialysis industry is not explained by observed differences in the underlying characteristics of the patient
3See Babcock (1993), and Mitchell and Scott (1992). Specifically, Stark I (Omnibus Budget Reconciliation Act
of 1989) bars self-referral arrangements for clinical laboratory services under the Medicare program. This Act became effective on 1 January 1992. Stark II (Omnibus Budget Reconciliation Act of 1993) extends the ban to an additional list of Medicare services and incorporates Medicaid services as well. This Act became effective 1 January 1995. Technical alterations were made by the Social Security Amendments of 1994. These amendments clarified the definition of radiological services and investment/compensation arrangements.
4See Danzon (1982).
5A fairly extensive literature has developed which demonstrates empirically that physician ownership of ancillary
facilities leads to increased referrals to those facilities. See, e.g. Hillman et al. (1990), Relman (1992), Mitchell and Scott (1992), Scott and Mitchell (1994), and Mitchell and Sass (1995). As Mitchell and Scott (1992) argue, however, complex ownership structures can be used to circumvent legal proscriptions on direct ownership.
6Early drafts of the original Stark legislation included dialysis clinics within the scope of proscribed facilities.
The final bill, however, explicitly excluded these clinics.
7Schlesinger et al. (1996) provide an overview of the changing role of the nonprofit form of ownership in the
delivery of medical services in general.
population. In other words, it is not due to treatment of more severely ill patients in the US. Largely in response to such performance problems, proposals have surfaced to proscribe physician ownership of dialysis clinics. The basic idea behind such proposals is that, by severing the physician’s dual roles as both the residual claimant and the primary enforcer of quality of care, improved industry performance will result.
In this paper, we focus on the impact of ownership structure on the quality of care de-livered by firms providing dialysis services. Here, however, we argue that, at least in this industry, the impact of ownership structure on quality of care is theoretically indetermi-nate. Specifically, within the for-profit sector, it depends upon the relative marginal rates of substitution between profits and quality of care exhibited by physician owners versus corporate owners. It also depends upon the extent to which agency problems and physician compensation schemes within the larger corporation provide physician employees the lat-itude to deviate from and/or the incentive to conform to corporate preferences regarding the profit-quality tradeoff. In addition, the relative quality of care provided by not-for-profit clinics relative to their for-profit counterparts is also theoretically indeterminate due to ques-tions regarding the comparative cost performance of these firms.9 As a consequence, the effect of alternative ownership structures on quality of care becomes an empirical question, and it is that question which we examine here.
Our investigation is relevant to two principal policy issues. First, within the for-profit sec-tor of the dialysis industry, would laws proscribing physician ownership have their intended effect of improving the quality of care delivered? And second, should public policy attempt to improve quality through greater encouragement of the nonprofit form of ownership? Both of these questions are germane to the formation of efficient dialysis clinic ownership policy. The paper is organized as follows. In Section 2, we provide a brief description of the dialysis industry and the underlying cost structure of the firms that comprise this industry. Section 3 describes the present mechanism used to fund the provision of dialysis services and the profit-quality tradeoff created by that funding mechanism. It also considers the like-lihood that not-for-profit clinics will provide a higher quality of care than their for-profit counterparts. Section 4 explains several countervailing arguments regarding the likely im-pact of a legal prohibition on physician ownership and profit versus non-profit status of dialysis clinics on the quality of care delivered. Section 5 presents an empirical model of the determinants of the prescribed duration of dialysis treatments, which is a principal de-terminant of both costs (and therefore, profits) and the quality of care provided.10 Section 6 describes the data and empirical results, and Section 7 concludes.
2. Background on the dialysis industry
Dialysis clinics earn profits by providing dialysis and related services to persons suffering from renal failure. Eighty-three percent of the independent (i.e. non-hospital-based) clinics
9Griffiths et al. (1994, p. 473) conclude that “For-profit facilities appear to be more efficient producers of dialysis
treatments than not-for-profits.”
10Held et al. (1991, p. 871) write that “We conclude that duration of the dialysis procedure is an important element
are operated on a for-profit basis.11 Their revenues come primarily from the Health Care Financing Administration (HCFA) under the End Stage Renal Disease (ESRD) Program, which is a part of Medicare. This program was initiated in 1972 to relieve kidney patients of the catastrophic costs of dialysis treatment by covering 80 percent of the costs of the service.12 Expenditures under the ESRD Program have grown rapidly over time. The Program’s budget has increased from US$ 229 million in its initial year of operation to more than US$ 6 billion in 1994 as the number of patients undergoing dialysis has grown from approximately 11,000 to 187,000 over this period.13
The dialysis industry is highly labor intensive. Labor costs, which consist largely of nurses’ and technicians’ wages, account for some 70–75 percent of total costs. Moreover, this cost structure is dictated by the existing technology for providing dialysis service. Specif-ically, patients must remain connected to a dialysis machine for approximately 2–5 hours generally three times per week. This machine performs two essential functions normally provided by the kidneys — it filters impurities from the blood and removes excess fluid.
During treatment, patients must be monitored at regular intervals so that various symp-toms that typically arise (e.g. cramps, nausea, and hypotension) can be treated. In addition, all patients must be evaluated (weight, blood pressure, temperature, and pulse taken, etc.) both prior to and following treatment, and they must be connected to the machine by in-serting two large (15–17 gauge) needles into a vascular access that is usually located in the patient’s arm. As a consequence of these care requirements, clinics must employ approxi-mately three to four nurses (RNs and LPNs) or technicians for every 10 patients undergoing dialysis treatment at a given time. Importantly, as a consequence of these requirements, the costs per patient dialyzed increase with the duration of the treatment prescribed.14
3. The profits-quality tradeoff15
HCFA’s current regulatory pricing structure for dialysis services consists of a single fixed payment per patient per treatment delivered. At the present time, this payment is approximately US$ 128 on average.16 It varies slightly from one region of the country to another to reflect cross-sectional differences in nurses’ wages; but, in all regions, it remains a fixed fee per treatment delivered.
Because revenues per treatment are unaffected by the length of time the patient is dialyzed under this pricing structure while costs per treatment increase monotonically with the length of run, there is a functional relationship created between profits earned per treatment and the duration of the treatment that the physician prescribes for each patient. Moreover, treatment duration has been shown to be a significant determinant of the efficacy of the dialysis
11See United States Department of Health and Human Services (1990).
12It currently costs approximately US$ 30,000 per year to maintain a renal patient on dialysis. See Eichenwald
(1995).
13See Eichenwald (1995).
14Capital costs also increase with treatment duration because additional machines and floor space may be required
to dialyze a fixed number of patients more hours per week. Thus, virtually all inputs must increase with increases in treatment duration.
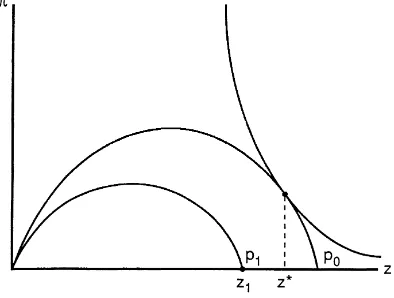
Fig. 1. For-profit clinic owner’s choice of optimal profits and quality.
service. Specifically, reduced running times have been found to cause an increased rate of mortality among dialysis patients, ceteris paribus.17 Consequently, there is a distinct tradeoff between profits and quality of care under the current funding mechanism.
That tradeoff may be depicted graphically as a profit-quality frontier, which is shown as the curve labeled p0in Fig. 1. Here, profits,π, appear on the vertical axis and treatment
duration (or quality), z, is shown on the horizontal axis. The p0frontier for a given
reim-bursement rate, then, should be concave, as shown in the graph. That is, at sufficiently low levels of quality, both profits and quality can be increased together. This positive relationship between quality and profits may stem from two alternative sources. First, where clinics face competition, the delivery of relatively low quality of care may drive patients to other clinics, thereby reducing profits. And second, even in the absence of competition, where quality be-comes extremely low, patients will suffer increased complications and will be hospitalized more frequently. Because dialysis clinics receive no reimbursement for patients who are being cared for in the hospital, their profits are lowered by more frequent hospitalizations. Thus, at sufficiently low levels of quality, the clinic’s profits will increase with improved quality through the direct effect such quality has on the demand for its services.
Beyond some profit-maximizing level of quality, shown as z0 in the graph, however,
the profits-quality relationship becomes negative. Here, the marginal costs of extending treatment duration exceed the marginal revenues from improving the quality of care. As a result, further increases in quality reduce profits. Consequently, the profits-quality frontier will appear as an inverted U, as shown in the graph.
Given that frontier, dialysis clinic owners will select an optimal profit/quality combination according to the preferences held for these two ‘goods.’ That is, owners of for-profit clinics are expected to have utility functions containing both profits and quality of care as arguments, and both are expected to exhibit positive marginal utilities. Given these preference functions, utility maximization will result in different quality of care choices for decision makers with different marginal rates of substitution of quality for profits. Given the indifference curves shown in Fig. 1, for example, the clinic owner will select the profit-quality combination
Fig. 2. For-profit versus not-for-profit clinics.
π∗, z∗. A clinic owner who placed no personal value on the quality of care provided (i.e. an
owner for whom the marginal utility of quality is zero), however, would select theπmax, z0
combination. Obviously, as the owner’s marginal rate of substitution of quality for profits increases, higher levels of quality (and lower levels of profits) will be selected, ceteris paribus.
Clinics operated on a not-for-profit basis, then, would be expected to select theπ=0, z=z1 combination in Fig. 1, ceteris paribus. That is, not-for-profit clinics should choose
the maximum level of quality consistent with a break-even (zero-profit) constraint. As a result, for a given profit-quality relationship, not-for-profit clinics should tend to produce relatively higher levels of quality compared to the for-profit clinics.
Not-for-profit clinics, however, appear to be less efficient producers of dialysis services than their for-profit counterparts.18 If so, they may exhibit higher costs (at a given quality level) than for-profit clinics. The profit-quality frontier for these clinics, then, may fall below the profit-quality frontier exhibited by for-profit clinics. That is, a given reimbursement rate will yield lower profits for any given level of quality for the relatively high-cost (nonprofit) clinics. Consequently, the zero-profit level of quality, z1, may be lower for these facilities.
Therefore, the above hypothesis of greater quality in the not-for-profit clinics is ambiguous. It is plausible that, due to higher costs, quality might actually be lower in these clinics. This outcome is depicted in Fig. 2, where the for-profit clinic selects quality level z∗along the p0profit-quality frontier, and the not-for-profit clinic selects quality level z1(where z∗>z1)
at the break even level along the p1profit-quality frontier.
4. Ownership structure and quality choice: some countervailing arguments
For-profit dialysis clinics generally assume two broad forms of organizational structure. Some (approximately 11 percent of the for-profit clinics) are not incorporated but, instead,
18See Griffiths et al. (1994). For an analysis of for-profit versus not-for-profit hospitals, see Sloan and Vraciu
are owned by individuals or partnerships. Owners of those clinics are generally the physi-cians (nephrologists) who operate them. The remaining for-profit clinics (approximately 89 percent) are owned by relatively large health care corporations which employ the physi-cians who work at their clinics.19 The simple analysis presented above suggests that, for a given reimbursement rate, the quality of care delivered by for-profit dialysis clinics may be influenced by the ownership structure of those clinics if different types of owners ex-hibit systematically different marginal rates of substitution of profits for quality. The nature of that ownership structure/quality relationship, however, cannot be determined a priori, because several countervailing influences may be at work.
First, because prescribed running times for individual patients are set by the attending physician, a corporate ownership structure in which the physician is no longer the residual claimant may lead to higher quality of care as the physician’s profit incentive to lower the prescribed length of run is potentially eliminated. Indeed, it appears that this anticipated effect of severing the link between ownership and quality of care decisions is the principal motivation for recent proposals to proscribe physician ownership of dialysis clinics.
Second, however, corporate owners may exhibit a stronger preference for profits over quality (i.e. a lower marginal rate of substitution of quality for profits) than physician owners. Because dialysis patients tend to receive treatments over extended periods of time (often for years), physicians may develop close personal relationships with their patients. Corporate owners, however, are rarely, if ever, in direct contact with patients. As a result, physicians may exhibit a stronger preference for quality than corporations.20 Thus, to the extent that corporate owners exhibit a lower marginal rate of substitution of quality for profits, proscribing physician ownership of dialysis clinics may lead to a lower quality of care. In other words, the divergent preferences of physicians versus corporate owners for quality versus profits could overcome the quality-enhancing effect of severing the tie between ownership and patient care decisions.
Moreover, in addition to the above countervailing effects, incentive and enforcement mechanisms within the firm may operate to eliminate any significant difference in the quality of care provided by physician versus corporate owners. For example, agency problems may provide physician employees the latitude to provide a higher quality of care than is preferred by corporate owners. If so, the weaker preference for quality held by corporate owners may be overcome, and corporate ownership may result in improved quality of care. At the same time, however, incentive payment plans or profit-sharing arrangements may be used by corporate owners to provide physician employees the incentive to reduce quality in order to increase profits. Where this occurs, corporate ownership may lead to reduced quality.
Therefore, even if we knew the relative marginal rates of substitution of quality for profits of physician owners versus corporate owners, agency problems and/or incentive compen-sation schemes could overcome the effects of any such differences as well as the effects of severing the owner–prescriber tie through a legal prohibition on physician ownership of
19The largest of these is National Medical Care, which treats approximately 21 percent of all dialysis patients in
the US. See Eichenwald (1995).
20If this is the case, Fig. 1 suggests that dialysis industry assets will be worth most to those who derive zero
marginal utility from improved quality of care (i.e. those who would choose to locate at z0in the graph). As a
for-profit clinics. Consequently, a simple separation of ownership from patient care decision making may have little or no effect on the quality of care delivered in for-profit clinics. In fact, under certain circumstances, it may even reduce quality.
Also, as explained above, due to cost considerations, it is not clear whether for-profit clinics (either physician or corporate owned) will provide a higher or lower quality of care than not-for-profit clinics. Consequently, the ultimate impacts of these various ownership structures on quality of care is an empirical question. It is to that question we now turn.
5. The empirical model
Various measures of the quality of patient care have been proposed in the dialysis industry. Such measures include: (1) staffing levels; (2) mortality rates; (3) patient responses to questionnaires; and (4) treatment duration.21 Here, we use the prescribed length of run (or treatment duration) for each patient (controlling for individual patients’ characteristics) to indicate the quality of care delivered. Two considerations suggest that this variable provides a reasonable measure of the quality of dialysis treatments. First, when a patient receives a hemodialysis treatment, ceteris paribus, the amount of time spent connected to the machine is directly related to how thoroughly the patient’s blood is cleansed. And cleaner blood leads to an overall improvement in patients’ health and life expectancy.22 Second, because the reimbursement received by the clinic from HCFA is a fixed amount per treatment, the most direct approach to increase profits by reducing quality would appear to be through reduced running times.23 Consequently, observed treatment duration is likely to provide a suitable measure of the quality of care delivered. Treatment duration, then, is the dependent variable in our empirical model.
A number of variables other than the ownership structure of the dialysis clinic are likely to influence the treatment duration prescribed for an individual patient. Therefore, it is necessary to incorporate such variables in our empirical model in order to hold these other influences constant. We briefly describe the rationale for including each of these variables in the model.
First, the physical characteristics of the patient are likely to play a significant role in determining prescribed running times. Several such characteristics are included here. The patient’s weight and height are included in order to account for overall size and muscle mass. Because larger patients with greater muscle mass require longer run times to achieve a given reduction in blood impurities, the coefficients of both of these variables are expected to have positive signs. Next, as people age, they generally tend to lose muscle mass. Therefore, we include the patient’s age, with the expectation that a negative coefficient will result. We also include a gender dummy equal to one if the patient is male. Because males tend to have more muscle mass, we anticipate a positive sign on the coefficient of this variable. Finally, run times may be influenced by the presence of other health problems. Therefore, we add two
21See, e.g. Held and Pauly (1983), and Held et al. (1987). 22See Held et al. (1991).
23Other cost-reducing quality-related actions might include reuse of dialyzers and other equipment, reduced
binary variables indicating whether the patient is diabetic and whether the patient suffers from hypertension.
In addition to the above physical characteristics of the patient, prescribed treatment duration may be influenced by the type of access the patient has in place.24 Certain types of access can accommodate higher blood flow rates, and thereby, facilitate improved filtration. Consequently, access type may affect the running times required. Therefore, we incorporate two binary variables to reflect the two most common accesses.
Also, the overall ‘dosage’ of dialysis delivered by a given treatment is influenced by two principal factors other than the treatment duration. First, the blood flow rate is the speed at which the patient’s blood is pumped through the dialysis machine. The patient’s physical condition — primarily the condition of their circulatory system — largely determines the blood flow rate that can be tolerated. Higher blood flow rates result in increased filtration for a given treatment duration. Consequently, a higher blood flow rate should shorten the prescribed running times, ceteris paribus. And second, there are different sizes and types of dialyzers that can be used on a given dialysis machine, where ‘size’ refers to the surface area of the fibers contained within the filter.25 In addition, the capacity of these dialyzers is influenced by the permeability of the membrane material. The combined effects of both surface area and permeability is reflected by the ultrafiltration coefficient, or KUF, of the given dialyzer.26 The larger this coefficient, the greater the filtration achieved per unit of time at a given blood flow rate.27 Thus, the coefficients of both the blood flow rate and the KUF coefficient of the dialyzer should be negative.
In addition to ownership type, the overall size of the dialysis clinic may influence the quality of care delivered.28 We measure clinic size by the number of dialysis stations (a capacity-based measure). Countervailing arguments can be made regarding the expected sign of the coefficient of this variable. On the one hand, if cost savings attributable to economies of scale are present, larger clinics may tend to be more profitable, and therefore, less prone to cut back on prescribed running times in order to increase returns. On the other hand, however, smaller clinics may allow attending physicians to develop closer personal ties with patients, and thereby, make them less willing to sacrifice quality for profits. Consequently, we are unable to express a clear hypothesis concerning the expected sign of this coefficient.
Also, to allow for potential variation in treatment regimes across geographic regions, we add three regional dummies — R1, R2, and R3 — to the model. These dummies correspond
24‘Access’ refers to the type of vessel that has been surgically installed within the patient’s circulatory system
from which the patient’s blood is drawn and to which the patient’s blood is returned as the dialysis process occurs. Several such vessels are typically employed, with the two most common being the fistula and gortex graph. Other types of accesses include the bovine graph, temporary line, and permanent subclavian catheter.
25The dialyzer is a filter that is attached to the dialysis machine through which the patient’s blood and a dialysate
solution are simultaneously pumped in opposite directions. Filtration occurs by osmosis of certain molecules from the blood to the dialysate solution.
26KUF is defined as the milliliters of water per hour that will pass through the membrane with zero pressure. 27Because dialyzer size is selected by the prescribing physician, there is a potential problem with endogeneity
of the KUF variable. That is, both treatment duration and KUF simultaneously determine the ‘dosage’ of dialysis received. We investigate this potential empirical issue below.
28Held et al. (1987, p. 645) report that “. . .lower death rates were observed for patients treated in larger dialysis
to the southern, midwestern, and western regions, respectively. The excluded region, then, is the east. No hypotheses are expressed regarding the expected signs of the coefficients of these variables.
Finally, the variables of primary interest here are the binary variables representing the clinic’s ownership structure. Two such variables are defined. The first, PO, represents physician-owned, for-profit clinics that are listed as being owned either individually or held in partnership. Given the ownership patterns generally observed in this industry, this variable should correspond reasonably well to a physician-owned versus corporate-owned dichotomy among the for-profit clinics. The second binary variable representing ownership structure, NFP, represents the not-for-profit clinics. The coefficients of these two variables, then, will measure the quality-of-care differences between these two ownership structures and the for-profit corporate-held clinics.29
Table 1 provides variable names, definitions, and sample means for all variables included in our model. Means are reported for the overall sample and the subsamples represented by the three different ownership categories.
6. Data and estimation results
Our sample is drawn from a cross-section of individual dialysis patients. Data on these patients are collected and maintained by the USRDS, which receives its funding from HCFA.30 The sample for this study was drawn from two separate files within the USRDS. First, the Case Mix Adequacy file contains 4838 observations on 170 variables pertaining to a sample of individual patients undergoing hemodialysis in 1992. Second, the Facility file contains 23,827 observations on 160 variables pertaining to all dialysis clinics annually from 1972 to present. There is one observation for each clinic each year in this file. Due to our need to match patients to clinics, we limit our sample to those clinics operating in 1992 and the patients dialyzing at those clinics in that year. These restrictions, along with some missing data and invalid observations (e.g. a negative number for a patient’s age), result in a sample size of 2389 observations for this study.
Given this sample and model specification, two tests of alternative functional forms were conducted. First, we fit both linear and log-linear functions to the data. The linear form proved superior in terms of both goodness of fit and overall t-values. Second, we estimated both a linear model in which the two binary variables representing organizational structure shift the intercept only and a fully interactive model in which these variables shift both the intercept and all slope coefficients. The qualitative results obtained are robust across these
29Data on dialysis clinics are maintained by the United States Renal Data System (USRDS). This organization
taxonomizes non-governmental clinics by ownership structure according to the following eight categories: In-dividual For Profit; Partnership For Profit; Corporation For Profit; Other For Profit; InIn-dividual Not For Profit; Partnership Not For Profit; Corporation Not For Profit; and Other Not For Profit. The first two categories are taken here to represent ‘physician-owned, for-profit clinics.’ The next two are labeled ‘corporate, for-profit’; and the last four are our ‘not-for-profit clinics.’ We excluded from our sample all government facilities.
30Interpretation and reporting of these data are the responsibility of the authors and should not be seen as an
two alternative specifications. Therefore, due to the complexity of the latter formulation, we report here the linear model only.31
In addition, two econometric issues warrant attention. First, because our sample contains 2389 individual patients but only 292 separate dialysis clinics and several of our indepen-dent variables vary by clinics, not by individuals, we encounter the ‘Moulton problem’ in calculating the standard errors of our coefficient estimates.32 That is, due to the clustering of observation by facility, uncorrected standard errors are biased downward. To correct this bias, we utilized the Huber/White approach incorporated in the STATA software package to obtain robust estimates of the standard errors.
Second, due to the potential endogeneity of the KUF variable (see footnote 27), our own-ership variables may exert both direct effects (which will be reflected in the coefficients of their respective variables) and indirect effects (which may be contained within the coeffi-cient of the KUF variable). A simple approach to investigate whether indirect effects are important is to re-estimate the regression without the KUF variable. If the results are not substantially affected by excluding this variable, then indirect effects can be presumed to be unimportant. Therefore, we estimate the model both with (Model 1) and without (Model 2) the KUF variable.
Finally, a Ramsey RESET test was performed to check the model for misspecification.33 The calculated F-statistic for this test was 1.21, which is insignificant at standard levels of acceptance. Thus, no evidence of significant misspecification (from excluded variables, functional form, or endogeneity) was found.
Models 1 and 2 were estimated with OLS, and the results of that estimation are reported in Table 2. The first thing we note is that exclusion of the KUF variable changes the coefficients of the two ownership variables — for-profit, physician owned, PO, and not-for-profit, NFP — by only a small amount. It does not alter the signs or significance of either of these coefficients; nor does it alter the signs or significance of any of the remaining coefficients. Thus, we conclude that any indirect effects of ownership structure that operate through selection of the KUF variable are not particularly large. Due to this result and the fact that Models 1 and 2 yield qualitatively identical results, we focus the remainder of our discussion on Model 1 only. Due to the consistency of our results, everything we say about that model applies to Model 2 as well.
Examining Model 1, we find that all coefficient estimates for which an hypothesis was expressed attain the expected sign. Moreover, fourteen of the seventeen coefficient estimates are significant at the 0.05 level or better. The R2, while not large, indicates a reasonable level of explanatory power for individual patient cross-sectional data. Therefore, we conclude that the empirical model performs relatively well overall.
Turning to the individual coefficient estimates, we find that larger (both heavier and taller) patients receive longer prescribed running times. Older patients receive shorter times, and males receive longer times. Neither diabetes nor hypertension result in significantly different prescribed running times. The coefficient estimates attached to the blood flow rate and
31Estimation results for the fully interactive specification may be obtained from the authors upon request. 32See Moulton (1986). This problem and its solution were pointed out by an extremely patient and helpful referee,
to whom we are grateful.
Table 2
Estimation resultsa
Independent variables Model 1b Model 2c
Coefficient t-Statisticd Coefficient t-Statisticd
INTERCEPT 508.260 12.61∗ 561.983 13.88∗
WEIGHT 0.431 6.25∗ 0.434 6.13∗
HEIGHT 17.516 2.41∗∗ 18.357 2.51∗∗
AGE −1.143 −8.10∗ −1.163 −7.95∗
MALE 15.876 2.88∗ 15.143 2.69∗
DIAB 2.132 0.35 1.277 0.20
HYPER 0.243 0.04 −1.176 −0.18
BFR −0.113 −3.14∗ −0.340 −10.62∗
KUF −1.598 −13.20∗ – –
A1 20.021 2.71∗ 17.221 2.30∗∗
A2 4.959 0.73 6.837 0.99
STATIONS 1.040 4.34∗ 0.918 3.73∗
R1 −21.385 −3.52∗ −27.494 −4.43∗
R2 −42.869 −5.90∗ −45.976 −6.18∗
R3 −44.590 −5.70∗ −70.529 −9.02∗
PO 16.617 1.98∗∗ 21.243 2.36∗∗
NFP 15.381 3.00∗ 12.318 2.34∗∗
aDependent variable=LRUN. bn=2389, R2=0.22, F=44.34. cn=2389, R2=0.17, F=30.29. dCorrected for bias due to clustering.
∗Significant at the 1% level. ∗∗Significant at the 5% level.
KUF variables both achieve the anticipated negative sign and are significant at the 0.01 level. Fistulas significantly increase running times relative to the excluded access types, while gortex graphs do not significantly influence treatment duration. Larger clinics tend to prescribe significantly longer treatment durations. And the coefficients of all three regional dummies are negative, fairly large, and significant at the 0.01 level, indicating lower running times relative to the eastern region. This last result is somewhat surprising and may deserve further investigation.
provide a significantly higher quality of care than the corporate-owned, for-profit clinics, ceteris paribus.34
7. Conclusions
Recent federal legislation proscribes certain patterns of ownership in the health care sector. In some instances, the intent of such legislation is to reduce costs by eliminating in-centives for unnecessary and/or overpriced diagnostic services. In other instances, however, these laws are intended to improve the quality of care delivered by structurally separating the profit motive (the residual claimant) from the decision makers who determine the qual-ity of the service provided. This latter motive appears to be the principal objective of some previous proposals to proscribe physician ownership of dialysis clinics.
Our findings suggest that this proposed legislation is unlikely to achieve its intended effect. In fact, our results indicate that a legal proscription on physician ownership of dialysis clinics would have the perverse effect of reducing the quality of care delivered as the for-profit sector is driven to increase the share of corporate-owned facilities. Therefore, other policy avenues, such as encouragement of the not-for-profit ownership structure or adoption of a more efficient reimbursement mechanism that ties fees received by dialysis clinics to prescribed treatment durations, would appear to offer a much more promising avenue for improving the quality of care delivered in this industry.35
Acknowledgements
The authors gratefully acknowledge many helpful comments provided by Randy Beard, Steve Caudill, Charles Diskin, Patricia Duffy, Bob Ekelund, and John Jackson. In addition, some very constructive comments were provided by two anonymous referees. The usual caveat applies.
References
Babcock, C.R., 1993. Physician Ownership Tied to Referrals for Services. Washington Post, 21 April 1993, p. A3. Barnett, A.H., Beard, T.R., Kaserman, D.L., 1993. Inefficient pricing can kill: the case of dialysis industry
regulation. Southern Economic Journal 60 (2), 393–404.
Danzon, P.M., 1982. Economic Factors in the Use of Laboratory Tests by Office-Based Physicians. Rand Report R-2525-1HCFA, August 1982.
Eichenwald, K., 1995. Death and Deficiency in Kidney Treatment. New York Times, 4 December 1995, pp. A1, B6–B7.
34Held et al. (1991) find that patients dialyzed at for-profit clinics receive significantly shorter treatment
du-rations than patients dialyzed at not-for-profit clinics. Their analysis, however, does not distinguish between physician-owned and corporate-owned for-profit facilities. Our results indicate that, while their result is correct for the corporate-owned clinics, it does not hold for the physician-owned facilities.
Griffiths, R.I., Powe, N.R., Gaskin, D.J., Anderson, G.F., deLissovoy, G.V., Whelton, P.K., 1994. The production of dialysis by for-profit versus not-for-profit freestanding renal dialysis facilities. Health Services Research 29 (4), 473–487.
Gujarati, D.N., 1988. Basic Econometrics, 2nd Edition. McGraw-Hill, New York, 1988.
Held, P.J., Pauly, M.V., 1983. Competition and efficiency in end stage renal disease program. Journal of Health Economics 2 (1), 95–118.
Held, P.J., Pauly, M.V., Diamond, L., 1987. Survival analysis of patients undergoing dialysis. Journal of the American Medical Association 257 (5), 645–650.
Held, P.J., Levin, N.W., Bovbjerg, R.R., Pauly, M.V., Diamond, L.H., 1991. Mortality and duration of hemodialysis treatment. Journal of the American Medical Association 265 (7), 871–875.
Hillman, B.J., Joseph, C.A., Mabry, M.R., Sunshine, J.H., Kennedy, S.D., Monica, N., 1990. Frequency and costs of diagnostic imaging in office practice — a comparison of self-referring and radiologist — referring physicians. New England Journal of Medicine 323 (23), 1604–1608.
Hornberger, J.C., Garber, A.M., Jeffery, J.R., 1997. Mortality, hospital admissions, and medical costs of end-stage renal disease in the United States and Manitoba, Canada. Medical Care 35 (7), 686–700.
Kaserman, D.L., 1992. Reimbursement rates and quality of care in the dialysis industry: a policy discussion. Issues in Law and Medicine 8 (1), 81–102.
Mitchell, J.M., Scott, E., 1992. Evidence on complex structures of physician joint ventures. Yale Journal on Regulation 9 (2), 489–520.
Mitchell, J.M., Sass, T.R., 1995. Physician ownership of ancillary services: indirect demand inducement or quality assurance? Journal of Health Economics 14 (3), 263–289.
Moulton, B.R., 1986. Random group effects and the precision of regression estimates. Journal of Econometrics 32, 385–397.
Relman, A.S., 1992. Self-referral — what’s at stake? New England Journal of Medicine 327 (21), 1522–1524. Schlesinger, M., Gray, B., Bradley, E., 1996. Charity and community: the role of nonprofit ownership in a managed
care system. Journal of Health Politics, Policy and Law 21 (4), 697–751.
Scott, E., Mitchell, J.M., 1994. Ownership of clinical laboratories by referring physicians: effects on utilization, charges, and profitability. Medical Care 32 (2), 164–174.
Sloan, F.A., Vraciu, R.A., 1983. Investor-owned and not-for-profit hospitals: addressing some issues. Health Affairs 2 (1), 25–37.
United States Department of Health and Human Services, 1990. Health Care Financing Research Report: End Stage Renal Disease, 1988. HCFA Publication No. 03299, Baltimore, September 1990.