Biochemical Systematics and Ecology 28 (2000) 779}791
Discrimination and identi
"
cation of coastal
Douglas-
"
r clones using needle
#
avonoid
"
ngerprints
Shiv Shankhar Kaundun
!
,
"
,
*
, Philippe Lebreton
"
, Alain Bailly
#
!De&partement de Botanique, Home&opathie et Pharmacognosie, Universite&Claude Bernard-Lyon I, Faculte& dePharmacie, 8 avenue Rockefeller, 69373 Lyon ce&dex 08, France
"Laboratoire de Biochimie Ve&ge&tale, Universite& Claude Bernard-Lyon I, 43 Bd du 11 Novembre 1918, 69622 Villeurbanne, France
#AFOCELCentre-Ouest, Les Vaseix, 87430 Verneuil-sur-Vienne, France Received 30 August 1999; accepted 26 October 1999
Abstract
This paper describes a method for discriminating and identifying 10 successful Douglas-"r (Pseudotsuga menziesii var.menziesii) clones using foliar #avonoids. All the 101 individuals analyzed by high performance liquid chromatography contained two proanthocyanidins:
prodelphinidin and procyanidin and six#avonols: myricetin, quercetin, larycitrin, kaempferol,
isorhamnetin and syringetin, but in di!erent proportions. The experimental protocol used was
very reproducible since the variation coe$cients for each #avonoid did not exceed 9%.
Submission of the #avonoid data to multivariate discriminant analysis allowed excellent
discrimination of the 10 clones with 89% of the individuals being well-grouped. Then a clonal
bank was established in which the"ngerprint of each clone is de"ned by its position in the
multidimensional space of the discriminant analysis. The clonal identity of several unknown
individuals was determined with success by projecting their#avonoid data in a subsequent
discriminant analysis. ( 2000 Elsevier Science Ltd. All rights reserved.
Keywords: Pseudotsuga menziesiivar.menziesii; Flavonoids; Genetic variability; Clonal discrimination
*Corresponding author: Present address: National Research Institute of Vegetables, Ornamental Plants and Tea, 2769 Kanaya, Kanaya-cho, Haibara-gun, 428-8501 Shizuoka, Japan. Fax:#81-547-46-2169.
E-mail address:[email protected] (S.S. Kaundun)
1. Introduction
Douglas-"r,Pseudotsuga menziesii (Mirb.) Franco was discovered on Vancouver Island some 200 years ago and introduced into Europe in the middle of the 19th century. In its natural range, it can be encountered on Northwestern America, from the 19th parallel in Mexico to the 55th parallel in Canada and from the Paci"c Coast to the Rockies where it reaches 3000 m in altitude (Vidakovic, 1991). Two geographi-cally well-di!erentiated varieties, var.glaucaor interior Douglas-"r and var.menziesii
or coastal Douglas-"r, separated by large morpho-anatomical (Chen et al., 1986) and biochemical (Von Rudlo!, 1975; Li and Adams, 1989) di!erences have been fully recognized. Because of its rapid growth, good wood quality and its resistance to major insect pests, coastal Douglas-"r has been intensively cultivated in Europe. In France, it has risen to the"rst place in a!orestation at the expense of numerous indigenous conifers. In this country, improvement programs of Douglas-"r started some 30 years ago by setting provenance trials in diverse ecological conditions with populations representative of its natural range. From the results of several experimental trials, the best provenances and among them the most vigorous and healthy individuals were selected for seed orchards (Bastien et al., 1986). At the present time, local seed production is, however, insu$cient to meet the increasing demand for Douglas-"r in a!orestation (Michaud, 1992). Moreover, progeny tests have revealed that the herita-bility of such important traits as vigor and polycyclism were low in the F1 generation (Michaud et al., 1992). For these reasons, clonal orchards were established and bulk vegetative propagation of successful clones were undertaken. Such intensive clonal silviculture necessitates a method to verify clonal identity and to discourage the fraudulent commercialization of polyclonal varieties.
Needle#avonoids are robust biochemical markers that have proved their e$ciency at the populational, speci"c and higher taxonomic levels (Niemann, 1988; Lebreton, 1995; Kaundun et al., 1997; Kaundun et al., 1998a,b). Segregation data have shown that these secondary plant metabolites are synthesized under strict genetic control (Yazdani and Lebreton, 1991; Forkmann, 1994). Needle #avonoid composition was found to vary negligibly when individuals from one clone were grown under di!erent environmental conditions, as compared to the large di!erences noted be-tween di!erent clones originating from one site (Lebreton et al., 1990). In the same way, no signi"cant di!erences in#avonoid metabolism were observed with the age of a tree, or the position/orientation of a branch within a tree (Idrissi-Hassani, 1985; Lauranson, 1989). Moreover, #avonoids exist in many structural forms and are relatively stable, easy to detect and measure (Harborne, 1975). To our knowledge, they have not yet been applied to the clonal discrimination of conifers. The objective of this paper is to describe a method using needle #avonoids, in an attempt to discriminate and identify Douglas-"r clones. Special attention has been paid to the reproducibility of the experimental protocol and to the mathematical tools used. We have started by investigating the extent to which needle#avonoids were capable of separating the 10 studied clones. Then we have tried to verify the identity of several individuals after establishing a polyphenolic "ngerprint bank for di!erent clones.
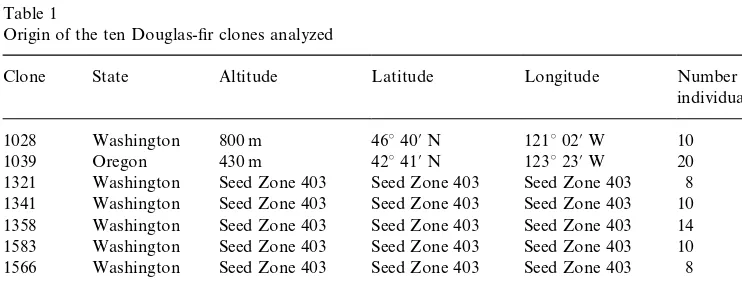
Table 1
Origin of the ten Douglas-"r clones analyzed
Clone State Altitude Latitude Longitude Number of
individuals
1028 Washington 800 m 46340@N 121302@W 10
1039 Oregon 430 m 42341@N 123323@W 20
1321 Washington Seed Zone 403 Seed Zone 403 Seed Zone 403 8 1341 Washington Seed Zone 403 Seed Zone 403 Seed Zone 403 10 1358 Washington Seed Zone 403 Seed Zone 403 Seed Zone 403 14 1583 Washington Seed Zone 403 Seed Zone 403 Seed Zone 403 10 1566 Washington Seed Zone 403 Seed Zone 403 Seed Zone 403 8
80 324 Oregon 900 M 45300@N 122300@W 9
80 377 Oregon 900 M 45300@N 122300@W 7
81 455 Washington 450 M 48331@N 121309@W 5 2. Materials and methods
2.1. Plant materials
Sprigs from 10 coastal Douglas-"r clones (101 individuals in all), 13 years old, were harvested from an experimental trial of the AFOCEL (Association Fore(t-Cellulose) in October 1994. The stand is found at Ronno (45318@, 05319@), located in the` Haut-Beaujolaisa, France. Sprigs were collected from 5 to 20 individuals of each clone. The clones originated from either Washington or Oregon State in the USA (Table 1). In addition, one individual used to test the reproducibility of the experimental protocol and which do not belong to any of the 10 clones, originates from the British Columbia State (population 43 for IUFRO).
2.2. Phytochemical analyses
Two grams of pulverized air-dried needles were submitted for hot acidic hydrolysis (160 ml HCl 2 N) in a water bath for 40 min. This acidic treatment generated anthocyanidins from homologous proanthocyanidins, and #avonol aglycones from corresponding#avonol glycosides. After cooling, part of the hydrolysate was kept for relative anthocyanidin analyses by HPLC while the rest was extracted three times by diethylether (60#60#40 ml). After extraction, the ethereal solutions containing the
#avonol aglycones were pooled and then evaporated, and the residue was redissolved in 10 ml ethanol. After chelation with AlCl
3, the#avonols were measured at 425 nm and expressed in quantitative units (mg/g as quercetin equivalents). In the resulting aqueous phase, total anthocyanidins were measured at 525 nm and expressed in arbitrary units (mg/g as procyanidin equivalents).
The structure of each eluted#avonoid was determined by its HPLC-UV spectrum, its chemical behavior with classical reagents (Mabry et al., 1970; Markham, 1982) and co-chromatography using reference compounds.
The relative amount of each #avonoid was quanti"ed by HPLC on a Micro-Bondapak C18 column. The anthocyanidin fraction was detected at 546 nm and eluted by a ternary mixture of H
2O/MeOH/AcOH (60/30/10) at a #ow rate of 1.0 ml/min. Flavonol aglycones, detected at 365 nm, were eluted with the same ternary mixture of H
2O/MeOH/AcOH, but in the proportion of 60/40/5 and a#ow rate of 1.5 ml/min. On the HPLC chromatogram the peak height of each #avonoid was expressed as a percentage of the sum of the heights of all#avonoid peaks.
2.3. Data analyses
Principal component analysis and discriminant analysis were carried out using the STAT-ITCF version 5.0 statistical software (ITCF, Paris).
3. Results
Two proanthocyanidins and six#avonols were detected and measured in all 101 trees (Table 2). Total proanthocyanidin concentration varied from 5.2 to 8.4 mg/g and was composed of prodelphinidin (67.3$4.2%) and procyanidin (32.7$4.2%). The
#avonol fraction ranged from 2.1 to 3.0 mg/g. It was mainly dominated by kaempferol (35.9%) and quercetin (34.4%); myricetin averaged 13.7%, isorhamnetin 9.8% while larycitrin and syringetin, present in small quantities, totaled less than 7%. The chemical structures of the needle#avonoids detected in the Douglas-"r clones were identical to those previously found in Douglas-"r trees from di!erent origins (Leb-reton et al., 1980; Niemann and van Genderen, 1980; Kaundun et al., 1998a).
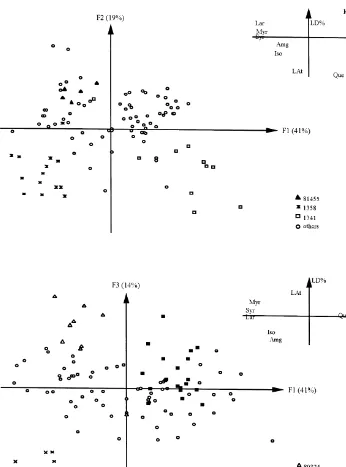
Before using the above #avonoid traits as markers in Douglas-"r clones, the reproducibility of the experimental protocol was tested. One Douglas-"r tree was analyzed 12 times on di!erent days with the complete set of analyses described in Materials and Methods section (Table 3). The variation coe$cients for total proan-thocyanidin and #avonol concentrations as well as relative proanthocyanidin and major #avonols contents did not exceed 6%. Minor #avonols were a!ected by variation coe$cients reaching 9%. The low variation coe$cients for all#avonoids indicated that the protocol used was very reproducible. Thus, the #avonoid data collected here could legitimately be used in an attempt to characterize the Douglas-"r clones. In the"rst instance, principal component analysis (which searches for natural a$nity between individuals) was applied on all trees and#avonoid variables. The"rst three factor scores explained 41, 19 and 14% of total variation. On theF
1]F2plane, clones 81 455, 1358 and 1341 were relatively well-grouped and separated from the others, while plane F
1]F3 individualized clones 80 324, 80 377 and 1039 (Fig. 1). Three other planes,F
1]F4, F2]F3 andF3]F5(not shown here) grouped clones 1563, 1566 and 1028, respectively. This suggests that individuals belonging to the same clone possessed the same #avonoid pattern. We were therefore allowed to use the
Table 2
Proanthocyanidin and#avonol composition of the 10 Douglas-"r clones analyzed
Clone Lat mg/g LD% LC% Amg mg/g Myr% Que% Lar% Kpf% Iso% Syr%
1028 5.8$1.0 69.3$2.4 30.7$2.4 2.6$0.2 12.2$1.5 35.3$2.1 3.1$0.4 38.1$3.1 9.3$0.9 2.0$0.4
Table 3
Reproducibility of the experimental protocol used: analysis of one Douglas-"r tree (originating from the state of British Columbia) 12 times
Sample Lat mg/g LD % LC % Amg mg/g Myr % Que % Lar % Kpf % Iso % Syr %
!The percentage in brackets is the coe$cient of variation. (LAt"total proanthocyanidins, LD"prodelphinidin, LC"procyanidin, Amg"total#avonol aglycones, Myr"myricetin, Que"quercetin, Lar"larycitrin, Kpf"kaempferol, Iso"isorhamnetin, Syr"syringetin).
Fig. 1. Principal planes (F
1]F2) and (F1]F3) of the PCA based on 9#avonoid variables and 101
individuals; corresponding correlation diagrams (LAt"total proanthocyanidins, LD%"prodelphinidin, Amg"total#avonol aglycones, Myr"myricetin, Que"quercetin, Lar"larycitrin, Kpf"kaempferol, Iso"isorhamnetin, Syr"syringetin).*For clarity, the clones which were not grouped on one plane were indistinctly represented by an empty circle.
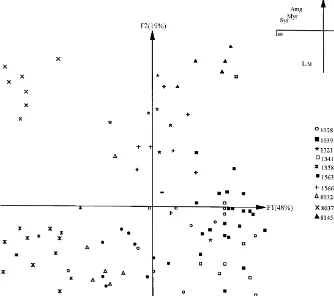
Fig. 2. Principal plane (F
1]F2) of the discriminant analysis based on 9#avonoid variables and 101
individuals; corresponding correlation diagram (LAt"total proanthocyanidins, LD%"prodelphinidin, Amg"total#avonol aglycones, Myr"myricetin, Que"quercetin, Lar"larycitrin, Kpf"kaempferol, Iso"isorhamnetin, Syr"syringetin).
the"rst factorial plane of the discriminant analysis which explained 67% (F
1"48% andF
2"19%) of the total inertia. The"rst axis was explained by kaempferol with a negative sign of myricetin, larycitrin, isorhamnetin and syringetin, all four present in small quantities. Factor 2 was mainly due to relative quercetin and prodelphinidin contents, as well as total proanthocyanidin concentrations. On theF
Table 4
Percentage of well-grouped individuals for each of the 10 clones in the discriminant analysis
Clone 1028 1039! 1321 1341 1358 1563 1566 80 324 80 377 81 455 Percentage individuals well grouped
1028 (n"10) 8 1 1 80
1039 (n"20) 18 1 1 90
1321 (n"8) 1 6 1 75
1341 (n"10) 1 1 8 80
1358 (n"14) 14 100
1563 (n"10) 9 1 90
1566 (n"8) 1 7 88
80 324 (n"9) 1 8 89
80 377 (n"7) 7 100
81 455 (n"5) 5 100
!In clone 1039, 18 out of 20 individuals were well-classi"ed, 1 was attached to clone 1321 and the other to clone 1566.
S.S.
Kaundun
et
al.
/
Biochemical
Systematics
and
Ecology
28
(2000)
779
}
791
Table 5
Paired Mahalanobis distances between the 10 clones
Clone 1028 1039 1321 1341 1358 1563 1566 80 324 80 377
1028
1039 2.3181
1321 2.3603 1.9321
1341 2.7664 2.4244 3.2990
1358 2.9347 2.9037 2.7738 3.1210
1563 1.8474 2.4605 2.7592 2.6838 2.8596
1566 2.2183 2.1638 1.9906 2.2511 3.0694 1.9350
80 324 3.0199 2.9384 3.0383 3.2967 2.7239 2.3871 2.4335
80 377 3.7705 3.7000 3.0226 3.9564 3.4745 3.0986 2.9488 4.0248
81 455 3.9725 3.8168 3.0168 3.7560 4.0790 4.2645 3.1601 4.0094 4.6019
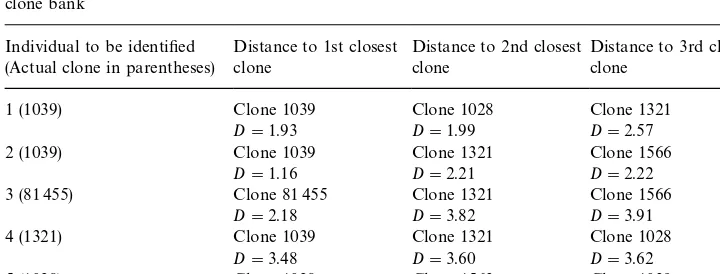
Table 6
Mahalanobis distances (D) between the individuals to be identi"ed and the"rst three closest clones in the clone bank
Individual to be identi"ed (Actual clone in parentheses)
1 (1039) Clone 1039 Clone 1028 Clone 1321
D"1.93 D"1.99 D"2.57
2 (1039) Clone 1039 Clone 1321 Clone 1566
D"1.16 D"2.21 D"2.22
3 (81 455) Clone 81 455 Clone 1321 Clone 1566
D"2.18 D"3.82 D"3.91
4 (1321) Clone 1039 Clone 1321 Clone 1028
D"3.48 D"3.60 D"3.62
5 (1028) Clone 1028 Clone 1563 Clone 1039
D"1.82 D"2.92 D"3.44
discriminated whereas clone 1321 was relatively more heterogeneous. Mahalanobis values given in Table 5 expressed the distances separating the 10 clones in the discriminant analysis. The greatest distance was observed between clones 80 377 and 81 455, whereas 1028 and 1563 were the closest clones.
The individuals were attached to the clone to which they were closest. With the exception of individual 4, all the other trees were successfully identi"ed (Table 6).
4. Discussion
The study was based on needle#avonoids in view of proposing a method to verify the identity of Douglas-"r clones. The experimental protocol used was quite repro-ducible. Indeed, the variation coe$cients associated with the#avonoid traits did not exceed 9% in any case. Two proanthocyanidins and six#avonols were detected and measured in all 101 samples analyzed. The#avonoid patterns were relatively constant among individuals of the same clone. At the same time, interclonal variability was su$ciently high to allow good discrimination of the ten clones.
Multivariate discriminant analysis was used to de"ne #avonoid "ngerprints of each clone and for identifying unknown individuals. Allocation of an individual to a clone in a discriminant analysis is based on the multidimensional distance separat-ing the individual to the center of gravity of the clones in the clone bank. Thus, the greater the number of individuals used to de"ne the clonal"ngerprints, the higher are the chances of allocating an individual to its proper clone. However, for practical reasons, an optimum number of individuals should be determined for each clone; the higher the intraclonal variability the larger the number of individuals. In addition, when an individual to be identi"ed is attached to a clone, this does not necessarily imply that it belongs to that clone, but rather that it does not belong to the other clones.
The geographical variability of coastal Douglas-"r has recently been investigated with needle#avonoids (Kaundun et al., 1998a). The amplitudes of variations for all
#avonoid traits in the latter study were much higher than that observed here. This suggests that the 10 studied clones were not representative of the#avonoid pattern-ings of the species and that further clones could be discriminated and introduced simultaneously in the clone bank.
Clones 80 377 and 80 324, which originated from the same Oregon population, were completely distinguished from one another (Fig. 2). This is an interesting"nding since the most promising individuals selected for a!orestation in a particular region were found to originate from a limited zone of the species range (Michaud et al., 1988). On the other hand, two geographically distant clones, for instance clones 1039 and 1341, were relatively close to each other. This observation supports several morpho-anatomical (Chen et al., 1986) and biochemical (Zavarin and Snagberg, 1975; Yeh and O'Malley, 1980; Li and Adams, 1989) studies which showed that the intrapopulational variability of coastal Douglas-"r as much more important than its interpopulational variability.
As shown on the correlation diagram of Fig. 2, interclonal variability in Douglas-"r was biogenetically structured. Indeed, axis 1 explained the metabolic balance: B-ring monohydroxylation (kaempferol) against B-ring trihydroxylation and/or methylation (myricetin, larycitrin, syringetin and isorhamnetin), whereas axis 2 was negatively
de"ned by B-ring dihydroxylation (quercetin), as well as tannin concentration (total
proanthocyanidin and prodelphinidin contents). In this respect, the#avonol metabol-ism in clones 1358 and 80 377 was more directed towards B-ring trihydroxylation and/or methylation and less so regarding B-ring monohydroxylation compared to clones 1028 and 1039. The two former clones were distinguishable upon their degree of tannin synthesis; clones 1358 and 80 377 being, respectively, characterized by high and low levels of tannin.
The method of clonal identi"cation has been established upon 13- year old trees. To become a more interesting tool it should be tested on two-year old nursery samples, in order to avoid errors in a!orestation. This cheap, rapid and reproducible method could most probably be extended to other conifers and may constitute an important tool in monitoring clonal bank management activities.
Acknowledgements
The authors would like to express their gratitude to Mr. T. Fauconnier and Mr. C. Julien (AFOCEL, Sud-Est) for their help in sample collection and to Mr. J. Reynaud (University of Lyon), Mr. J.C. Bastien (INRA, Orleans) and Mr. B. Fady (INRA, Bormes-les-Mimosas) for reviewing the manuscript. The"rst author was supported by a stipend from the`ReHgion Rho(ne-Alpesa, France.
References
Bastien, J.C., Roman-Amat, B., Michaud, D., 1986. Douglas. Rev. For. Fr. 38, 113}120.
Chen, Z.Y., Scagel, R.K., Maze, J., 1986. A study of the morphological variation inPseudotsuga menziesiiin southwestern British Columbia. Can. J. Bot. 64, 1654}1663.
Forkmann, G., 1994. Genetics of#avonoids. In: Harborne, J.B. (Ed.), The Flavonoids. Chapman & Hall, London, pp. 537}558.
Harborne, J.B., 1975. The biochemical systematics of#avonoids. In: Harborne, J.B., Mabry, T.J., Mabry, H. (Eds.), The Flavonoids. Chapman & Hall, London, pp. 1056}1095.
Idrissi-Hassani, M., 1985. Etude de la variabiliteH #avonique chez deux conife`res meHditerraneHens: le pin maritime:Pinus pinasterAit. et le geneHvrier thurife`res:Juniperus thuriferaL., Ph.D. Thesis. Faculty of Sciences, University of Lyon, France.
Kaundun, S.S., Fady, B., Lebreton, P., 1997. Genetic di!erences betweenPinus halepensis,Pinus brutiaand Pinus eldaricabased on needle#avonoids. Biochem. Syst. Ecol. 25, 553}562.
Kaundun, S.S., Lebreton, P., Bailly, A., 1998a. Needle#avonoid variation in coastal Douglas-"r (Pseudot-suga menziesiivar. menziesii) populations. Can. J. Bot. 76, 2076}2083.
Kaundun, S.S., Lebreton, P., Fady, B., 1998b. Geographical variability ofPinus halepensisMill. as revealed by foliar#avonoids. Biochem. Syst. Ecol. 26, 83}96.
Lauranson, J., 1989. Exploration de la diversiteH biochimique chez les conife`res: contribution a` l'eHtude de l'hybridationPinus uncinataRam. XPinus sylvestrisL., et a` la connaissance du complexe speHci"que Pinus nigraArn. Ph.D. Thesis. Faculty of Sciences, University of Lyon, France.
Lebreton, P., 1995. Genetics and biodiversity of#avonoids in conifers. In: Baradat, P., Adams, W.T., MuKller-Stark, G. (Eds.), Population Genetics and Genetic Conservation of Forest Trees. SPB Academic Publishing, Amsterdam, pp. 41}54.
Lebreton, P., Laracine-Pittet, C., Bayet, C., Lauranson, J., 1990. VariabiliteH pheHnolique et systeHmatique du Pin sylvestre. Pinus sylvestris L. Ann. Sci. For. 47, 117}130.
Lebreton, P., Thivend, S., Boutard, B., 1980. Distribution des proanthocyanidines chez les Gymnospermes. Plant. MeHd. PhytotheHr. 15, 105}129.
Li, P., Adams, W.T., 1989. Range-wide patterns of allozyme variation in Douglas-"r (Pseudotsuga menziesii). Can. J. For. Res. 19, 149}161.
Mabry, T.J., Markham, K.R., Thomas, M.S., 1970. The Systematic Identi"cation of Flavonoids. Springer, Berlin.
Markham, K.R., 1982. Techniques of Flavonoid Identi"cation. Academic Press, New York.
Michaud, D., 1992. Comportement de Douglas issus de peuplements franc7ais classeHs. Afocel,
Informations-Fore(t, Fasc. 438, 237}252.
Michaud, D., Bouvet, A., Gousseau, C., Besse, A., 1992. Analyse d'une expeHrimentation multistationelle de descendances maternelles de Douglas issues de peuplements franc7ais classeHs. Annales de Recherches
Sylvicoles, Afocel, pp. 89}124.
Michaud, D., Guinaudeau, F., Bouvet, A., 1988. Aspects de la variabiliteH des provenances de Douglas de l'ouest de l'Etat de Washington. Annales de Recherches Sylvicoles, Afocel, 151}191.
Niemann, G.J., 1988. Distribution and evolution of the#avonoids in gymnosperms. In: Harborne, J.B. (Ed.), The Flavonoids. Advances in Research since 1980. Chapman & Hall, London, pp. 469}478. Niemann, G.J., van Genderen, H.H., 1980. Chemical relationships between Pinaceae. Biochem. Syst. Ecol.
8, 237}240.
Vidakovic, M., 1991. Conifers Morphology and Variation. Gra"cki Zavod Hrvatske, Zagreb.
Von Rudlo!, E., 1975. Volatile Leaf oil analysis in chemosystematic studies of North American conifers. Biochem. Syst. Ecol. 2, 131}167.
Yazdani, R., Lebreton, P., 1991. Inheritance pattern of the#avonic compounds in Scots Pine (Pinus sylvestrisL.). Silvae Genet 40, 57}59.
Yeh, F.C., O'Malley, D., 1980. Enzyme variations in natural populations of Douglas-"r (Pseudotsuga menziesii(Mirb.) Franco from British Columbia. I. Genetic variation patterns in coastal populations. Silvae Genet. 29, 83}92.
Zavarin, E., Snagberg, K., 1975.Pseudosuga menziesiichemical races of California and Oregon. Biochem. Syst. Ecol. 4, 121}129.