Regional Brain Activity in Depressed Patients
Andrew M. Speer, Timothy A. Kimbrell, Eric M. Wassermann, Jennifer D. Repella,
Mark W. Willis, Peter Herscovitch, and Robert M. Post
Background:
High (10 –20 Hz) and low frequency (1–5
Hz) repetitive transcranial magnetic stimulation (rTMS)
have been explored for possible therapeutic effects in the
treatment of neuropsychiatric disorders. As part of a
double-blind, placebo-controlled, crossover study
evalu-ating the antidepressant effect of daily rTMS over the left
prefrontal cortex, we evaluated changes in absolute
re-gional cerebral blood flow (rCBF) after treatment with
1-and 20-Hz rTMS. Based on preclinical data, we postulated
that high frequency rTMS would increase and low
fre-quency rTMS would decrease flow in frontal and related
subcortical circuits.
Methods:
Ten medication-free, adult patients with major
depression (eight unipolar and two bipolar) were serially
imaged using
15O water and positron emission
tomogra-phy to measure rCBF. Each patient was scanned at
baseline and 72 hours after 10 daily treatments with 20-Hz
rTMS and 10 daily treatments with 1 Hz rTMS given in a
randomized order. TMS was administered over the left
prefrontal cortex at 100% of motor threshold (MT).
Significant changes in rCBF from pretreatment baseline
were determined by paired
t
test.
Results:
Twenty-hertz rTMS over the left prefrontal cortex
was associated only with increases in rCBF. Significant
increases in rCBF across the group of all 10 patients were
located in the prefrontal cortex (L
.
R), the cingulate
gyrus (L
..
R), and the left amygdala, as well as bilateral
insula, basal ganglia, uncus, hippocampus,
parahip-pocampus, thalamus, and cerebellum. In contrast, 1-Hz
rTMS was associated only with decreases in rCBF.
Sig-nificant decreases in flow were noted in small areas of the
right prefrontal cortex, left medial temporal cortex, left
basal ganglia, and left amygdala. The changes in mood
following the two rTMS frequencies were inversely related
(r
5 2
.78, p
,
.005, n
5
10) such that individuals who
improved with one frequency worsened with the other.
Conclusions:
These data indicate that 2 weeks of daily
20-Hz rTMS over the left prefrontal cortex at 100% MT
induce persistent increases in rCBF in bilateral frontal,
limbic, and paralimbic regions implicated in depression,
whereas 1-Hz rTMS produces more circumscribed
de-creases (including in the left amygdala). These data
demonstrate frequency-dependent, opposite effects of high
and low frequency rTMS on local and distant regional
brain activity that may have important implications for
clinical therapeutics in various neuropsychiatric
disor-ders.
Biol Psychiatry 2000;48:1133–1141 ©
2000
Soci-ety of Biological Psychiatry
Key Words:
Transcranial magnetic stimulation, regional
cerebral blood flow, depressed, high frequency (20 Hz),
low frequency (1 Hz), positron emission tomography
Introduction
R
epetitive transcranial magnetic stimulation (rTMS) is
a neurologic and psychiatric research tool that has
gained notable attention in recent years for its potential
application as a treatment for several neuropsychiatric
illnesses. It involves the use of a wire coil through which
brief pulses of electrical current are passed, leading to the
generation of magnetic fields that pass through the skull
(Barker et al 1985, 1987). Changes in neuronal activity in
the brain can thus be achieved when the coil is placed
close to the scalp. A figure eight coil allows for relatively
focal stimulation of the brain such that the hand or foot
area of the motor cortex can be selectively activated
(Cohen et al 1990; Wassermann et al 1992; Wilson et al
1993).
Transcranial magnetic stimulation results in a variety of
effects depending on the target area and stimulation
parameters, such as intensity and frequency. When applied
over the primary motor area, single-pulse TMS evokes
compound action potentials in contralateral muscles
(Rothwell et al 1991) followed by inhibition of cortical
motor output. Over the occipital cortex, single TMS pulses
can produce phosphenes (Marg and Rudiak 1994) and can
interrupt the perception of briefly presented visual stimuli
From Biological Psychiatry Branch, National Institute of Mental Health (AMS, JDR, MWW, RMP), National Institute of Neurologic Disorders and Stroke (EMW), and Positron Emission Tomography Department, National Institutes of Health Clinical Center (PH), Bethesda, Maryland, and VA Medical Center, North Little Rock, Arkansas (TAK).
Address reprint requests to Robert M. Post, M.D., NIH/NIMH/BPB, 10 Center Drive, Room 3N212, Bethesda MD 20895.
Received February 17, 2000; revised September 13, 2000; accepted September 20, 2000.
(Amassian et al 1989). Repetitive transcranial magnetic
stimulation applied at high intensities near or over the
motor area for speech in the dominant hemisphere
pro-duces speech arrest (Epstein 1998; Epstein et al 1996;
Pascual-Leone et al 1991). Repetitive transcranial
mag-netic stimulation delivered over the motor cortex appears
to have different effects on cortical excitability depending
on the pulse frequency. Frequencies in the range of 5–20
Hz produce enhanced cortical responses, or facilitation,
which is demonstrated by a decreased motor-evoked
potential (MEP) threshold (Berardelli et al 1998;
Pascual-Leone et al 1994). Repeated stimulation at frequencies of
about 1 Hz produces inhibition of subsequent cortical
responses (Chen et al 1997).
The initial application of high frequency (20 Hz) rTMS
over the left prefrontal cortex in depressed patients
re-sulted in promising findings (George et al 1995).
Subse-quent controlled studies of daily left prefrontal rTMS
(10 –20 Hz) have demonstrated significant clinical
im-provement in depressed patients (George et al 1997;
Pascual-Leone et al 1996). Investigators are currently
attempting to determine the parameter settings of intensity,
frequency, laterality, location (Klein et al 1999), and
duration of stimulation optimal for the antidepressant
effects of rTMS, with the intent of finding alternatives to
electroconvulsive therapy (ECT) for at least a subgroup of
patients (Grunhaus et al 2000). In contrast to ECT, rTMS
would have the advantage of not requiring anesthesia and
of not inducing a seizure with its associated memory loss,
and would allow better control of stimulus frequency and
location (Post et al 1999). Other studies have explored the
potential use of rTMS to alleviate the symptoms of
obsessive– compulsive disorder (Greenberg et al 1997),
schizophrenia (Feinsod et al 1998; Geller et al 1997;
Hoffman et al 1999), and posttraumatic stress disorder
(McCann et al 1998).
Investigators have used various brain imaging
proce-dures such as single photon emission computed
tomogra-phy, functional magnetic resonance imaging (fMRI), and
positron emission tomography (PET) to examine how
brain activity (as reflected by cerebral glucose metabolism
and blood flow) is altered by rTMS during or shortly after
stimulation. Increases and decreases in blood flow or
metabolism have been found (Bohning et al 1999; Fox et
al 1997; Kimbrell et al 1999; Paus et al 1997, 1998)
depending on location and frequency of rTMS stimulation.
For example, T.A. Kimbrell et al (unpublished data) found
that, relative to the increases observed with sham, 20 min
of active 1-Hz rTMS in normal subjects produced global
and regional decreases in cerebral glucose metabolism.
The study of the long-term effects of brain stimulation
at different frequencies has in part derived from studies
exploring the models of long-term potentiation (LTP) and
long-term depression (LTD; Li et al 1998; Malenka 1994,
1995), as well as the concepts of kindling and quenching
(Post et al 1997; Weiss et al 1997). These models of
neuroplasticity have provided evidence that long-term
changes in neuronal excitability (depression and
potentia-tion) can be achieved in vitro with low and high frequency
stimulation, respectively, in both hippocampal and
amyg-dala slices. Whether or not analogous changes in more
global measures of neuronal excitability can be achieved
with rTMS in vivo remains uncertain.
The possibility of achieving differential long-term
changes in brain activity with rTMS is clinically
impor-tant, as this may contribute to its potential therapeutic
value in neuropsychiatric disorders associated with
cere-bral hyper- or hypofunction. For example, our group has
examined the clinical effects of 2 weeks (10 daily or in
two groups of five daily sessions over 2 weeks) of rTMS
treatments at 1 Hz and 20 Hz administered at 80% of
motor threshold (MT) and found opposite effects on mood
(Kimbrell et al 1999). Preliminary evidence also suggested
differential clinical response as a function of baseline
metabolism within depressed patients; a response to 20-Hz
rTMS appeared to be associated with a pattern of baseline
hypometabolism, whereas response to 1-Hz rTMS
ap-peared to be associated with baseline hypermetabolism
(Kimbrell et al 1999).
In this study we examined the effects of 1- and 20-Hz
rTMS at a higher intensity (100% MT) on regional
cerebral blood flow (rCBF). An
15O water PET procedure
to measure absolute rCBF was performed 72 hours after
each phase of active treatment. Using the preclinical data,
we predicted that 10 days of 1-Hz rTMS would decrease
rCBF, whereas 20 Hz rTMS would increase rCBF in a
sustained fashion.
Methods and Materials
Patients
were crossed over to the other frequency. The 10 patients discussed in this article were the first patients to complete the rTMS treatments with both frequencies and also to complete PET scans at baseline and after each active treatment phase.
Ratings
Trained research assistants completed the 28-item Extended Hamilton Psychiatric Rating for Depression (Ham E; Hamilton 1960) at baseline, at the end of each 5-day period of rTMS treatment, and on the day of a PET procedure. The change from baseline to after the rTMS session was calculated for each frequency. The degree of improvement or worsening in mood after high and low frequency rTMS treatments were established by Pearsonr.
rTMS
Repetitive transcranial magnetic stimulation was administered using a Cadwell (Kennewick, WA) High Speed Magnetic Stim-ulator with a water-cooled figure-eight coil. Following an MRI scan of the brain to exclude structural abnormalities, the active MT was determined by placing the coil over the left primary motor area and establishing the minimum amount of stimulator output necessary to cause visible movement of the flexed right thumb following at least five out of 10 single pulses. This technique is highly correlated with the procedure using surface electrodes to record the MEP (Pridmore et al 1998).
The left prefrontal cortex rTMS stimulation site was deter-mined by measuring 5 cm anterior and in a parasagittal line from the hand motor area. Ten daily rTMS treatments were adminis-tered over the left prefrontal cortex at 100% of MT with the coil angled tangentially to the head. The sham condition was admin-istered at 20 Hz with one wing of the figure-eight coil in contact with the scalp and at a 45° angle with respect to the head. With the coil held in this orientation over M1, TMS does not produce MEPs but does produce sensations due to stimulation of scalp nerves and muscles. This has been used as a sham in previous studies (George et al 1997; Wassermann et al 1998; T.A. Kimbrell et al, unpublished data). A visible twitch in the scalp muscle was observed during these stimulations. Active high frequency (20 Hz) stimulation was administered (2 sec on and 28 sec off) 40 times for a total of 1600 stimulations per 20-min session. One-hertz rTMS was given in a continuous train of 1600 pulses over 26 min, 40 sec. Each patient had a minimum of 3 days between 1- and 20-Hz rTMS phases.
PET Imaging Procedures
Patients followed a low monoamine diet for a minimum of 4 days and fasted 8 hours before each PET scan. Patients were imaged at baseline while medication free for at least 2 weeks and then 3 days following the completion of their last (10th) rTMS treat-ment at each frequency. Scans were acquired with a GE (Wauke-sha, WI) Advance tomograph in the 3D mode (DeGrado et al 1994; Lewellen et al 1996). This scanner acquires 35 simulta-neous slices with an interslice spacing of 4.25 mm and a reconstructed transverse and axial resolution of 6 mm. Image
reconstruction included corrections for attenuation, random events, scatter, and dead time, and counts were converted to nCi/mL. Subject preparation included insertion of an indwelling radial artery catheter to permit measurement of the arterial input function and insertion of an intravenous catheter in the other arm for injection of15O water. Scans were obtained in planes parallel
to the canthomeatal line with head movement minimized by a thermoplastic face mask molded to each subject’s head and attached to the scanner bed. A 10-min transmission scan was obtained using two rotating Ge-68 sources to correct subsequent emission scans for attenuation. Scans were performed while subjects lay on the bed with eyes closed and ears unplugged in a quiet, darkened environment. They were instructed to monitor their mood state over the subsequent several minutes in an attempt to provide more consistency and specificity of cognitive processing during this resting state. Patients rated their level of sadness, anxiety, and alertness on an ordinal scale from 0 (“none”) to 6 (“very severe”), before and immediately following each of their five 2-min scans.
The patient’s pre- and postscan ratings did not significantly change over the course of the scanning session, suggesting that the task did not induce a transient change in mood state. None of the ordinal measures changed significantly over this interval. Each subject underwent five scans separated by 10 –12 min, obtained after bolus intravenous injection of 10 mCi of 15O
water. Image acquisition began when the radiotracer arrived in the head and continued for 60 sec. The arterial time–activity curve was measured with an automated blood sampling and counting system, and was used with an autoradiographic method to produce quantitative images of rCBF (Herscovitch et al 1983; Raichle et al 1983).
Imaging Analysis
Image analysis involved stereotactic normalization of scans followed by rCBF analyses. It was performed on a Sun SPARC-station 2 workSPARC-station (Sun Microsystems, Mountain View, CA) using Matlab (Mathworks, Sherborn, MA) with Statistical Para-metric Mapping software (SPM, courtesy of MRC Cyclotron Unit, Hammersmith Hospital, London, United Kingdom) (Fris-ton et al 1991a) for stereonormalization and SPM95 for the group analyses. ANALYZE (Mayo Foundation, Rochester, MN) and NIH- and NIMH-developed software were also used in the analysis and presentation. Global CBF (gCBF) comparisons were performed on a Macintosh (Apple Computer, Cupertino, CA) using StatView (Abacus Concepts, Berkeley, CA) and Microsoft Excel.
image representing an integration of blood flow over 10 min of passive introspection. The rationale for working with these mean images, as opposed to a set of five repeated measures for each scan session, was the lack of a peer-reviewed method for treating a random-effects analysis of variance design in SPM. These mean images were used for all rCBF comparisons in this study. Gray matter determination for the purposes of inclusion in SPM analysis was carried out as follows: the background noise threshold (above which a voxel is presumed to be within the brain) was set at one eighth of the mean of the entire image space, and whole-brain mean was calculated using only these suprathreshold voxels. Voxels exceeding 80% of the whole-brain mean were assumed to be in gray matter. Global CBF was calculated from an average of the within-brain pixel values from 16 contiguous supratentorial slices of each patient’s scan. The border of the brain for each PET slice was determined using a semiautomated edge-finding program. The calculated gCBF (mL/min/100 g tissue) represents the whole-brain mean CBF and includes gray matter, white matter, and cerebrospinal fluid in each slice.
To determine changes in rCBF during an rTMS treatment period, a pairedttest was performed in the group of 10 patients comparing mean rCBF images immediately before and 72 hours following the treatment phase in question. These paired ttests resulted inZmaps corresponding to the raw probabilities in each voxel of the null hypothesis of no change in rCBF. To correct for multiple comparisons, the Z maps were then submitted to a cluster analysis technique based on Gaussian random field theory (Friston et al 1994) with aZthreshold of 1.96 (two-tailedp5 .05) and a cluster probability threshold of p 5 .05. Cluster analysis considers the smoothness of the Zmap, which arises from both low-pass filtering applied to the input images and inherent spatial autocorrelation in the underlying brain function-ality, in determining the effective independence of the multiple comparisons made in the brain volume examined. Rawpvalues are then displayed (for purposes of depicting the topography of the changes) for all voxels falling within clusters deemed significant by this analysis. The Talairach atlas (Talairach and Tournoux 1988) was used to identify brain regions where blood flow changes were observed.
Results
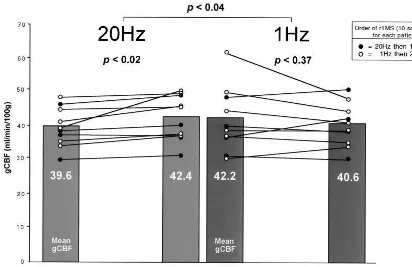
Global Changes in CBF following rTMS: Effects of
Frequency and Order
The differences from baseline in mean gCBF 72 hours
after the series of 10 treatments with 1- and 20-Hz rTMS
were consistent with predictions. Twenty-hertz rTMS
increased global blood flow significantly (paired
t
test,
p
,
.02), whereas 1-Hz rTMS did not significantly
alter global blood flow (paired
t
test,
p
,
.37) relative to
the respective pre-rTMS treatment baseline (Figure 1).
The increases in gCBF following 20 Hz were observed
regardless of whether this was the first or second
treatment phase. However, there was a suggestion that
prior 20-Hz stimulation may have reduced the effect of
1 Hz in decreasing rCBF: five of six patients who received
1 Hz first showed decreases, whereas two of four patients
who received 1 Hz after the 20-Hz trial showed decreases.
Regional Changes in CBF
Relative to pre-rTMS treatment baseline, a PET scan 72
hours after the completion of 10 sessions of 20-Hz rTMS
over the left prefrontal cortex at 100% MT showed
widespread increases in rCBF. The following regions
demonstrated significant rCBF elevations: the prefrontal
cortex (L
.
R), cingulate gyrus (L
..
R), and the left
amygdala, as well as bilateral insula, basal ganglia, uncus,
hippocampus, parahippocampus, thalamus, and
cerebel-lum (Figure 2). Increases in rCBF were apparent over
almost the entire left cingulate area (Figure 2, lower left
corner), with only modest, scattered increases in the right
cingulate (Figure 2, lower right corner).
The same analysis was performed to evaluate the effects
of 10 daily sessions of 1-Hz rTMS on rCBF. The predicted
opposite effects for 1 Hz were observed, but they were less
dramatic in anatomic extent or statistical significance than
the increases observed with 20-Hz rTMS. There were
decreases in the following regions: small areas of the right
prefrontal cortex, left medial temporal cortex, left basal
ganglia, and left amygdala (Figure 3). In contrast to 20 Hz,
there were no areas of significant increases following 1-Hz
rTMS.
Relationship of Clinical Response to Change in
rCBF
The effects of 1- and 20-Hz rTMS on clinical
antidepres-sant response in all patients were evaluated. Change in
Hamilton ratings in the same individuals following 10
rTMS treatments with 1 and 20 Hz were inversely
corre-lated (
r
5 2
.78,
p
,
.005). Thus, each patient who
improved with 1-Hz rTMS tended to worsen with 20-Hz
rTMS, or vice versa. The mean change in Hamilton score
was not significant in either the 1-Hz (pre–Ham E, 28.8
6
5.5, post–Ham E, 28.7
6
9.0) or 20-Hz (pre–Ham E,
29.1
6
9.1; post–Ham E, 26.8
6
5.0) rTMS phases.
Moreover, the degree of clinical response was not
signif-icantly correlated with change in blood flow in either the
1-Hz phase (
r
5 2
.12, ns) or the 20-Hz phase (
r
5
.32,
ns). In addition, when the changes in rCBF were covaried
for the degree of clinical improvement, the pattern of
findings in Figures 2 and 3 remained essentially unaltered
(data not illustrated).
Discussion
depressed patients significantly increase rCBF in the
prefrontal cortex (L
.
R), the entire left cingulate gyrus,
and the left amygdala, as well as bilateral uncus,
hip-pocampus, parahiphip-pocampus, thalamus, and cerebellum,
in a fashion that persists for at least 72 hours following the
last treatment. As predicted, the effects on rCBF following
10 daily treatments of 1-Hz rTMS were in the opposite
direction, but more circumscribed, with decreases in flow
in small areas of the right prefrontal cortex, left medial
temporal cortex, left basal ganglia, and left amygdala.
These opposite changes in rCBF were not correlated with
the degree of mood improvement in either phase.
One- and 20-Hz rTMS did have opposite effects on
mood in individual patients. Patients who improved with 2
weeks of rTMS on one frequency worsened on the other
(
r
5 2
.78,
p
,
.005,
n
5
10). These results at 100% MT
replicate those of Kimbrell et al (1999) at 80% MT, where
2 weeks of 1- versus 20-Hz rTMS also yielded opposite
effects on mood in individual depressed patients (
r
5
2
.80,
p
,
.004,
n
5
10). The lack of cognitive impairment
in that study at 80% MT (Little et al 2000) was also
mirrored in the current study at 100% MT (A.M. Speer et
al, unpublished data).
Thus, high frequency stimulation over the left prefrontal
cortex leads to persistent increases in rCBF over
wide-spread areas of the brain at a considerable distance from
the stimulation site. Since rTMS is thought to penetrate
about 1–2 cm into the brain, as revealed by the production
of MEPs at this depth (Epstein et al 1990; Marg and
Rudiak 1994), these remote changes in rCBF are likely
mediated transsynaptically. Consistent with this view is
the relative laterality of regional changes in blood flow,
with a predominance of alterations in the left versus the
right prefrontal cortex and cingulate, and bidirectional
changes in the left amygdala (ipsilateral) but not the right.
However, 20 Hz did increase rCBF in the frontal cortex
bilaterally, and surprisingly, 1-Hz rTMS decreased rCBF
only in the contralateral prefrontal cortex. It is possible
that the use of different rTMS parameters would lead to a
different pattern of changes. Although the observed
changes persisted for at least 3 days following the series of
10 rTMS treatments, the duration of the effect and whether
it could be magnified or extended are not known. How
these rTMS effects on rCBF relate to the current overview
of the literature suggesting a laterality–frequency
interac-tion (i.e., high frequency rTMS over the left prefrontal
cortex [Post and Speer 2000] and low frequency over the
right [Klein et al 1999]) remains to be further delineated.
The long-lasting changes that we found in rCBF may be
partially analogous to the long-lasting changes in synaptic
excitability demonstrated in studies using in vitro slice
preparations. In hippocampal, cortical, and cerebellar slice
preparations, brief high frequency stimulation leads to
LTP in neural excitability in appropriate synaptic
path-ways. In contrast, low frequency stimulation (1 Hz)
administered for 15 min leads to LTD. One-hertz
stimu-lation is able to reverse the effects of high frequency
stimulation and vice versa (Christie et al 1994; Linden
1994; Malenka 1994, 1995; O’Dell and Kandel 1994). The
bidirectional reversibility of LTP and LTD is less clear in
the amygdala slice preparation, where the baseline state of
neural excitability can affect the direction of long-term
response to low frequency stimulation (Li et al 1998).
How these in vitro findings of differential excitability as a
function of frequency of stimulation are pertinent to the
much more widespread in vivo changes in neuronal
activity as reflected in rCBF we observed is not certain.
The effect of treatment order (whether 1-Hz phase
pre-ceded 20 Hz or vice versa) also warrants further
exami-nation. There is a suggestion of less consistent decreases in
gCBF with 1-Hz rTMS when it followed treatment with
20-Hz rTMS, as opposed to when it was administered first.
The more modest effects of 1-Hz rTMS in decreasing
rCBF (as compared to the more robust increases following
20-Hz rTMS) could be related to the order of high and low
frequency rTMS phases; the state of baseline
hypoperfu-sion in depressed patients (i.e., a relative floor effect); or
the particular rTMS parameters utilized, including
vari-ability in placement of the coil over the prefrontal cortex.
This study has provided clear-cut evidence of the
differential effects of frequency of rTMS on the direction
of long-term adaptation in neural excitability as reflected
in rCBF in depressed patients. It raises the possibility of
eventual therapeutic applications of selectively activating
or inhibiting specific areas of the brain in different
neuropsychiatric syndromes by this noninvasive
proce-dure. In keeping with the findings of this study, low or
high frequency rTMS may be differentially utilized in
attempting to reregulate dysfunctional circuits associated
with baseline hyperactivity or hypoactivity, respectively.
The authors thank the Theodore and Vada Stanley Foundation for their generous support of this work, the National Institutes of Health (NIH) PET technologists and cyclotron engineers for their expertise and support, the Nursing staff and research assistants of the 3-West Clinical Research Unit, National Institute of Mental Health, Nadine Demian for her invaluable editorial assistance, and the NIH Anesthesiology Depart-ment for their expertise and support.
Interim analysis of this work was previously presented in abstract form (Speer et al 1998, 1999).
References
Amassian VE, Cracco RQ, Maccabee PJ, et al (1989): Suppres-sion of visual perception by magnetic coil stimulation of human occipital cortex. Electroencephalogr Clin Neuro-physiol74:458 – 462.
Barker AT, Freeston IL, Jalinous R, Jarratt JA (1987): Magnetic stimulation of the human brain and peripheral nervous sys-tem: An introduction and the results of an initial clinical evaluation.Neurosurgery20:100 –109.
Barker AT, Jalinous R, Freeston IL (1985): Non-invasive mag-netic stimulation of human motor cortex [Letter]. Lancet
1(8437):1106 –1107.
Berardelli A, Inghilleri M, Rothwell JC, et al (1998): Facilitation of muscle evoked responses after repetitive cortical stimula-tion in man.Exp Brain Res122:79 – 84.
Figure 2. Significant increases in absolute regional cerebral blood flow (rCBF) 72 hours after 2 weeks of 20-Hz repetitive transcranial magnetic stimulation (rTMS) over the left prefrontal cortex at 100% of motor threshold relative to the pretreatment baseline in the group of 10 depressed patients. A statistical parametric map shows voxels that occur within significant clusters and is color coded according to their raw p value. Increases in rCBF are displayed with a red– orange–yellow color scale, and there were no areas of decreases in rCBF displayed with a dark–light blue color scale. Nonsignificant values are displayed as gray on the positron emission tomography template. The number in the top right corner of each horizontal section (top two rows) indicates its position in mm with respect to the anterior commissure (AC)–posterior commissure plane. Twenty-hertz rTMS resulted in widespread increases in rCBF in the following regions: prefrontal cortex (L . R), cingulate gyrus (L.. R), bilateral insula, basal ganglia, uncus, hippocampus, parahip-pocampus, thalamus, cerebellum, and left amygdala. Note the distal effects in bilateral cortical and subcortical structures following stimulation over the left prefrontal cortex. Coronal sections (middle, bottom row) are displayed at the AC and 4 mm behind it to maximize visualization of the amygdala. Increases in the left amygdala but not the right are best viewed in horizontal sections at220,216, and212 mm, however. Sagittal sections are 4 mm to the left and right of midline to illustrate the greater increases in the left cingulate gyrus relative to the right. L, “left” side of image.
4™™™™™™™™™™™™™™™™™™™™™™™™™™™™™™™™™™™™™™™™™™™™™™™™™™
4™™™™™™™™™™™™™™™™™™™™™™™™™™™™™™™™™™™™™™™™™™™™™™™™™™
Bohning DE, Shastri A, McConnell A, et al (1999): A combined TMS/fMRI study of intensity-dependent TMS over motor cortex.Biol Psychiatry45:385–394.
Chen R, Classen J, Gerloff C, et al (1997): Depression of motor cortex excitability by low-frequency transcranial magnetic stimulation.Neurology48:1398 –1403.
Christie BR, Kerr DS, Abraham WC (1994): Flip side of synaptic plasticity: Long-term depression mechanisms in the hip-pocampus.Hippocampus4:127–135.
Cohen LG, Roth BJ, Nilsson J, et al (1990): Effects of coil design on delivery of focal magnetic stimulation. Technical consid-erations.Electroencephalogr Clin Neurophysiol75:350 –357. DeGrado TR, Turkington TG, Williams JJ, et al (1994): Perfor-mance characteristics of a whole-body PET scanner.J Nucl Med35:1398 –1406.
Epstein CM (1998): Transcranial magnetic stimulation: Lan-guage function.J Clin Neurophysiol15:25–32.
Epstein CM, Lah JJ, Meador K, et al (1996): Optimum stimulus parameters for lateralized suppression of speech with mag-netic brain stimulation.Neurology47:1590 –1593.
Epstein CM, Schwartzberg DG, Davey KR, Sudderth DB (1990): Localizing the site of magnetic brain stimulation in humans.
Neurology40:666 – 670.
Feinsod M, Kreinin B, Chistyakov A, Klein E (1998): Preliminary evidence for a beneficial effect of low-frequency, repetitive transcranial magnetic stimulation in patients with major depres-sion and schizophrenia.Depress Anxiety7:65– 68.
Fox P, Ingham R, George MS, et al (1997): Imaging human intra-cerebral connectivity by PET during TMS.Neuroreport
8:2787–2791.
Friston KJ, Frith CD, Liddle PF, Frackowiak RS (1991a): Comparing functional (PET): Images: The assessment of significant change.J Cereb Blood Flow Metab11:690 – 699. Friston KJ, Frith CD, Liddle PF, Frackowiak RS (1991b): Plastic transformation of PET images. J Comput Assist Tomogr
15:634 – 639.
Friston KJ, Passingham RE, Nutt JG, et al (1989): Localisation in PET images: Direct fitting of the intercommissural (AC-PC) line.J Cereb Blood Flow Metab9:690 – 695.
Friston KJ, Worsley KJ, Frackowiak RS, et al (1994): Assessing the significance of focal activation using their spacial extent.
Hum Brain Mapp1:210 –220.
Geller V, Grisaru N, Abarbanel JM, et al (1997): Slow magnetic stimulation of prefrontal cortex in depression and schizophre-nia. Prog Neuropsychopharmacol Biol Psychiatry 21:105– 110.
George MS, Wassermann EM, Kimbrell TA, et al (1997): Mood improvement following daily left prefrontal repetitive trans-cranial magnetic stimulation in patients with depression: A placebo-controlled crossover trial. Am J Psychiatry 154: 1752–1756.
George MS, Wassermann EM, Williams WA, et al (1995): Daily repetitive transcranial magnetic stimulation (rTMS) improves mood in depression.Neuroreport6:1853–1856.
Greenberg BD, George MS, Martin JD, et al (1997): Effect of prefrontal repetitive transcranial magnetic stimulation in ob-sessive-compulsive disorder: A preliminary study. Am J Psychiatry154:867– 869.
Grunhaus L, Dannon PN, Schreiber S, et al (2000): Repetitive
transcranial magnetic stimulation is as effective as electro-convulsive therapy in the treatment of nondelusional major depressive disorder: An open study.Biol Psychiatry47:314 – 324.
Hamilton M (1960): A rating scale for depression. J Neurol Neurosurg Psychiatry12:56 – 62.
Herscovitch P, Markham J, Raichle ME (1983): Brain blood flow measured with intravenous H2
15O I. Theory and error
analy-sis.J Nucl Med24:782–789.
Hoffman RE, Boutros NN, Berman RM, et al (1999): Transcra-nial magnetic stimulation of left temporoparietal cortex in three patients reporting hallucinated “voices”.Biol Psychiatry
46:130 –132.
Kimbrell TA, Little JT, Dunn RT, et al (1999): Frequency dependence of antidepressant response to left prefrontal repetitive transcranial magnetic stimulation (rTMS) as a function of baseline cerebral glucose metabolism.Biol Psy-chiatry46:1603–1613.
Klein E, Kreinin I, Chistyakov A, et al (1999): Therapeutic efficacy of right prefrontal slow repetitive transcranial mag-netic stimulation in major depression: A double-blind con-trolled study.Arch Gen Psychiatry56:315–320.
Lewellen TK, Kohlmeyer SG, Miyaoka RS, Kaplan MS (1996): Investigation of the performance of the General Electric Advance positron emission tomograph in 3D mode. IEEE Trans Nucl Sci43:2199 –2206.
Li H, Weiss SR, Chuang DM, et al (1998): Bidirectional synaptic plasticity in the rat basolateral amygdala: Characterization of an activity-dependent switch sensitive to the presynaptic metabotropic glutamate receptor antagonist 2S-alpha-ethyl-glutamic acid.J Neurosci18:1662–1670.
Linden DJ (1994): Long-term synaptic depression in the mam-malian brain.Neuron12:457– 472.
Little JT, Kimbrell TA, Wassermann EM, et al (2000): Cognitive effects of 1- and 20 hertz repetitive transcranial magnetic stimulation in depression: Preliminary report. Neuropsychia-try Neuropsychol Behav Neurol13:119 –124.
Malenka RC (1994): Synaptic plasticity in the hippocampus: LTP and LTD.Cell78:535–538.
Malenka RC (1995): LTP and LTD: Dynamic and interactive processes of synaptic plasticity.Neuroscientist1:35– 42. Marg E, Rudiak D (1994): Phosphenes induced by magnetic
stimulation over the occipital brain: Description and probable site of stimulation.Optom Vis Sci71:301–311.
McCann UD, Kimbrell TA, Morgan CM, et al (1998): Repetitive transcranial magnetic stimulation for posttraumatic stress disorder [Letter].Arch Gen Psychiatry55:276 –279. O’Dell TJ, Kandel ER (1994): Low-frequency stimulation erases
LTP through an NMDA receptor-mediated activation of protein phosphatases.Learning Memory1:129 –139. Pascual-Leone A, Gates JR, Dhuna A (1991): Induction of
speech arrest and counting errors with rapid-rate transcranial magnetic stimulation.Neurology41:697–702.
Pascual-Leone A, Rubio B, Pallardo F, Catala MD (1996): Rapid-rate transcranial magnetic stimulation of left dorsolat-eral prefrontal cortex in drug-resistant depression. Lancet
348:233–237.
Paus T, Jech R, Thompson CJ, et al (1997): Transcranial magnetic stimulation during positron emission tomography: A new method for studying connectivity of the human cerebral cortex.J Neurosci17:3178 –3184.
Paus T, Jech R, Thompson CJ, et al (1998): Dose-dependent reduction of cerebral blood flow during rapid-rate transcranial magnetic stimulation of the human sensorimotor cortex. J Neurophysiol79:1102–1107.
Post RM, Kimbrell T, Frye M, et al (1997): Implications of kindling and quenching for the possible frequency depen-dence of rTMS.CNS Spectrums2:54 – 60.
Post RM, Kimbrell TA, McCann UD, et al (1999): Repetitive transcranial magnetic stimulation as a neuropsychiatric tool: Present status and future potential.J ECT15:39 –59. Post RM, Speer AM (2000): Speculations on the future of rTMS and
related therapeutic modalities. In: George MS, Belmaker RH, editors.Transcranial Magnetic Stimulation in Neuropsychiatry.
Washington, DC: American Psychiatric Press, 269 –287. Pridmore S, Fernandes Filho JA, Nahas Z, et al (1998): Motor
threshold in transcranial magnetic stimulation: A comparison of a neurophysiological method and a visualization of move-ment method.J ECT14(1):25–27.
Raichle ME, Martin WRW, Herscovitch P, et al (1983): Brain blood flow measured with intravenous H2
15II.
Implementa-tion and validaImplementa-tion.J Nucl Med24:790 –798.
Rothwell JC, Thompson PD, Day BL, et al (1991): Stimulation of the human motor cortex through the scalp. Exp Physiol
76:159 –200.
Speer AM, Kimbrell TA, Dunn RT, et al (1998, May–June): Differential changes in rCBF with one versus 20 Hz rTMS in depressed patients. Abstract presented at the annual meeting of the American Psychiatric Association, Toronto.
Speer AM, Kimbrell TA, Willis MW, Post RM (1999): 20Hz and 1Hz rTMS for 2 weeks differentially affects absolute rCBF in depressed patients.Biol Psychiatry45:S130.
Talairach J, Tournoux P (1988):Co-Planar Stereotactic Atlas of the Human Brain.New York: Thieme.
Wassermann EM, McShane LM, Hallett M, Cohen LG (1992): Noninvasive mapping of muscle representations in human motor cortex.Electroencephalogr Clin Neurophysiol85:1– 8. Wassermann EM, Wedegaertner FR, Ziemann U, et al (1998): Crossed reduction of human motor cortex excitability by 1 Hz transcranial magnetic stimulation.Neurosci Lett250:141–144. Weiss SRB, Li XL, Heynen T, Post RM (1997): Kindling and
quenching: Conceptual links to rTMS.CNS Spectrums2:32– 35, 65– 68.
Wilson SA, Thickbroom GW, Mastaglia FL (1993): Transcranial magnetic stimulation mapping of the motor cortex in normal subjects. The representation of two intrinsic hand muscles.