Potential production and environmental effects of switchgrass and
traditional crops under current and greenhouse-altered climate in the
central United States: a simulation study
R.A. Brown
a,∗, N.J. Rosenberg
a, C.J. Hays
b, W.E. Easterling
c, L.O. Mearns
d aBattelle, Pacific Northwest National Laboratory, 901 D Street, S.W., Suite 900, Washington, DC 20024-2115, USA bDepartment of Agricultural Meteorology, 236 L.W. Chase Hall, University of Nebraska, Lincoln, NE 68583-0728, USAcDepartment of Geography, The Pennsylvania State University, University Park, PA 16802, USA dThe National Center for Atmospheric Research, 1850 Table Mesa Drive, Boulder, CO 80307, USA
Received 5 January 1999; received in revised form 12 July 1999; accepted 30 July 1999
Abstract
If, as many climate change analysts∗ speculate, industrial and other emissions of CO
2can be offset by substitution of biofuels, large areas of land, including agricultural land, may be converted to the production of biomass feedstocks. This paper explores the feasibility for the Missouri–Iowa–Nebraska–Kansas (MINK) region of the US of converting some agricultural land to the production of switchgrass (Panicum virgatum L.), a perennial warm season grass, as a biomass energy crop. The erosion productivity impact calculator (EPIC) crop growth model simulated production of corn (Zea mays L.), sorghum (Sorghum bicolor (L.) Moench), soybean (Glycine max L.), winter wheat (Triticum aestivum L.) and switchgrass at 302 sites within the MINK region. The analysis is done for both current climatic conditions and a regional climate model-based sce-nario of possible climate change. Daily climate records from 1983 to 1993 served as baseline and the NCAR-RegCM2 model (RegCM hereafter) nested within the CSIRO general circulation model (GCM) provided the climate change scenario. Crop production was simulated at two atmospheric CO2concentrations ([CO2]) at 365 and 560 ppm to consider the CO2-fertilization effect. Simulated yields of the perennial switchgrass increased at all sites with a mean yield increase of 5.0 Mg ha−1under the RegCM climate change scenario. Switchgrass yields benefited from temperature increases of 3.0–8.0◦C, which extended
the growing season and reduced the incidence of cold stress. Conversely, the higher temperatures under the RegCM scenario decreased yields of corn, soybean, sorghum and winter wheat due to increased heat stress and a speeding of crop maturity. With no CO2-fertilization effect, EPIC simulated maximum decreases from baseline of 1.5 Mg ha−1for corn, 1.0 Mg ha−1 for sorghum, 0.8 Mg ha−1for soybean and 0.5 Mg ha−1for winter wheat. Simulated yields increased for all crops under the RegCM scenario with CO2set to 560 ppm. Yields increased above baseline for 34% of the soybean and 37% of the winter wheat farms under RegCM/[CO2]=560 ppm scenario. Water use increased for all crops under the higher temperatures of the CSIRO scenario. Precipitation increases resulted in greater runoff from the traditional crops but not from switchgrass due to the crop’s increased growth and longer growing season. Simulated soil erosion rates under switchgrass and wheat cultivation
∗Corresponding author. Tel.:+1-202-646-5204; fax:+1-202-646-5233. E-mail address: [email protected] (R.A. Brown).
were less severe than under corn management. However, simulated erosion under switchgrass was considerable in eastern Iowa during the period of crop establishment because of strong winds at that time. ©2000 Elsevier Science B.V. All rights reserved.
Keywords: Biomass energy; Climate change; Central US; Switchgrass; EPIC
1. Introduction
Biomass-based energy systems have been proposed as a means of reducing greenhouse gas emissions (e.g. Hall et al., 1990; Graham et al., 1992; Hall et al., 1993; Wright and Hohenstein, 1994) when substituted for traditional fossil fuels. Such systems are carbon neutral since, when combusted, biomass returns to the atmosphere CO2 recently captured by the feedstock. There are, of course, CO2costs embedded in the inputs (e.g., fertilizer, diesel fuel) required in biomass pro-duction but there are also savings in the sequestration of carbon in the soil. Biomass energy can be produced from short rotation woody crops, herbaceous energy crops, halophytes, some annual crops and oilseeds.
The economic and environmental consequences of large-scale biomass production are viewed as positive or manageable by a number of analysts. Sampson et al. (1993) conclude that dedicated energy crops could reduce carbon emissions to the atmosphere from 0.2 to 1.0 Gt year−1. Hall (1997) projects a biomass con-tribution of 17–30% of global energy requirement up to 2050. Graham et al. (1996) applied an analytical assessment framework to two Tennessee regions and concluded that dedicated energy crops in place of con-ventional crops would significantly reduce erosion and chemical runoff. While biomass crops offer potential benefits, the conversion of large areas of productive agricultural lands to this use has possible downsides as well. The most serious of these is the competition for land that large-scale biomass culture will create. Rosenberg and Scott (1994) surveyed data that bear on this question. Some examples: an area of 465 million hectares — almost as large as the trans-Mississippi west — would have to be re- or afforested to offset the annual increase in atmospheric CO2emissions (Sedjo and Solomon, 1989); an area of 90.7 million hectares of new forests or 48% of all US croplands would be required to offset 50% of the 1.27 Gt year−1 an-nual US emissions of carbon (Moulton and Richards, 1990). Giampietro et al. (1997) believe that large-scale
biomass production will greatly stress available sup-plies of land and water everywhere and reverse eco-nomic progress in developing countries.
It is evident, then, that biomass production on a scale that will permit a significant substitution of fossil fu-els cannot be accomplished on marginal lands alone but will require large areas of prime agricultural land and the substitution of biomass crops for crops cur-rently grown in some regions. Whether or not a par-ticular biomass crop, switchgrass, can substitute for traditional crops in an important agricultural region, the Missouri–Iowa–Nebraska–Kansas (MINK) region of the central US, and whether or not climate change will favor such a substitution is evaluated here. Re-sults are presented on a simulation study comparing the yield potential of switchgrass, its water use and effects on soil erosion with those of the region’s dom-inant agricultural crops — corn, sorghum, soybeans and winter wheat. The comparison is made for cur-rent climatic conditions (baseline) and for a scenario of greenhouse-forced climate change with and with-out a CO2-fertilization effect.
2. Methods and materials
The erosion productivity impact calculator (EPIC) (Williams, 1995), the crop growth simulator used in this study, is described in this section as are the input datasets that it requires. Brown et al. (1998) provides a more detailed description of EPIC and representative farms used in this study.
2.1. EPIC model description
Daily values of precipitation, minimum/maximum air temperature, solar radiation, windspeed and rel-ative humidity drive EPIC. The model simulates bio-physical processes encompassing an agricultural system such as photosynthesis evapotranspiration, runoff, water erosion and wind erosion.
EPIC models a wide range of crops using pa-rameters specific to each crop. The crop growth model uses radiation use efficiency to calculate the potential daily photosynthetic production of biomass. The daily potential is decreased by stresses caused by shortages of radiation, water and nutrients, by temperature extremes and by inadequate soil aera-tion in proporaera-tion to the severity of the most severe stress for that day. Atmospheric CO2 concentration ([CO2]) affects stomatal conductance. Stomatal con-ductance affects radiation use efficiency and water use efficiency and, as a result, photosynthesis and evapotranspiration. Stockle et al. (1992a, b) adapted EPIC to simulate the CO2-fertilization effect on plant photosynthesis and transpiration. Crop maturity is determined by the accumulation of heat units dur-ing the growdur-ing season. Crop yields are estimated by multiplying above-ground biomass at maturity by a harvest index (proportion of total biomass in harvested organs) for the particular crop. For addi-tional details on EPIC as it is used in climate change impact simulations, see Brown and Rosenberg (1997, 1999).
2.2. The study area and climate scenarios
A high resolution climate change scenario for the US (Mearns et al., 1996) provided the climate change scenario. Giorgi et al. (1998) employed the NCAR-RegCM2 regional climate model (RegCM) nested within a GCM and run at a 50 km grid point spacing. The RegCM receives lateral and initial boundary conditions from a GCM. The CSIRO model (Watterson et al., 1995) was chosen in this applica-tion because of its ability, relative to other available GCMs, to reproduce historic climate over the central United States. The RegCM network encompasses a network of 302 50×50 km grid boxes (Fig. 1). This fine-scale grid allows simulation of switchgrass and the traditional crops in sufficient detail to explore variability due to geography, climate, soils and farm
management. A 10-year daily climate record was created for both the control and the climate change scenario. The latter is based on the assumption of an effective doubling of the preindustrial atmospheric CO2 concentration (2×CO2 climate). Differences between the control and 2×CO2 climates were then applied to the baseline of each grid box to create its climate change scenario.
2.3. EPIC representative farms
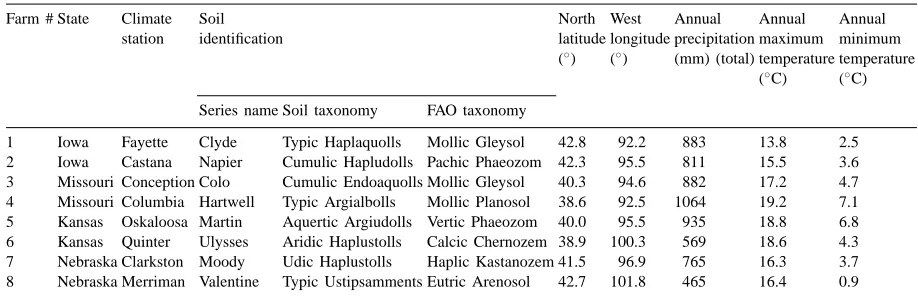
A set of ‘representative farms’ was developed to describe agricultural practices and environmental con-ditions in each of the 302 grid boxes. The repre-sentative farm design stems from an earlier study of the MINK region (Easterling et al., 1992; Rosenberg, 1993) and subsequent follow-up analyses (Easterling et al., 1998). A subset of eight farms identified in Fig. 1 is used to provide details on the mechanisms that determine crop response under current and changed climate. Table 1 presents the location of these farms, their soils and some climatic data.
Daily climate records from the National Weather Service Cooperative Climate Network provided base-line precipitation and minimum/maximum tempera-ture data from 1983 to 1993. Daily solar radiation, rel-ative humidity and windspeed records were assembled with the EPIC weather generator (WXGEN) of
Table 1
Location, climate and soil series of the subset of representative farms identified in Fig. 1
Farm # State Climate Soil North West Annual Annual Annual
station identification latitude longitude precipitation maximum minimum (◦) (◦) (mm) (total) temperature temperature
(◦
C) (◦
C)
Series name Soil taxonomy FAO taxonomy
1 Iowa Fayette Clyde Typic Haplaquolls Mollic Gleysol 42.8 92.2 883 13.8 2.5 2 Iowa Castana Napier Cumulic Hapludolls Pachic Phaeozom 42.3 95.5 811 15.5 3.6 3 Missouri Conception Colo Cumulic Endoaquolls Mollic Gleysol 40.3 94.6 882 17.2 4.7 4 Missouri Columbia Hartwell Typic Argialbolls Mollic Planosol 38.6 92.5 1064 19.2 7.1 5 Kansas Oskaloosa Martin Aquertic Argiudolls Vertic Phaeozom 40.0 95.5 935 18.8 6.8 6 Kansas Quinter Ulysses Aridic Haplustolls Calcic Chernozem 38.9 100.3 569 18.6 4.3 7 Nebraska Clarkston Moody Udic Haplustolls Haplic Kastanozem 41.5 96.9 765 16.3 3.7 8 Nebraska Merriman Valentine Typic Ustipsamments Eutric Arenosol 42.7 101.8 465 16.4 0.9
Richardson and Nicks (1990) using monthly averages from the nearest National Weather Service (NWS) first order station. Soil properties were derived from the STATSGO (USDA, 1992) and EPIC (Williams et al., 1990) databases. Tillage practices employed with corn, sorghum, soybean and winter wheat were derived from the agricultural sector model (ASM) crop budgets for 1996 (McCarl et al., 1998). A series of switchgrass field experiments (Anderson, 1989; Anderson and Shapiro, 1990; Mitchell et al., 1994) provided a single switchgrass management budget for the entire region. Only one mid-summer harvest was simulated for switchgrass, although two harvests may be more appropriate in southern Missouri and Kansas.
3. Results
3.1. Validation of EPIC
3.1.1. Traditional crop simulations
EPIC simulations of crop yield have been exten-sively validated against actual crop yields. Kiniry et al. (1990) found agreement between simulated and actual yields of corn, wheat, rice, soybean, barley and sunflower under a variety of management sys-tems and climatic conditions. Rosenberg et al. (1992) compared EPIC-simulated yields with historic county yields, yields from agronomic experiments and yield estimates by local agricultural experts and concluded that EPIC is suitable for simulating agricultural
production in the MINK region. Easterling et al. (1998) reported that EPIC simulations of representa-tive farms with soils and climate data on a 0.5◦grid scale explained 65% of the annual variation in eastern Iowa corn and 54% in western Kansas wheat yields.
The validation exercises described above employed earlier versions of EPIC, and the crop budgets, soils and climates of the representative farms differed slightly from those used here. Given the previous work, the goal of this validation was modest: to determine if EPICs algorithms and the represen-tative farm descriptions generally agree with regional historic yields and accurately predict regional yield patterns.
Fig. 2. EPIC-simulated yields compared with historic yields (from USDA-NASS county crops database) for grain crops on 13 representative farms in the MINK region.
3.1.2. Switchgrass simulations
Switchgrass has not been cultivated extensively in the MINK region. Thus, no long-term records of his-toric yields exist against which to validate the EPIC switchgrass results. Recent switchgrass yield trials conducted in the MINK region (Vogel, 1996a) present an opportunity for validation. Rosenberg et al. (1992) argue that EPIC, in any event, is best compared with experimental yields, since both utilize optimal man-agement. Kiniry et al. (1996) compared switchgrass yields simulated by ALMANAC — a model similar to EPIC — with yields from agronomic trials in Texas and found that simulated yields explained 79% of the variability in measured yields.
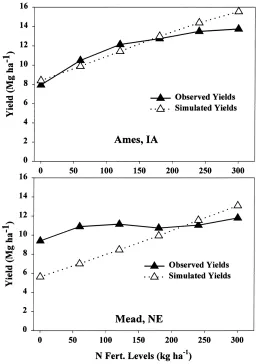
Switchgrass simulations were compared against data from factorial experiments which tested the ef-fects of nitrogen fertilization rates and harvest sched-ule on switchgrass yield between 1993 and 1995 at Ames, IA (42.00 N lat., 93.50 W long., ≈725 mm annual precipitation, soil series Webster) and Mead, NE (41.30 N lat., 96.60 W long., ≈675 mm annual precipitation, soil series Sharpsburg) (Vogel, 1996a). Switchgrass was planted in 1993 to establish the crop. Fertilization rates were varied from 0 to 300 kg ha−1 of N in 60 kg ha−1 increments, and the crop was
harvested at weekly intervals from late June into September. A final harvest was made at the end of the growing season in November. EPIC datasets were constructed to approximate the environmental and agronomic conditions of the experiment and then used to model switchgrass production over a 30-year period, repeating the climate records of 1993–1995 and using simulated mean yields for comparison.
Table 2
Mean yields, standard deviations and root mean square error (RMSE) for switchgrass experimental yields and EPIC simulated yields by location and harvest
Site Measured yields (Mg ha−1) Simulated yields (Mg ha−1) RMSEb
Mean Stdev.a Mean Stdev.a
Ames Summer cutting 9.9 2.4 9.1 1.8 2.6
Mead 9.3 1.9 7.5 2.2 2.9
Ames Fall cutting 1.9 0.6 3.7 0.9 2.0
Mead 1.5 0.4 2.4 0.6 1.0
Ames Annual yieldc 11.7 2.3 12.8 2.5 3.0
Mead 10.8 2.6 9.8 2.6 2.7
aStandard deviation. bRoot mean square error.
cAnnual yield is calculated by summing yields from the summer and fall cutting.
Table 3
Mean seasonal baseline temperatures, seasonal precipitation totals and deviations from baseline under the RegCM climate change scenario for eight representative farms within the MINK region
Farm #a Winter (D,J,F) Spring (M,A,M) Summer (J,J,A) Fall (S,O,N)
Baseline RegCMb Change Baseline RegCM Change Baseline RegCM Change Baseline Regcm Change
Mean temperature (◦C)
1 −6.7 0.1 6.8 8.7 16.2 7.5 21.5 26.2 4.6 9.0 13.8 4.8
2 −4.5 1.5 6.0 10.0 16.3 6.3 22.6 27.2 4.7 10.1 14.9 4.8
3 −2.4 2.7 5.1 11.2 16.8 5.6 23.5 28.4 4.9 11.6 16.2 4.6
4 1.0 5.7 4.7 13.3 18.8 5.5 24.4 29.1 4.7 13.9 18.4 4.5
5 0.0 4.2 4.3 12.9 18.0 5.1 24.8 29.4 4.6 13.5 18.1 4.6
6 −0.9 2.9 3.7 11.0 15.3 4.3 23.8 28.1 4.3 11.8 16.2 4.4
7 −3.5 1.5 5.0 10.2 15.8 5.6 23.2 27.6 4.5 10.3 15.1 4.8
8 −3.7 0.9 4.6 8.1 13.2 5.1 21.4 25.7 4.2 8.8 13.0 4.2
Total precipitation (mm)
1 84 113 29 254 266 12 298 343 44 247 361 115
2 56 67 11 271 311 40 299 316 18 186 273 87
3 80 91 11 254 360 107 321 322 1 227 275 48
4 168 196 28 305 359 54 286 314 28 304 400 96
5 93 106 13 296 376 81 289 302 13 258 321 63
6 48 49 2 208 330 122 217 269 52 96 115 19
7 56 63 7 245 291 47 278 325 47 186 231 45
8 31 38 7 139 218 79 215 246 30 80 93 13
aFarm locations are identified in Fig. 1 and summarized in Table 1. bNCAR RegCM2 model simulation of 2×CO2climate change scenario.
from the Mead, NE, site also show a linear increase to N fertilization; however, agreement with observed yields is poor, with the observed yields virtually unresponsive to fertilizer rates.
EPIC reasonably matches mean annual switchgrass yields from agronomic trials at two sites in the MINK region. The validation results are comparable with pre-vious EPIC model validations (Rosenberg et al., 1992; Kiniry et al., 1996; Brown and Rosenberg, 1999). However, the results also show disagreement between observed and simulated data with regard to the effect of yield to N application rates. While these flaws are not severe enough to dismiss the modeling results, they do introduce a level of uncertainty and highlight areas where the model needs to be improved to correctly mimic switchgrass growth and development.
3.2. Climate scenarios
The climate scenarios used in this study are re-ported in full by Mearns et al. (1999a, 1999b). Sea-sonal means of temperature and precipitation for the baseline climate and deviations from baseline under
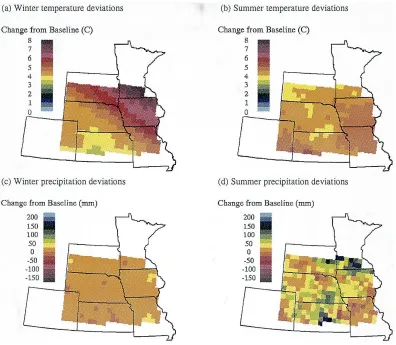
the RegCM scenario are presented in Table 3. Mean winter temperatures range from 1.6◦C in the south to −8.8◦C in the most northerly regions. Spring temper-atures range from 13.8 to 5.8◦C; summer from 26.1 to 18.5◦C; fall from 14.4 to 6.6◦C. For fall and summer, the RegCM scenario increases temperatures from 4 to 5◦C for the entire study region (summer, Fig. 4(b)). For winter and spring, the RegCM scenario raises temper-ature from 6 to 8◦C in Iowa and northeastern Nebraska (farms 1–2) from southwest to northeast (winter, Fig. 4(a)). Giorgi et al. (1998) attribute these dramatic in-creases in the region’s winter and spring temperatures to the loss of permanent snow cover, resulting in a snow albedo feedback.
Fig. 4. Temperature and precipitation deviations from baseline under the RegCM climate change scenario for winter (December–January–February) and summer (June–July–August).
precipitation decreases in 12% of the grids. Devia-tions ranging up to 200 mm occur in fall, increasing in amount from west to east.
3.3. Baseline and RegCM simulated yields
3.3.1. Traditional crops
Table 4 summarizes yield results from the EPIC simulations and Table 5 presents EPIC recorded stress day data simulations for both the traditional crops and switchgrass under baseline and the RegCM climate change scenario. Table 6 presents simulated yields and stress data for eight representative farms (identified in Fig. 1 and described in Table 1) under corn, winter wheat and switchgrass cultivation.
Table 4
Simulated yield means, standard deviations and range for the 302 representative farms sorted by crop and climate scenario
Crop Baseline (Mg ha−1) RegCMa(Mg ha−1) RegCM+CO2b (Mg ha−1)
Mean Stdev. Range Mean Stdev. Range Mean Stdev. Range
Corn 5.2 2.0 0.6–7.9 5.3 1.3 0.4–7.2 5.7 1.2 0.9–7.5
Sorghum 4.0 1.3 0.7–6.1 3.9 1.1 0.8–5.5 4.2 1.1 0.9–5.8
Soybean 1.8 0.7 0.4–3.0 1.7 0.5 0.4–2.4 2.0 0.5 0.6–2.9
Winter wheat 2.5 0.5 1.1–3.6 2.5 0.4 1.6–3.8 2.8 0.5 1.6–4.1
Switchgrass 6.8 1.9 2.2–12.0 11.8 3.2 3.8–17.5 13.4 3.6 4.0–19.7
aNCAR RegCM2 model simulation of 2×CO2 climate change scenario with [CO2]=365 ppm. bNCAR RegCM2 model simulation of 2×CO2climate change scenario with [CO2]=560 ppm.
Temperature increases under the RegCM climate decrease crop yields in the eastern and central por-tion of the study region. The higher temperatures in-duce a more rapid accumulation of heat units, speed-ing phenological development, shortenspeed-ing the grow-ing season and reducgrow-ing crop yields. Yield decreases ranged from 0.6 to 1.1 Mg ha−1for corn, for sorghum from 0.2 to 0.6 Mg ha−1, for soybean from 0.1 to 0.6 Mg ha−1 in the eastern and central zones. In the case of winter wheat, yield decreases were associ-ated with increases in water stress (e.g., farm 1). In-creased temperatures reduced the frequency of cold temperature stress suffered by winter wheat, which
Table 5
Simulated stress day mean, median and range for the 302 representative farms by crop and climate scenario
Crop Scenario Water stress (days) Temperature stress (days) Nitrogen stress (days) Phosphorus stress (days)
Mean Median Range Mean Median Range Mean Median Range Mean Median Range
Corn Baseline 17 9 1–66 15 14 4–62 6 1 0–30 2 0 0–22
RegCMa 9 3 1–39 19 17 6–37 5 3 0–29 2 1 0–22
RegCM+CO2b 6 2 1–35 18 17 5–37 8 8 0–36 3 1 0–27
Sorghum Baseline 17 12 1–56 20 19 3–70 3 0 0–31 1 0 0–29
RegCM 8 4 1–37 14 14 3–34 3 1 0–31 1 0 0–24
RegCM+CO2 5 2 1–34 14 14 3–34 4 3 0–36 1 1 0–27
Soybean Baseline 21 18 2–62 18 16 4–66 0 0 0–0 2 0 0–24
RegCM 9 6 1–37 13 12 3–27 0 0 0–0 1 0 0–11
RegCM+CO2 7 4 1–35 13 12 4–27 0 0 0–0 2 1 0–22
Winter wheat Baseline 31 27 9–78 120 119 64–161 10 5 0–74 2 0 0–33
RegCM 26 26 5–73 68 69 28–90 19 17 0–75 6 4 0–48
RegCM+CO2 20 20 4–66 79 81 40–105 30 30 0–87 7 5 0–59
Switchgrass Baseline 30 28 1–75 193 194 156–245 37 41 0–70 32 35 0–74
RegCM 44 47 0–90 150 154 106–200 2 0 0–66 45 51 0–89
RegCM+CO2 53 49 8–137 148 152 104–200 3 0 0–75 70 76 1–108
aNCAR RegCM2 simulation of 2×CO2 climate change scenario with [CO2]=365 ppm. bNCAR RegCM2 simulation of 2×CO2 climate change scenario with [CO2]=560 ppm.
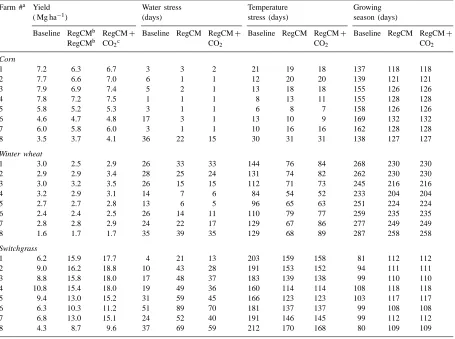
Table 6
EPIC simulated mean yields, water stress days, temperature stress days and growing season under baseline climate, RegCM climate and RegCM climate with increased CO2 for eight representative farms under corn, winter wheat and switchgrass cultivation
Farm #a Yield Water stress Temperature Growing
( Mg ha−1) (days) stress (days) season (days)
Baseline RegCMb RegCM+ Baseline RegCM RegCM+ Baseline RegCM RegCM+ Baseline RegCM RegCM+
RegCMb CO2c CO2 CO2 CO2
Corn
1 7.2 6.3 6.7 3 3 2 21 19 18 137 118 118
2 7.7 6.6 7.0 6 1 1 12 20 20 139 121 121
3 7.9 6.9 7.4 5 2 1 13 18 18 155 126 126
4 7.8 7.2 7.5 1 1 1 8 13 11 155 128 128
5 5.8 5.2 5.3 3 1 1 6 8 7 158 126 126
6 4.6 4.7 4.8 17 3 1 13 10 9 169 132 132
7 6.0 5.8 6.0 3 1 1 10 16 16 162 128 128
8 3.5 3.7 4.1 36 22 15 30 31 31 138 127 127
Winter wheat
1 3.0 2.5 2.9 26 33 33 144 76 84 268 230 230
2 2.9 2.9 3.4 28 25 24 131 74 82 262 230 230
3 3.0 3.2 3.5 26 15 15 112 71 73 245 216 216
4 3.2 2.9 3.1 14 7 6 84 54 52 233 204 204
5 2.7 2.7 2.8 13 6 5 96 65 63 251 224 224
6 2.4 2.4 2.5 26 14 11 110 79 77 259 235 235
7 2.8 2.8 2.9 24 22 17 129 67 86 277 249 249
8 1.6 1.7 1.7 35 39 35 129 68 89 287 258 258
Switchgrass
1 6.2 15.9 17.7 4 21 13 203 159 158 81 112 112
2 9.0 16.2 18.8 10 43 28 191 153 152 94 111 111
3 8.8 15.8 18.0 17 48 37 183 139 138 99 110 110
4 10.8 15.4 18.0 19 49 36 160 114 114 108 118 118
5 9.4 13.0 15.2 31 59 45 166 123 123 103 117 117
6 6.3 10.3 11.2 51 89 70 181 137 137 99 108 108
7 6.8 13.0 15.1 24 52 40 191 146 145 99 112 112
8 4.3 8.7 9.6 37 69 59 212 170 168 80 109 109
aFarm locations are identified in Fig. 1 and summarized in Table 1.
bNCAR RegCM2 simulation of 2×CO2 climate change scenario with [CO2]=365 ppm. cNCAR RegCM2 simulation of 2×CO2 climate change scenario with [CO2]=560 ppm.
A pattern develops in which yields improve in the western and northern portions of the study re-gion while those in the southern and eastern por-tions decline. This pattern is most evident in corn (Fig. 5(a)), soybean (Fig. 5(b)) and sorghum (not shown). For the study region, yield increases and decreases tend to cancel one another and regional mean yields of the traditional crops are not greatly affected (Table 4). These results for corn, wheat and soybean are comparable to those of Mearns et al. (1999b).
3.3.2. Switchgrass
Since switchgrass is a perennial forage crop, di-rect comparison of yields, growing season length and stress day frequencies with those of the grain crops can be misleading. Switchgrass yields differ from grain yields since all of its aboveground biomass is har-vested. Stress days are more frequent for switchgrass since its growing season includes the period after sum-mer harvest until dormancy.
Fig. 5. Yield deviations from baseline for corn, soybean, winter wheat and switchgrass under the RegCM climate scenario with [CO2]=365 ppm.
region with the highest yields in southern Kansas and Missouri and the lowest in western Nebraska. Low temperatures stress switchgrass and limit the growing season in the entire study region. Temperature stress in the northern zone exceeds 200 days in some cases (winter days are included in this number). Nitrogen stress also limits switchgrass yields and is primarily recorded during spring emergence. Water stress was evident in the western zone where yields ranged from 4.0 to 6.0 Mg ha−1. However, as compared to corn, switchgrass yields were insensitive to water shortages. Notably, switchgrass yields (Fig. 5(d)) were fa-vored by the RegCM climate change scenario with yields increasing from baseline on all 302 represen-tative farms. Increases exceeding 8.0 Mg ha−1 are simulated in Iowa and eastern Nebraska. Switchgrass
benefits from temperature increases of 6.0 to 8.0◦C which reduce cold temperature stress and lengthen the growing season. Yield increases of 2.0 to 5.0 Mg ha−1 prevail in the western and central portions of Kansas and Nebraska. The lesser yield increases are associ-ated with more modest increases in spring and winter temperatures and an increased frequency of water stress. This occurs despite increased precipitation and is most evident in southern Kansas.
for crop uptake. Thus, volatilization and denitrification rates do not increase appreciably. This differs from the traditional summer crops that are planted after N becomes available in early spring.
3.4. Simulated evapotranspiration, runoff and soil erosion
Table 7 presents data on simulated water use and soil erosion under corn, winter wheat and switch-grass cultivation for baseline and the RegCM climate change for the eight representative farms identified in Fig. 1. Under baseline climate, the wheat crop ET is lowest, ranging from 372 to 644 mm while
switch-Table 7
EPIC simulated annual mean evapotranspiration, surface runoff and erosion under baseline climate, RegCM climate and RegCM climate with increased CO2 for eight representative farms under corn, winter wheat and switchgrass cultivation
Farm #a Evapotranspiration (ET) (mm year−1) Surface runoff (Q) (mm year−1) Soil erosiond (Mg ha−1year−1)
Baseline RegCMb RegCM+CO2c Baseline RegCM RegCM+CO2 Baseline RegCM RegCM+CO2
Corn
1 533 578 545 1 12 14 21 53 50
2 618 655 617 32 82 90 19 38 38
3 627 658 617 12 35 36 10 21 20
4 736 767 726 19 64 66 5 13 13
5 682 693 659 73 155 160 58 123 124
6 558 659 621 5 18 20 159 170 168
7 599 630 589 7 25 26 26 39 37
8 394 437 428 2 15 16 422 305 305
Winter wheat
1 494 535 508 1 15 15 9 5 5
2 542 597 568 39 93 96 2 2 2
3 538 598 561 14 35 36 2 1 1
4 644 712 671 24 64 65 0 1 1
5 636 728 677 79 159 167 8 16 14
6 514 624 578 9 21 22 29 18 16
7 531 632 583 10 27 28 4 5 4
8 372 414 386 4 18 18 33 28 28
Switchgrass
1 627 874 825 1 12 13 28 17 17
2 719 865 851 27 68 72 11 12 12
3 758 927 908 12 34 35 1 1 1
4 901 1034 1018 20 57 59 0 1 1
5 802 935 925 66 122 129 1 4 4
6 561 694 693 4 14 15 28 5 5
7 666 817 804 7 19 21 13 11 10
8 414 509 503 2 13 14 43 47 47
aFarm locations are identified in Fig. 1 and summarized in Table 1.
bNCAR RegCM2 simulation of 2×CO2 climate change scenario with [CO2]=365 ppm. cNCAR RegCM2 simulation of 2×CO2 climate change scenario with [CO2]=560 ppm. dSoil erosion data includes both simulated wind and water erosion estimates.
Simulated annual runoff was lower under switch-grass cultivation than under the traditional crops. Under baseline climate, for example, runoff on Farm 5 in Kansas ranged from 79 mm under winter wheat to 66 mm under switchgrass cultivation. Low base-line precipitation limits runoff in the western zone regardless of crop cover. Greater precipitation under the RegCM climate change increases runoff. Farms growing corn and wheat show more sensitivity to the changed climate than farms growing switchgrass. Increases from baseline runoff ranged from 11 to 82 mm with corn, from 13 to 80 mm with wheat and from 10 to 56 mm with switchgrass as cover. While the greatest absolute increases in runoff occurred on farms in the eastern and central zone of the study re-gion, the relative changes in the western zone are also notable.
EPIC-simulated rates of erosion are generally high-est on farms growing corn due to more frequent tillage of this crop. The high rates of erosion on corn farms 6 and 8 are due to steep topography. At these sites, cultivation of winter wheat and switchgrass reduces erosion significantly. Annual average ero-sion on farm 1 is slightly greater under switchgrass cultivation (28 Mg ha−1) than under corn or wheat cultivation. This higher value is an artifact explained by the incidence of strong wind erosion during the establishment of the switchgrass in the first year of its 10-year rotation. More than 95% of all the erosion occurs in that year. Ranney and Mann (1994) present experimental data showing similar erosion results. They conclude that most erosion in short rotation woody crops grown for biomass occurs during the establishment period and suggest that proper man-agement of crop residues can mitigate much of this erosion.
The pattern of simulated erosion rates under the RegCM scenario differs by crop. In general, erosion under switchgrass cultivation decreases, it increases under corn and remains insensitive under winter wheat cultivation (Table 7). The higher erosion rates for corn are due to the increased precipitation and runoff which prevail under the RegCM climate. The increased growth for switchgrass reduces the erosion risk by providing a continuous cover throughout the year. These results are similar to those of Phillips et al. (1993) where increases in storm frequency and intensity under a set of GCM climate change scenarios
increased the national potential erosion amounts on cropland by 2–16%.
3.5. The CO2-fertilization effect
The effects of the RegCM climate change sce-nario on EPIC-simulated yields are modified when the simulations reported above were repeated with [CO2]=560 ppm. Tables 4–6 present simulated yield and stress day data and Table 7 presents simulated wa-ter use and soil erosion data RegCM climate change with increased CO2.
For all crops, increased [CO2] decreases water stress in the central and western zones (farms 6, 8) where wa-ter supply is inadequate even under the climate change scenario. Corn and sorghum yields are most respon-sive to decreased water stress, while winter wheat is least affected. Elevated [CO2] does not affect temper-ature stress. N stress, on the other hand, is increased by elevated [CO2] in all crops but soybean. Increases in N stress are due to increased production of biomass which increases crop demand for it.
Relative yield increases under CO2-fertilization are greatest for soybean and winter wheat, C3 crops which benefit from increased water use efficiency and greater photosynthetic efficiency. Yield gains for winter wheat are greatest in Iowa and Missouri with maximum in-creases from baseline of 0.5 Mg ha−1. Elevated [CO
2] raised yields only slightly on wheat farms in central and western Kansas and Nebraska (farms 6, 8). How-ever, these increases were large enough to return yields to or above baseline. For corn and sorghum, relative yield increases are smaller than in soybean and win-ter wheat and inversely correlated with wawin-ter stress. EPIC is programmed to simulate only small responses in photosynthetic efficiency for C4 crops.
This is an artifact of EPIC which allots a stress day to only that stress which is most severe on that day. That yields, the true measure of how well a plant adapts and grows in a given environment, increase despite the high number of P stress days supports this interpretation.
Since the CO2-fertilization effect increases water use efficiency, crop ET is decreased in all cases un-der the RegCM climate when [CO2]=560 ppm. The greatest decreases in switchgrass ET occur in north-eastern Iowa (farms 1, 2, 3), while corn and wheat ET decreases across the entire study region. Climate change with elevated [CO2] increases runoff slightly regardless of crop cover while elevated [CO2] has min-imal impact on soil erosion with small changes evident for all crops.
4. Discussion
In general, temperature increases under the RegCM climate are most important in determining yield re-sponse for both the traditional crops and switchgrass. Temperature increases lowered yields of the tradi-tional crops, while improving those of switchgrass. Higher temperatures speed maturity of the grain crops which, all else equal, decreases yields. This find-ing is consistent with results obtained by Easterlfind-ing et al. (1992), Rosenzweig et al. (1994), Brown and Rosenberg (1999) and Mearns et al. (1999a) which also show the negative impact of rising temperatures and shortened growing season on grain yields. The increases in precipitation benefited crop yields, but only slightly. Yields of corn, soybean and sorghum increased above baseline levels in western Kansas and Nebraska. It is unclear whether such yield increases would be sufficient to permit dryland production in the western MINK region. Such a question can be an-swered only by linking these results to an integrated economics and human activities modeling effort.
The simulation results presented with regard to changes in water use, runoff and soil erosion apply to the individual sites and depend on the specific soil, climate and management regime used. However, the results do show that large-scale conversion to switch-grass in the MINK region may affect water resources through decreased surface runoff. To fully address the potential implications of climate change and biomass
energy crops for the region’s water resources will require integration of the farm level results with a regional hydrologic assessment of impacts on water quality and quantity.
Past analyses have addressed or commented on the tradeoffs among biomass energy produc-tion, traditional energy sources and agriculture (Lowenberg-DeBoer and Cherney, 1989; Reese et al., 1993; Vogel, 1996b) but have not considered the implications of greenhouse-forced climate change on biomass production. Other analyses have examined the impact of climate change on agriculture in the US Midwest using crop growth simulation models (Rosenzweig, 1989; Rosenberg, 1993; Rosenzweig et al., 1994; Brown and Rosenberg, 1997). Certain of these assessments consider farm level adaptations to climate change, but biomass cropping has not been among the adaptations considered. This simulation ex-ercise has compared the yield response of switchgrass with those of corn, soybeans, sorghum and wheat to changes in climate and concluded that switchgrass can not only compete, in agronomic terms, with tra-ditional crops under baseline climate, but will have a comparative advantage over these crops in a warmer climate. These findings here are consistent with those of an earlier study (Brown and Rosenberg, 1996) and taken together lead us to conclude that switchgrass could be the basis of a biomass energy industry in the MINK region. These findings also demonstrate the possible usefulness of switchgrass, a species na-tive to the Great Plains, as an option for agricultural adaptation to climate change. Further, it will be easier for farmers to adopt switchgrass rather than woody species for biomass production since the same farm machinery and equipment as is used for grain pro-duction in the region can be employed. This analysis addresses only the potential production of switch-grass at the farm level. A full economic analysis of the crop’s potential that considers production costs, transportation costs and market demand is needed before the practicality of a switchgrass agriculture for the MINK region can be established
5. Conclusions
1. Switchgrass yields are comparable, in agronomic terms, with yields of traditional annual grain crops under the current climate of the MINK region. 2. Under the RegCM climate change scenario
em-ployed here and characterized by increases in both temperature and precipitation, switchgrass yields increase over baseline levels for the entire MINK region. Yields of the traditional agricultural crops generally decrease in the eastern and southern por-tions of the region because of higher temperatures. Increases in precipitation in the western and cen-tral Great Plains improve yields of both switch-grass and the traditional crops over baseline and may, should they actually occur, increase this re-gion’s ability to sustain dryland agriculture. 3. Increases in atmospheric CO2increase yields for
all crops with soybean and winter wheat exhibit-ing the greatest response due to improvements in photosynthetic and water use efficiency. Because of improved water use efficiency, the C4 crops — corn, switchgrass and sorghum — are more re-sponsive to increased atmospheric CO2in the wa-ter scarce regions.
4. Switchgrass generally consumes more water than do the traditional crops under all climate condi-tions and also reduces runoff. Soil erosion rates under switchgrass cultivation are comparable to those under winter wheat and are generally lower than those under corn cultivation.
5. Simulated switchgrass yields for the MINK region were sufficiently good under both baseline and the RegCM climate change to suggest its promise as a biomass energy feedstock. Because switch-grass thrives in warmer temperatures, the crop may serve as an agricultural adaptation to climate change as well.
Acknowledgements
This study was supported by the Great Plains Re-gional Center, a component of the National Center for Global Environmental Change (NIGEC), US un-der Department of Energy Contract 62-123-6512. We thank Cesar Izaurralde and Elizabeth Malone of PNNL and Paul Dyke, John Ellis, Jimmy Williams, Jim Kiniry, Georgie Mitchell, Verel Benson and Raghavan Srinivasan of the Blacklands Research
Center Temple, Texas A & M University for techni-cal advice and modeling support. Dr. Ken Vogel of the University of Nebraska–Lincoln Agronomy De-partment provided the switchgrass experimental data used in model validation. Dr. Robert Ahrens of the National Soil Survey Center assisted us with soil clas-sification and taxonomy. Suzette Hampton provided stenographic assistance. We also thank the reviewers for their helpful comments and suggestions.
References
Anderson, B., 1989. Establishing Dryland Forage Grasses. NebGuide G81-543. Coop. Extension, Institute of Agriculture and Natural Resources, Univ. of Nebraska, Lincoln, Nebraska. Anderson, B., Shapiro, C.A., 1990. Fertilizing grass pastures and haylands. NebGuide G78-406. Coop. Extension, Institute of Agriculture and Natural Resources, Univ. of Nebraska, Lincoln, Nebraska.
Brown, R.A., Rosenberg, N.J., 1999. Climate change impacts on the potential productivity of corn and winter wheat in their primary growing regions. Clim.Change 41, 73–107.
Brown, R.A., Rosenberg, N.J., Easterling, W.E., Hays, C.J., 1998. Potential production of switchgrass and traditional crops under current and greenhouse-altered climate in the ‘MINK’ region of the central United States. Rep. No. PNWD-2432, Pacific Northwest National Laboratory, Washington, DC.
Brown, R.A., Rosenberg, N.J., 1997. Sensitivity of crop yield and water use to change in a range of climatic factors and CO2 concentrations: a simulation study applying EPIC to the central United States. Agric. For. Meteorology 83, 171–203. Brown, R.A., Rosenberg, N.J., 1996. The potential for biomass
energy production in the Missouri–Iowa–Nebraska–Kansas (MINK) region. In: Proc. of the 1995 Society of American Foresters Convention, Society of American Foresters, Bethesda, MD, pp. 204–209.
Easterling, W.E., Weiss, A., Hays, C.J., Mearns, L.O., 1998. Optimum spatial scales of climate information for simulating the effects of climate change on agrosystem productivity: the case of the US Great Plains. Agric. For. Meteorology 90, 51–63. Easterling, W.E., Rosenberg, N.J., McKenney, M.S., Jones, C.A., Dyke, P.T., Williams, J.R., 1992. Preparing the erosion productivity impact calculator (EPIC) model to simulate crop response to climate change and the direct effects of CO2. In: Rosenberg, N.J (Ed.), A Methodology for Assessing Regional Agricultural Consequences of Climate Change: Application to the Missouri–Iowa–Nebraska–Kansas (MINK) Region. Agric. and For. Meteorology 59, 17–34.
Giampietro, M., Ulgiatti, S., Pimentel, D., 1997. Feasibility of large-scale biofuel production. Bioscience 47, 587–600. Giorgi, F., Mearns, L.O., Shields, C., McDaniel, L., 1998. Regional
Graham, R.L., Downing, M., Walsh, M.F., 1996. A framework to assess regional environmental impacts of dedicated energy crop production. Environ. Manage. 20, 475–485.
Graham, R.L., Wright, L.L., Turhollow, A.F., 1992. The potential for short-rotation woody crops to reduce US CO2 emissions. Clim. Change 22, 223–238.
Hall, D.O., 1997. Biomass energy in industrialized countries — a view of the future. For. Ecol. and Manage. 91, 17–45. Hall, D.O., Mynick, H.E., Williams, R.H., 1993. Cooling the
greenhouse with bioenergy. Nature 353, 11–12.
Hall, D.O., Mynick, H.E., Williams, R.H., 1990. Carbon sequestration versus fossil fuel substitution: alternative roles for biomass in coping with greenhouse warming. Rep. No. 255. Center for Energy and Environmental Studies, Princeton University, New Jersey.
Kiniry, J.R., Sanderson, M.A., Williams, J.R., Tischler, C.R., Hussey, M.A., Ocumpaugh, W.R., Read, J.C., Van Esbroeck, G., Read, R.L., 1996. Simulating Alamo switchgrass with the ALMANAC model. Agron. J. 88, 602–606.
Kiniry, J.R., Spanel, D.A., Williams, J.R., Jones, C.A., 1990. Demonstration and validation of crop grain yield simulation by EPIC. In: Sharpley, A.N., Williams, J.R. (Eds.), EPIC – Erosion Productivity Impact Calculator, Model Documentation, USDA-ARS Tech. Bull. No. 1768, USDA-ARS Grassland, Soil and Water Research Laboratory, Temple, TX, pp. 220–234. Lowenberg-DeBoer, J., Cherney, J.H., 1989. Biophysical
simulation for evaluating new crops: the case of switchgrass for biomass energy feedstock. Agric. Systems 29, 233–246. McCarl, B. A., Chang, C., Atwood, J.D., Nayda, W.I., 1998.
Documentation of ASM: the US agricultural sector model. Dept. of Agric. Economics Technical Paper, Texas A&M University, College Station, TX.
Mearns, L.O., Mavromatis, T., Tsvetsinskaya, E., Hays, C.J., Easterling, W.E., 1999a. Comparative responses of EPIC and CERES crop models to high and low spatial resolution climate change scenarios. In: Giorgi, F. (Ed.), New Developments and Applications with the NCAR Regional Climate Model (RegCM). J. Geophysical Res. 104(D6), 6623–6646. Mearns, L.O., Easterling, W.E., Hays, C.J., 1999b. Comparison of
agricultural impacts of climate change calculated from high and low resolution climate model scenarios: Part 1. The uncertainty of spatial scale. Clim. Change, submitted.
Mearns, L.O., Giorgi F., Easterling, W.E., Weiss, A., 1996. Development of a nested regional model for the conterminous US and formation of high resolution climate change scenarios with an application to crop-climate models. In: Toward an Integrated Regional Research Program on Global Change and the Nation’s Major Grasslands, Report GPRC 96-01, Great Plains Reg. Center for Global Env. Change, Inst. of Agriculture and Nat. Resources, Univ. of Nebraska, Lincoln, NE, pp. 47–50. Mitchell, R., Moser, L., Anderson, B., Waller, S., 1994. Switchgrass and big bluestem for grazing and hay. NebGuide G94-1198-A. Coop. Extension, Institute of Agriculture and Natural Resources, Univ. of Nebraska, Lincoln, Nebraska. Moulton, R.J., Richards, K.R., 1990. Costs of sequestering carbon
through tree planting and forest management in the United States. US Dept. of Agriculture Forest Service Report GTR WO-58. Washington, DC.
Phillips, D.L., White, D., Johnson, B., 1993. Implications of climate change scenarios for soil erosion potential in the USA. Land Degradation and Rehabilitation 4, 61–72.
Ranney, J.W., Mann, L.K., 1994. Environmental considerations in energy crop production. In: Wright, L.L., Hohenstein, W.G. (Eds.), Dedicated Feedstock Supply Systems: Their Current Status in the USA, Biomass and Bioenergy 6, pp. 211–228. Reese, R.A., Aradhyula, S.V., Shogren, J.F., Tyson, K.S., 1993.
Herbaceous biomass feedstock production: the economic potential and impacts on US agriculture. Energy Policy 21, 726–734.
Richardson, C.W., Nicks, A.D., 1990. Weather generator description. In: Sharpley, A.N., Williams, J.R. (Eds.), EPIC – Erosion Productivity Impact Calculator, Model Documentation, USDA-ARS Tech. Bull. No. 1768, USDA-ARS Grassland, Soil and Water Research Laboratory, Temple, TX, pp. 93–104. Rosenberg, N.J., Scott, M.J., 1994. Implications of policies to
prevent climate change for future food security. Global Environ. Change 4, 49–62.
Rosenberg, N.J. (Ed.), 1993. A methodology for assessing regional agricultural consequences of climate change: application to the Missouri–Iowa–Nebraska–Kansas (MINK) region. Agric. and For. Meteorology 59, 1–127.
Rosenberg, N.J., McKenney, M.S., Easterling, W.E., Lemon, K.M., 1992. Validation of EPIC model simulations of crop responses to current climate and CO2 conditions: comparisons with census, expert judgement and experimental plot data. In: Rosenberg, A., Methodology for Assessing Regional Agricultural Consequences of Climate Change: Application to the Missouri–Iowa–Nebraska–Kansas (MINK) Region. Agric. and For. Meteorology 59, 35–52.
Rosenzweig, C., Curry, B., Ritchie, J.T., Jones, J.W., Chou, T.Y., Goldberg, R., Iglesias, A., 1994. The effects of potential climate change on simulated grain crops in the United States. In: Rosenzweig, C., Iglesias, A. (Eds.), Implications of Climatic Change for International Agriculture: Crop Modeling Study. Report EPA 230-B-94-003, United States Environmental Protection Agency, Office of Policy, Planning, and Evaluation, Washington, DC.
Rosenzweig, C., 1989. Potential effects of climate change on agricultural production in the Great Plains: a simulation study. In: Smith, J.B., Tripak, D. (Eds.), The Potential Effects of Global Climate Change on the United States, Appendix C, vol. 1. United States Environmental Protection Agency, Office of Policy, Planning, and Evaluation, Washington, DC
Sampson, R.N., Wright, L.L., Winjum, J.K., Kinsman, J.D., Benneman, J., Kürsten, E., Shurlock, J.M.O., 1993. Biomass management and energy. Water, Air and Soil Pollution 70, 139–159.
Sedjo, R.A., Solomon, A.M.,1989. Climate and Forests. In: Rosenberg, N.J., Easterling, W.E. III, Crosson, P.R., Darmstadter, J. (Eds.), Greenhouse Warming: Abatement and Adaptation. Resources for the Future, Washington, DC, pp. 105–119.
I. Modification of the EPIC model for climate change analysis. Agric. Systems 38, 225–238.
Stockle, C.O., Dyke, P.T., Williams, J.R., Jones, C.A., Rosenberg, N.J., 1992b. A method for estimating direct and climatic effects of rising atmospheric carbon dioxide on growth and yield of crops. Part II. Sensitivity analysis at three sites in the Midwestern USA. Agric. Systems 38, 239–256.
USDA-National Agricultural Statistics Service, 1983–1993. Crops County Data Database. Washington DC.
USDA, 1992. STATSGO — State soils geographic data base. Publication number 1492, Soil Conservation Service, Washington, DC.
Vogel, K.P., 1996a. Genetic variation among switchgrasses for agronomic traits, forage quality and biomass fuel production — Annual Report for 1995. Biofuels Feedstock Development Program, Oak Ridge National Laboratory, Oak Ridge, TN. Vogel, K.P., 1996b. Energy production from forages (or American
agriculture — back to the future). J. Soil and Water Conservation 51, 137–139.
Watterson, I.G., Dix, M.R., Gordon, H.B., McGregor, J.L., 1995. The CSIRO nine-level atmospheric general circulation model and its equilibrium present and doubled CO2 climates. Aust. Met. Mag. 44, 111–125.
Williams, J.R., 1995. The EPIC model. In: Singh, V.P. (Ed.), Computer models of watershed hydrology. Water Resources Publications, Highlands Ranch, CO, pp. 909–1000.
Williams, J.R., Dyke, P.T., Fuchs, W.W., Benson, V.W., Rice, O.W., Taylor, E.D., 1990. EPIC – erosion productivity impact calculator: users manual. In: Sharpley, A.N., Williams, J.R. (Eds.), EPIC – Erosion Productivity Impact Calculator, Model Documentation, USDA-ARS Tech. Bull. No. 1768, USDA-ARS Grassland, Soil and Water Research Laboratory, Temple, TX, 127 pp.


![Fig. 5. Yield deviations from baseline for corn, soybean, winter wheat and switchgrass under the RegCM climate scenario with[CO2] = 365 ppm.](https://thumb-ap.123doks.com/thumbv2/123dok/3163408.1386674/11.595.106.493.64.406/yield-deviations-baseline-soybean-winter-switchgrass-climate-scenario.webp)

