PROCESSING AND ANALYSIS OF HYPERSPECTRAL FINGERPRINTS TO
CHARACTERISE HAEMATITE OF SINGBHUM IRON ORE BELT, ORISSA, INDIA
T. Magendrana,* and S. Sanjeevib
a
Department of Civil Engineering, SRM University, Kattankulathur, India - [email protected]
bDepartment of Geology, Anna University, Chennai, India - [email protected]
KEY WORDS: Hyperspectral fingerprints, geochemical analysis, statistical analysis, iron ores grades, Singhbhum iron ore belt
ABSTRACT:
The demand for iron ore has been increasing in the recent years, thereby requiring the adoption of fast and accurate approaches to iron ore exploration and its grade-assessment. It is in this context that hyperspectral sensing is deemed as a potential tool. This paper examines the potential of hyperspectral fingerprints in the visible, NIR and SWIR regions of the EMR to assess the grades of haematite of the western Singhbhum iron ore belt of Orissa, eastern India, in a rapid manner. Certain spectro-radiometric measurements and geochemical analysis were carried out and the results have been presented. From the spectral measurements, it is seen that the strength of reflectance and absorption at definite wavelength regions is controlled by the chemical composit ion of the iron ores. It is observed that the primary spectral characteristics of these haematites lie in the 650-750nm, 850 to 900nm and 2130-2230nm regions. The laboratory based hyperspectral fingerprints and multiple regression analysis of spectral parameters and geochemical parameters (Fe% and Al2O3%) predicted the concentration of iron and alumina content in the haematite. A very strong correlation (R2=0.96) between the spectral parameters and Fe% in the haematite with a minimum error of 0.1%, maximum error of 7.4% and average error of 2.6% is observed. Similarly, a very strong correlation (R2=0.94) between the spectral parameters and Al2O3% in the iron ores with a minimum error of 0.04%, maximum error of 7.49% and average error of 2.5% is observed. This error is perhaps due to the presence of other components (SiO2, TiO2, P2O etc.) in the samples which can alter the degree of reflectance and hence the spectral parameters. Neural network based multi-layer perception (MLP) analysis of various spectral parameters and geochemical parameters helped to understand the relative importance of the spectral parameters for predictive models. The strong correlations (Iron: R2=0.96; Alumina: R2=0.94) indicate that the laboratory hyperspectral signatures in the visible, NIR and SWIR regions can give a better estimate of the grades of haematite in a rapid manner.
1. INTRODUCTION
While human civilization and mineral industry started simultaneously, metals and minerals have become the
backbone of any nation’s economy. This is the reason why
most of the countries first started searching for mineral resources. In the recent years there has been a rising demand for iron ores mainly for steel making companies and industries. The ores must be processed to extract the metals of interest from the waste rock and from the ore minerals. Iron ore is one of the most important components of human civilization. This paper is concerned with study of iron ores. According to the report by Credit Suisse in 2009, high demand from steel mills will bring about a global iron ore supply deficit of between 20 million and 25 million tons in the subsequent years. These facts show a rising demand for iron ores, thereby necessitating the adoption of rapid and accurate approaches to iron ore exploration and grade assessment. It is in this context that hyperspecral remote sensing is seen as a potential tool. Presently, there are many chemical analytical methods in determining the concentrations of iron content in the iron ores (Craig et al, 1996; Subrata and Venkatesh, 2009; Marjoribanks 2010; Hagemann et al, 1999; Gutzmer et al, 2006; Hagemann et al, 2007).
From the above discussion on the demand for iron ores, need for faster iron ore exploration and grade estimation and the spectral characteristics of iron ores, it is obvious that remote sensing can be a potential tool for iron ore mapping. The materials show their characteristic reflectance and absorption spectra in general and iron ores in particular wavelength region. The strength and pattern of reflectance and absorption
in particular wavelength in Electro Magnetic Radiation (EMR) spectrum is controlled by the physic-chemical nature of the materials. Based on this analogy, this research work was undertaken to study the spectra of iron ores of iron ore deposits and the aim was designed and objectives were formulated. The aim of this paper is to study the potential of hyperspectral fingerprints in the VNIR-SWIR wavelength regions, to characterize the grades of iron ores of Noamundi and Joda mines of Jharkhand of singhbhum iron ore belt.
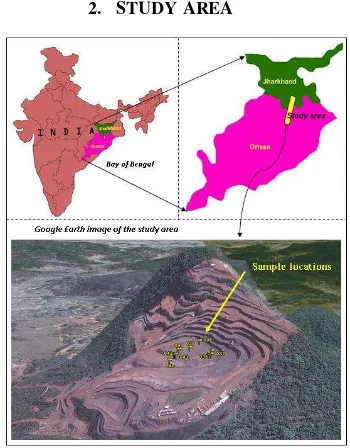
2. STUDY AREA
Figure 1. Key map showing the location of the study area
* Corresponding author. Email: [email protected]
The International Archives of the Photogrammetry, Remote Sensing and Spatial Information Sciences, Volume XL-8, 2014 ISPRS Technical Commission VIII Symposium, 09 – 12 December 2014, Hyderabad, India
This contribution has been peer-reviewed.
The study area comprises of the mining towns of Noamundi and Joda in the western Singhbhum district in the Indian state of Jharkhand and Orissa. The study area lies about 125km from Jamshedpur city and 64km from Chaibasa town. The major product of the mines is iron ore (including blue dust-a high grade variety). Hematite ores of the Iron Ore Group in the Noamundi area are hosted by extensive, 220 m thick Banded Iron Formation (BIF) in a folded greenstone belt succession of Paleoarchean age (Nicolas et al, 2008). The quality of iron ores in the Noamundi region varies from low to high-grade and includes banded hematite jasper, ferruginous shale, brown powdery ore (brown dust) and blue dust. Figure 1 is a map showing the location of the study.
3. METHODOLOGY
The methodology adopted in this study includes laboratory based hyperspectral radiometry, field studies, geochemical analysis and statistical analysis to characterize iron ores. The laboratory based hyperspectral radiometric experiments carried out includes, generation of laboratory spectral fingerprints in the VNIR and SWIR regions for different iron ore samples of Noamundi and Joda mines, extraction of various spectral parameters for all the samples, analysis of spectral fingerprints of iron ore samples, description of spectral parameters and their characteristics results of the geochemical analysis of various iron ore samples and generation of empirical models using geochemical and spectral parameters by statistical tools.
Iron ore samples were collected from various parts/sampling points of iron ore mines of Noamundi and Joda of Singhbhum iron ore belt. The samples were collected in such a way that they represent the high grade, average grade and low grade ores. Figure 2 shows some of the collected iron ore sample blocks and lumps and powders (Blue dust). For each of the grade, hard, friable and soft ore samples were collected from the mine face. Care was taken to collect samples of different size fractions such as large blocks; medium lumps and the fine blue dust.
The approach to iron ore characterization and grade estimation includes hyperspectral radiometry, which is an offshoot of spectroscopy. Spectroscopy is the study of light as a function of wavelength that has been emitted, reflected, or scattered from a solid, liquid, or gas. The principles of spectroscopy are applied
to study many minerals and materials. Reflectance spectroscopy is a tool where electromagnetic radiation can be used to probe a surface and, through the absorption features in the spectrum, it can be used to identify materials.
Further, the sample needs no preparation, and with modern portable instruments, high quality reflectance spectra of a sample can be obtained in just a few seconds. Accurate abundances are usually difficult to determine with reflectance spectroscopy, but approximate thresholds can be determined (Malthus & Madeira, 2003) and (Clark, 1999). In a study related to prediction of soil organic carbon (SOC) content using certain key parameter were used in evaluating the quality of soils (Aichi et.al, 2009) and (Lyder, 2010). Taking clue from these works, many spectral parameters were derived from the spectra of various iron ores and they were analyzed. The spectral measurement of various hematite samples done with the VNIR-SWIR Spectro-radiometer are shown in the figures 3. Generally, the samples with bright red colour show a high reflectance in the 700nm-750nm and a gradual fall in the NIR region.
The spectral finger prints of different iron ore samples collected, which exhibit maximum absorption from 850 nm to 900 nm and maximum reflectance (peak) in the 680-720 nm wavelength regions. Sample 1A-BD (Blue Dust) has a maximum absorption in the 850–900 nm region and sharp peak at 680-720 nm, while sample 1B-SH (Shale) has the least NIR absorption. This is perhaps due to the difference in the concentration of iron oxide in the two samples. Further, the alumina absorption for the 1B-SH (Shale) sample is greater in the 2200 nm region than for the other samples.
Thus, it may be seen that the strength and pattern of absorption and reflectance in particular wavelength regions of the spectral curves and the slope of the curve in certain wavelength regions depend on the chemical composition. From these observations, it is clear that by the use of hyperspectral radiometry in the VNIR-SWIR region, it is possible to decipher the geochemistry and evaluate the grades of iron ores. To achieve this, various spectral parameters have been extracted from the spectra.
Since this study aims to relate the chemical composition of the ores to the spectral response, geochemical analysis is an essential step. Standard procedure adopted for ore samples were used to determine iron oxide content in the iron ore samples. All these samples were powdered to less than 63 Figure 2. Various types of iron ore samples collected
from the study area
Figure 3. Various types of iron ore samples collected from the study area The International Archives of the Photogrammetry, Remote Sensing and Spatial Information Sciences, Volume XL-8, 2014
ISPRS Technical Commission VIII Symposium, 09 – 12 December 2014, Hyderabad, India
This contribution has been peer-reviewed.
micron size and analyzed by XRF techniques. The empirical models using various spectral and geochemical parameters have been generated to predict/quantify ore grade from spectral fingerprints. To achieve this, geostatistical methods were used to understand the relationship between the results of spectral fingerprints and geochemical analysis is examined. The existence or absence of well-defined relationship will validate or disprove the potential of hyperspectral radiometry in estimating the grade of iron ores. Accordingly, the relationship between all the spectral parameters and the geochemical parameters (Fe%, Al2O3%) of the iron ores are discussed in the next section.
4. RESULTS AND DISCUSSION
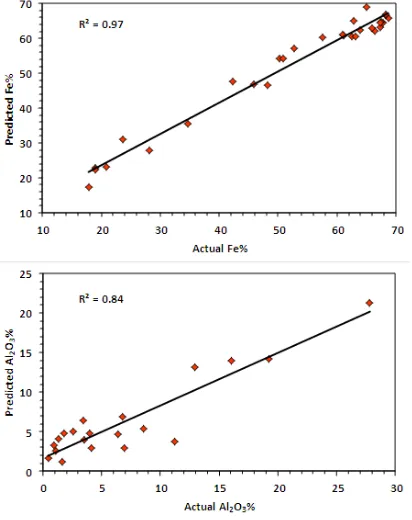
Different iron ore samples from Noamundi and Joda mines of Singhbhum iron ore belt, closed door spectral measurements and geochemical analysis were carried out in the laboratory. It was observed that the primary spectral characteristics of these iron ores lie in the 850-900nm and 2150-2250nm regions, and various key spectral parameters were derived from these iron ore spectra. The observations of the laboratory based hyperspectral studies and multiple regression analysis of the key spectral parameters and geochemical parameters predicted the concentration of iron and alumina content in the iron ores. A very strong correlation (R2=0.96) between the spectral parameters and Fe% in the iron ores with a minimum error of 0.1%, maximum error of 7.4% and average error of 2.6% is observed. Similarly, a very strong correlation (R2=0.94) between the spectral parameters and Al2O3% in the iron ores with a minimum error of 0.04%, maximum error of 7.49% and average error of 2.5% is observed. This error is perhaps due to the presence of other components (SiO2, TiO2, P2O etc.) in the samples which can alter the degree of reflectance and hence the spectral parameters.
Figure 4 shows the actual and predicted Fe% and Al2O3% of the iron ore samples with good correlation (R2=0.97; R2=0.84) respectively. Neural network analysis of various spectral parameters and geochemical parameters helped to understand the relative importance of the spectral parameters for predictive models.
Apart from the quantitative studies of iron ores, certain qualitative spectral parameters such as position of NIR absorption trough and position of VNIR peak indicate that there is a shift in the position of the NIR absorption trough and VNIR reflectance peak towards longer wavelength with decrease in iron content in the iron ore samples.
5. CONCLUSIONS
This study based on the empirical analysis of spectral and geochemical parameters, shows a very strong correlation is seen as between the spectral parameters and iron content in the iron ore samples with R2 value of 0.923 with 2.6% average error of estimation. Similarly, strong correlation exists between the spectral parameters derived in the alumina absorption region and Al2O3% with R2 value of 0.945 with 2.5% average error of estimation. The multilayer perception in the neural network analysis of spectral and geochemical parameters helped to understand the relative importance of the spectral parameters for predictive models. Consequently, it can be concluded that hyperspectral fingerprints in the visible and VNIR and SWIR regions can be used for estimating different iron ore grades in a rapid manner and as an alternative to the traditional methods. Further, it can be concluded that hyperspectral remote sensing is a very effective and advanced tool in characterizing the grades of iron ores especially in the VNIR and SWIR region of electromagnetic radiation.
References
Aichi, H, Fouad, Y, Walter, C, Viscarra Rossel, RA, Sanaa, ZLCM., 2009. ‘Regional predictions of soil organic carbon
content from spectral reflectance measurements’, Biosystems
Engineering, vol. 104, pp. 442-446.
Clark, RN., 1999. ‘Chapter-1: Spectroscopy of rocks and
minerals, and principles of spectroscopy’, Remote Sensing for
the Earth Sciences, Manual of Remote Sensing (3rd ed.), vol. 3, John Wiley & Sons, New York, pp. 3-58.
Craig A, Hancock K and Chang, EA., 1996. Controlled trial for stuttering in persons aged 9 to 14 years, Journal of Speech and Hearing Research 39: pp. 808–826.
Hagemann S, Dalstra HI, Hodkiewicz P, Flis M, Thorne W and McCuaig C., 2007. Recent Advances in BIF-related Iron Ore
Models and Exploration Strategies’ proceedings of Decennial International Conference on Mineral Exploration: pp. 811-821. Figure 4. Plots show the actual vs predicted Fe%
and Al2O3% of the iron ore samples of the
study area.
The International Archives of the Photogrammetry, Remote Sensing and Spatial Information Sciences, Volume XL-8, 2014 ISPRS Technical Commission VIII Symposium, 09 – 12 December 2014, Hyderabad, India
This contribution has been peer-reviewed.