Analysis of landslide hazard area in Ludian earthquake based on Random Forests
XIE Jing-chun a, LIU-Rui a,*, LI Hui-wen a, LAI Zi-li b
a. College Of Geophysics,Chengdu University of Technology,Chengdu 610059,China - [email protected] b. College of Earth Sciences,Chengdu University of Technology,Chengdu 610059,China [email protected]
KEY WORDS : Landslide; Random Forest; Evaluation factors; Generalization error; ROC graphs
ABS TRACT:
With the development of machine learning theory, more and more algorithms are evaluated for seismic landslides. After the Ludian earthquake, the research team combine with the special geological structure in Ludian area and the seismic filed exploration results, selecting SLOPE(PODU); River distance(HL); Fault distance(DC); Seismic Intensity (LD) and Digital Elevation M odel(DEM ), the normalized difference vegetation index(NDVI) which based on remote sensing images as evaluation factors. But the relationships among these factors are fuzzy, there also exists heavy noise and high-dimensional, we introduce the random forest algorithm to tolerate these difficulties and get the evaluation result of Ludian landslide areas, in order to verify the accuracy of the result, using the ROC graphs for the result evaluation standard, AUC covers an area of 0.918, meanwhile, the random forest’s generalization error rate decreases with the increase of the classification tree to the ideal 0.08 by using Out Of Bag(OOB) Estimation. Studying the final landslides inversion results, paper comes to a statistical conclusion that near 80% of the whole landslides and dilapidations are in areas with high susceptibility and moderate susceptibility, showing the forecast results are reasonable and adopted.
1. INTRODUCTION
Landslides are globally widespread phenomena, causing a significant number of human loss of life and injury, as well as extensive economic damages to private and public properties (Andrea Cimpalini, 2014). Strong earthquake often triggered a large number of landslides, the secondary disasters caused a greater loss than earthquake itself (LI Zhong-sheng, 2003), early in the 1960s, some western developed countries have begun to study earthquake landslide as the main body of the geological disaster research (Carrara A, 1983). With the development of technology, machine learning is gradually being introduced in the field of geological disaster prevention, multivariate statistical analysis (Saro Lee, 2002), artificial neural networks (Biswajeet Pradhan, 2007), fuzzy mathematics (Chung C F, 2008c) and other models have received a specific practice, although these new theories provide us more ideas and methods, but the seismic landslide evaluation is still a worldwide problem, gives us heavy disasters.
At 16:30 pm on August 3, 2014, Ludian County occurred M s 6.5 earthquake, the epicenter was located at 27.1 ° N, 103.3 ° E, from the China Seismological Bureau released Ludian seismic intensity map view, the meizoseismal area intensity reached IX, on the other hand, the USGS released the PGA of Ludian
earthquake, showing the meizoseismal area’s PGA reached
948.5 cm/s2, this seismic explosive. By the end of August 7, 2014, Ludian earthquake caused 615 people were killed and thousands of people were injured, it brought serious economic losses (Zhang Zhen-Guo, 2014). According to the field exploration results, 637 landslide points were marked, among them, the biggest landslide in a volume of 1.68*107 m3, in
addition, the landslide blocked the NiuLanJiang River and formed a barrier lake. There are various landslide distribution along the road reducing the speed of the rescue seriously. The landslide threatening earthquake rescue personnel and the local
people’s life and property safety, hence, without doubt,
carrying out the analysis of earthquake landslide risk in Ludian is imminent and valuable for post-disaster relief and reconstruction.
2. S TUDY AREA
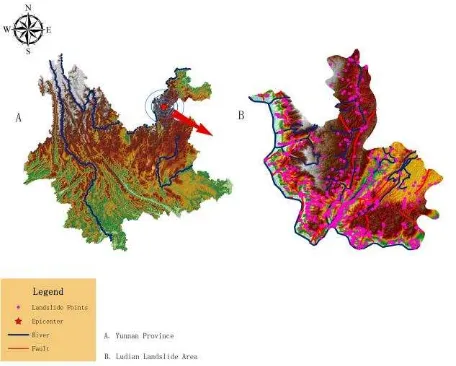
mostly based on those significant characteristics: 01h, D3, p2β3 rock, complex geological structure, loose rock and soil structure, low shear strength and weathering resistance. With the arrival of the rainy season, the probability of inducing serious secondary disasters like landslide will increase sharply. Yunnan Province and Ludian landslide area in Figure 1.
Figure 1. Yunnan Province and Ludian landslide area
3. DATA AND METHODS
3.1 Data
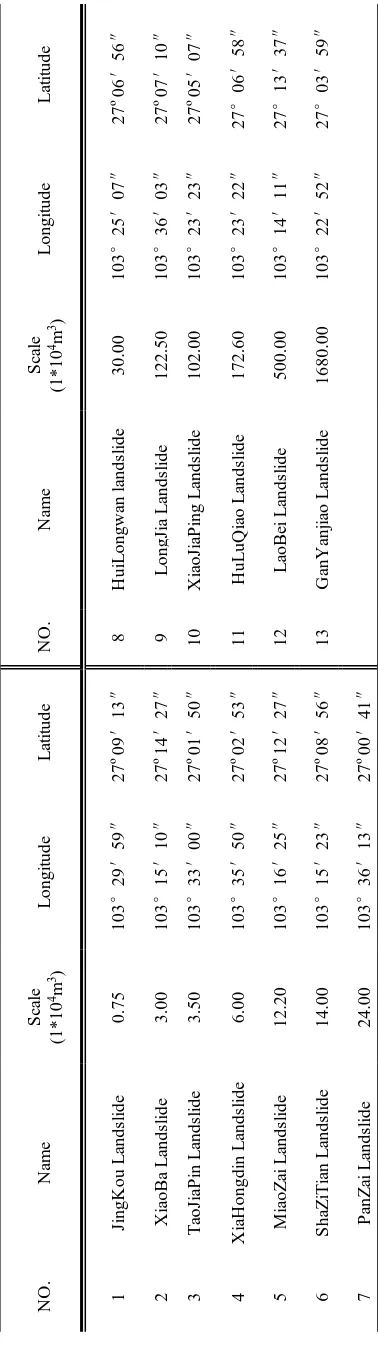
Landslide data used in the study from filed exploration, a total of 637 landslide points, part of landslide data as shown in Table 1. Remote sensing data from China's comprehensive national earth observation data sharing platform, these images consist of 91 images, including GF-1, KZ-1, Landsat-8, ZY-02C, ZY-3 satellites data come to 89, meanwhile, Geological map of Ludian area from the development research center of China geological survey, the local meteorological data from the national meteorological information center, the rest of the data such as drainage from Chengdu university of technology archives.
3.2 Method
Random Forests algorithm was proposed by Leo Breiman in 2011. Random Forests are an effective tool in prediction and they do not overfit. In addition, this algorithm is more robust with respect to noise and outliers and it has strong generalization ability (Breiman Leo, 2001). The algorithm use resampling method to extract multiple samples from the original sample and modelling of these samples by using decision tree
(Breiman Leo, 1984), then combine the decision trees’ predicted
results, the final results are obtained by voting. Experimental
Equation (1) indicates that the random forests algorithm is the use of voting to determine the final classification. On
M argin function is used to measure the model’s Reliability, The higher the function value, the greater the model reliability , then, we can deduce the generalization error formula: equation (3)
,
(
( , )
0)
X Y
PE
P
mg X Y
(3)Breiman proved that with the increase of the decision tree
classification model,
h X
k(
)
h X
k( ,
k)
subject to the Strong Law of Large Number, meanwhile, he proved that as thenumber of the decision making unit increases, all sequences
k andPE
almost everywhere convergence on equation (4)In fact, in terms of the data we use is nonlinear, on the other hand, the relationships among these factors are fuzzy, Breiman wrote in Random Forests: the random forests algorithm does not overfit because of the Strong Law of Large Number (Breiman Leo, 2001). In other words, the random forest obvious advantages in processing large quantity, while this algorithm can easily adapt to this nonlinear effects, in addition, it is more about robust with respect to noise and outliers, that is the reason why we choose random forests.
4. RES ULTS AND CONCLUS ION
We use the Random Forests algorithm to build Ludian earthquake landslide risk analysis model, experiments were performed using the related computer program. As mentioned previously , selecting SLOPE (PODU); River distance (HL); Fault distance (DC), Seismic Intensity (LD) and Digital Elevation M odel (DEM ), the normalized difference vegetation index (NDVI) which based on remote sensing images as evaluation factors. These factors have different effects on the final results, through the concrete algorithm, we obtain figure 2.
Figure 2. Each factor’s effects on the final results
The research team choose ROC graphs to evaluate the reliability of the model prediction results. Receiver operating characteristics (ROC) graphs are useful for organizing classifiers and visualizing their performance, and in recent years have been used increasingly in machine learning and data mining research (Tom F, 2006). When the area under the ROC curve (AUC) close to 0.5, predicted no meaning; when AUC is smaller than 0.7, the forecast accuracy is lower; when the AUC ranged between 0.7 and 0.8, the accuracy of prediction is acceptable; between 0.8 to 0.9, the forecasting accuracy is higher; when AUC is greater than 0.9, the accuracy of prediction is very high (Hosmer D W, 2000). The experimental ROC graphs and the generalization error as shown in figure 3.
L
0.75 3.00 3.50 6.00 12.20 14.00 24.00
Figure 3. ROC graphs and the generalization error
You can clearly see from the left image, AUC area reached 0.918, greater than 0.90, while the right panel shows the generalization error rate, with the increase of trees, the generalization error down to 0.05, it is an ideal result, these two results prove that the experimental result is accurate and effective.
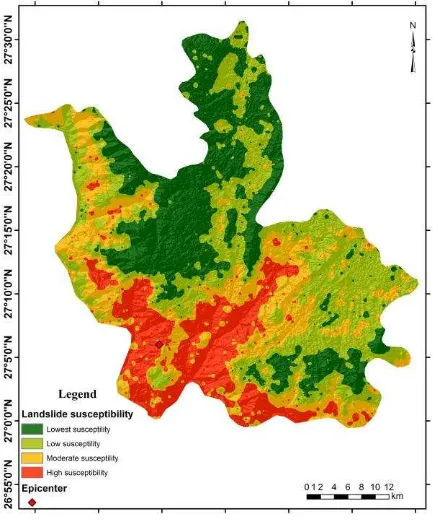
We divide the results to four levels according to 0-0.25, 0.25-0.50, 0.50-0.75, and 0.75-1.00 classification standard: Lowest susceptibility zone (green); Low susceptibility zone (light green); M oderate susceptibility zone (yellow); High susceptibility zone (red). The landslide susceptibility map is illustrated as in figure 4.
Overall the result shows that the high risk zone of red is relatively concentrated, reflected as zonal distribution, showing a certain convergence. Can believes examine the effect of disaster risk assessment model should take into account two aspects: first, the risk of a large number of disaster areas appear as much as possible ; second , the risk of a large regional area as small as possible (can T, 2005). According to our statistical result, 270 points of 617 fall on high risk area, the ratio is 43.76%, while the zone of yellow has 205 points, a ratio of 33.23%, which means that a total of 76.99% of all points fall higher (high) susceptibility zones, combined with Can’s theory, the landslide susceptibility result is accurate.
Therefore, this result is also available for the relevant departments for reference, at the same time, we suggest: the people and rescue personnel should leave the red area as soon as possible; disaster mitigation department should start suspicious landslide investigation as early as possible.
ACKNOWLEDGEMENTS
This work was supported by Foundation of Sichuan Educational Committee (No.14ZB0071), Science & Technology Department of Sichuan Province Technology Support Program (No.2012FZ0018) and Research Center of Petroleum Development of Sichuan Province (No.SKB10-11). The authors would also like to express appreciations to the stuffs in their lab for their valuable comments and other help.
Figure 4. Landslide susceptibility map of Ludian earthquake area
REFERENCES
Andrea Cimpalini, Federica Bardi, Silvia Bianchini, 2014. Analysis of building deformation in landslide area using multisensory PSInSARTM technique. International Journal of Applied Earth Observation and Geoinformation 33 (2014), pp. 166–180.
LI Zhong-sheng, 2003. The State of the Art of the Research on Seismic Landslide Hazard at Home and abroad. Journal of Ctastrophology 18(4), pp.64-70.
Carrara, A, 1983. M ultivariate models for landslide hazard evaluation. M athematical Geology 15(3), pp.03-426.
Saro Lee, Ueechan Chwae, Kyungduck M in, 2002. Landslide susceptibility mapping by correlation between topography and geological structure: the Janghung area, Korea. Geomorphology 46(3-4), pp.149-162.
Biswajeet Pradhan, Saro Lee, 2007. Utilization of optical remote sensing data and GIS tools for regional landslide hazard analysis using an artificial neural network model. Earth Science Frontiers 14(6), pp.143-152.
Chung, C F, Fabbri, 2008. A Predicting landslides for risk analysis-Spatial models tested by a cross-validation technique. Geomorphology 94(3-4), pp.438-452.
FAN Jie, WANG Chuansheng, TANHG Qing, 2014. Comprehensive geographic analysis and discussion on st rategies for post-earthquake recovery and reconstruction in Ludian, Yunnan Province. Progress in Geography 33(8), pp.1011-1018.
Leo Breiman, 2011. Random Forests M achine learning, 45, pp.5-32.
Breiman L, Friedman J H, Olshen R A, et al, 1984. Classification and regression trees. M onterey, CA: Wadsworth & brooks/cole advanced books & software
FANG Kuang-nan, WU Jian-bin, ZHU Jiang-pin, 2011.A Review of Technologies on Random Forests. Statistics & Information Forum 26(3), pp.32:38.
Breiman L, 1996. Bagging Preditors. M achine Learning 24(2), pp.123-140.
Tibshirani, R, 1996. Bias, variance, and prediction error for classification rules. Technical Report.
Wolpert, D. H. & M acready, W. G, 1997. An efficient method
to estimate Bagging’s generalization error. M achine Learning (in press).
Tom F, 2006. An introduction to ROC analysis. Pattern Recognition Letters 27, pp.861-874.
Hosmer D W, Lemeshow S, 2000. Applied Logistic Regression. 2nd [M ]. New York: John Wiley & Sons, Inc. 2000: 156-164