CREATING PRODUCT MODELS FROM POINT CLOUD OF CIVIL STRUCTURES
BASED ON GEOMETRIC SIMILARITY
N. Hidakaa, *, T. Michikawab,c, N. Yabukia, T. Fukudaa, A. Motamedia
a Division of Sustainable Energy and Environmental Engineering, Osaka University, Suita, Osaka, Japan [email protected], (yabuki, fukuda, motamedi)@see.eng.osaka-u.ac.jp
b Center for Environmental Innovation Design for Sustainability, Osaka University, Suita, Osaka, Japan c Photonics Control Technology Team, RIKEN, Wako, Saitama, Japan
KEY WORDS: Point Cloud, CIM, Geometric Similarity, Surface Reconstruction
ABSTRACT:
The existing civil structures must be maintained in order to ensure their expected lifelong serviceability. Careful rehabilitation and maintenance planning plays a significant role in that effort. Recently, construction information modelling (CIM) techniques, such as product models, are increasingly being used to facilitate structure maintenance. Using this methodology, laser scanning systems can provide point cloud data that are used to produce highly accurate and dense representations of civil structures. However, while numerous methods for creating a single surface exist, part decomposition is required in order to create product models consisting of more than one part. This research aims at the development of a surface reconstruction system that utilizes point cloud data efficiently in order to create complete product models. The research proposes using the application of local shape matching to the input point clouds in order to define a set of representative parts. These representative parts are then polygonized and copied to locations where the same types of parts exist. The results of our experiments show that the proposed method can efficiently create product models using input point cloud data.
1. INTRODUCTION
In Japan, many civil structures were built 40 or 50 years ago and are now approaching the end of their estimated service lives. Hence, the maintenance of existing civil structures is important. However, for economic reasons, it would be difficult to replace all of them, and the relevant authorities are now investigating ways to prolong structural serviceability.
The use of information technology (IT) is efficient for the maintenance of civil structures. This is because, unlike conventional approaches depend on two-dimensional (2D) drawings, it provides better data aggression and management opportunities. In particular, product models are easy to understand and to use for managing maintenance information. For example, they can provide visualization for managing defects such as cracks and corrosions. Indeed, several construction companies have begun using product data not only during construction, but also for maintenance. This methodology is known as Construction Information Modelling (CIM) (Yabuki, 2012) inspired by Building Information Modeling (BIM) (Lee et al., 2006).
However applying CIM techniques to existing infrastructures can be difficult. The primary issue is to find methods to create appropriate product models. Since the structures were constructed many decades ago, applicable product models do not exist, and manual modelling involves significant time and cost expenditures.
Another option to create product models is the use of laser scanning technology, which can give us “as-built” models of the civil structures in the form of point cloud data. These geometric models, or polygon data, can be computed from point clouds
using surface reconstruction algorithms (See a survey done by Berger et al., 2014). However, these methods usually create a single surface from the point cloud data. Thus, additional part decomposition is required. Although methods that can be used to decompose point cloud data already exist (such as, Adan et al., 2013), they have specific and require inefficient preparations such as machine learning.
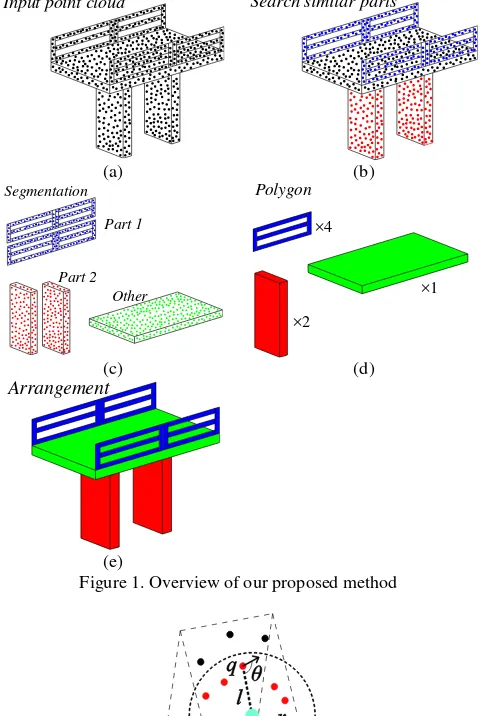
In this paper, we propose a method for creating product models from the point cloud data of existing civil structure. The primary idea is to use shape matching technology (Attene et al., 2010) to decompose the input data into parts. This is due to the fact that the civil structures are often composed of similar element types that are repeated. Similar parts are then recognized as equivalent objects and they are represented by a single instance. Our method consists of three major steps. First, the input point clouds are decomposed into several parts based on geometric similarity. Second, polygon data are created from the representative parts. Third, the polygon data are arranged based on the input point cloud.
The main advantage of this method is its ability to simplify the modelling process by using local shape matching. Our method performs best to model cases with repetitive identical parts, such as most of civil structures. This approach has the potential to handle incomplete point cloud data and reuse the results for other similar data sets. Moreover, our method can use several input point cloud data generated by different devices.
2. RELATED WORK
(2013) proposed a method for creating Building Information Model (BIM) of a school building using point cloud data.
In order to enhance the accuracy of the point cloud accuracy, several point clouds from various viewpoints are adjusted to one point cloud. To accomplish this, the input point cloud was first decomposed into primitive surfaces. Support Vector Machine learning (SVM) is then used for recognizing wall, floors, ceilings and clutters. Next, surface parts, such as walls, were reconstructed at full scale. Finally, a BIM model including surface parts such as walls and openings, and windows and doorways was created. The resulting recall ratios of the actual building were about 80%. However, one of the walls was shorter than the others, presumably due to occlusion caused by objects such as tables and shelves.
In another example, Matsuoka et al. (2014) proposed a method for creating product models from the point cloud of plumbing within a plant. In our method, simple parts, such as surfaces or pillars, were first detected. Then, the rest of the parts, such as tee, elbow, or torus components, were estimated using positional relations. The resulting recall ratios for surfaces and pillars were about 80%, and about 60% for all other parts.
Nan et al. (2012) proposed a method for decomposing cluttered indoor point cloud data into furniture by replacing polygons with the most similar types in the database. In this method, the input point cloud was first roughly decomposed into level or curved surfaces. Next, several surfaces were combined into furniture using machine learning. As a result, recognition ratios of tables and chairs were over 90% in their experiments. similar parts and their representative parts are polygonised. Next, the method places the replication of the representative part in the matched target region of the model, automatically. Figure 1shows an overview of proposed method.
First, similar parts are located using a local shape matching
Next, we divide the point cloud into similar and unrelated parts (Figure 1(c)). In the third step, representative parts are identified and polygonised (Figure 1(d)). These polygons are copied to locations where the same types of parts exist. (Figure 1(e)). In this result, one input point cloud is translated into several polygons. We will explain this process in detail in the next section.
3.2 Clustering by similarity
Geometric similarity is evaluated by invariants called descriptor. The descriptor is an invariant of the shape usually defined by low-dimensional vectors. We use the shape context descriptor (Mori et al., 2005). This is a normalized 2D histogram consisting of length l and angle between arbitrary point pairs
(Figure 2). Note that this descriptor is designed for whole shape matching whereas our purpose is local shape matching. We calculate this for each subset of the point cloud in the region defined by a sphere with radius r (Figure 3(a)).
Similarity between two descriptors are evaluated by the square root of the products of coefficients as shown in Equation 1
0 1
where Hij denotes a coefficient of the histogram.
Since we define the descriptor for all points, the computational load of similarity evaluation becomes high. We introduce an efficient pruning of the descriptors inspired by Attene et al., (2010). Figure 3 shows an overview of the procedure. First the keypoints of the input point cloud are chosen. Second, one of the keypoints is chosen at random to serve as “seed point”. Third, similar regions to the seed region are searched. Here unsimilar points are rejected in order to reduce the computational load. We repeat this procedure with gradually enlarging radii until all seed points are examined.
Input point cloud Search similar parts
Figure 1. Overview of our proposed method
plane: 3
plane: 1
plane: 2
Point plane: 3
(a) (b) (c)
Figure 4 Overview of searching keypoints method
Since it would be highly inefficient to use every point in the same manner as the seed points, we limited seed point selection to keypoints, which we defined as intersection points of three surfaces. Figure 4 shows an overview of this method.
First, region growing is used to cluster the surfaces of the input point cloud (Ballardet al., 1982). Region growing is a method that identifies region based on certain defined conditions. Planer region can be extracted by this method. Next, we extract keypoints or unique points of the point clouds. The unique points appear at the corner of the models. In order to detect them, we evaluate the number of clusters in the spherical supports. For each point, we define sphere with radius r, and check how many clusters are in the sphere. In case of 1 and 2, the region are considered as plane and sharp edges, respectively. Yet, corners must have 3 or more clusters (Figure 4(a)). Since this computation is applied to all the points, many neighbouring points are recognized as corner points (Figure 4(b)). We select the closest to the average points of the clusters as the keypoints (Figure 4(c)).
3.3 Part decomposition and polygonization
The result of clustering of a single point cloud, and we decompose this into individual parts using connected component labelling. The graph is constructed when the point pairs are enough near (<r) (Figure 5). Figure 6 shows the result of decomposition. After dividing the data, we choose representative parts and polygonise them by common surface reconstruction algorithms (e.g. Poisson surface reconstruction (Kazhdan, et al., 2006).
3.4 Alignment into point cloud
The final step is to align the representative polygons into the point cloud (Figure 7) by iterative closest point (ICP) algorithm (Besl and McKay, 1992). ICP yields a good result when good initial alignment is given. In this research, correspondence
Figure 5. Graphical description of decomposition by Euclidean distance
Figure 6. Result of decomposition.
×f
(a) (b)
Figure 7. Graphical description of ICP
between similar objects are already established and this can be used for initial alignment. In ICP, closest points are chosen as candidates of corresponding points and rigid transformation between corresponding points are computed in the least square manner.(Figure 7(b)). ICP iterates this process until the error between the points are locally minimized.
4. EXPERIMENTAL VALIDATION
4.1 Experiments
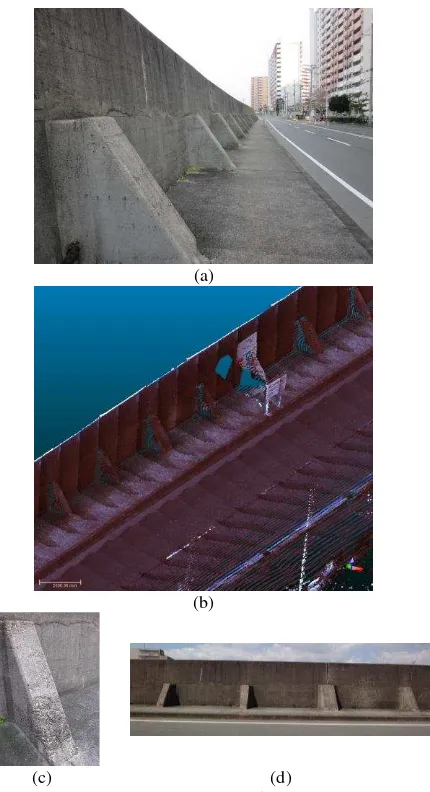
We conducted an experiment in which a point cloud data was applied to a harbour breakwater located alongside the Naruo River in Nishinomiya City, Hyogo Prefecture, Japan. The scanned area of the breakwater was 100 m long and approximately 3 m high. Scanning was performed by mobile mapping systems (MMS). Figure 8(a) shows a photograph of the breakwater, and Figure 8(b) shows the point cloud. The laser scanner used on the MMS was using the time-of-flight method. The number of scanned points was 1,107,956 and the average distance between points were 3 - 6 cm.
Two different supports with different sizes can be seen in Figure 8(c) and (d). A pentagon-shaped loss was found to have occurred due to a blockage by a billboard. In our experiment, unnecessary data such as trees and buildings were manually removed from the raw scanned data. Additionally, since it was not necessary to examine the surface parts of walls and roads to determine whether they could be considered similar, they were automatically clustered using region growing (Figure 9). After these preparations, the number of points in the input cloud was reduced to 141,270.
In our experiment on local similarity shape matching, a range of radii r and a threshold of degree of similarity d were set. (a)
(b)
(c)
(a)
(b)
(c) (d)
Figure 8. Experimental target
Figure 9. Surface-part clustering result
4.2 Results
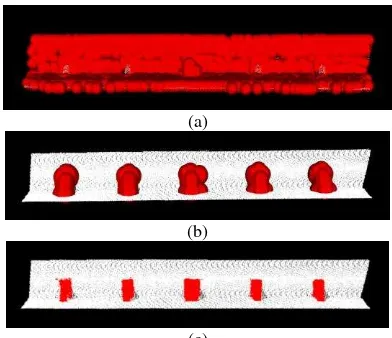
First, we searched for input point cloud keypoints. Figure 10 shows the keypoints sampling results. 19 keypoints are detected in our case study and selected as seed points.
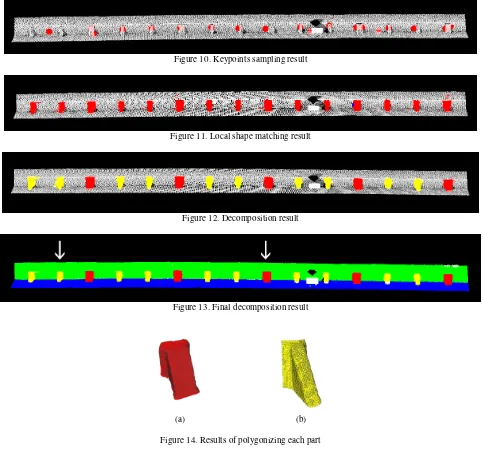
Second, we searched for similar parts. Figure 11 showsresults of local shape similarity matching when r is set as 1.2 and d as 0.8. After first decomposition of the point cloud of all similar parts, it was further decomposed into two types of parts, as shown in Figure 12. Ultimately, the input point cloud was decomposed into five types of parts (Figure 13) and 18 parts are decomposed.
Third, we decomposed the results into stand-alone parts and representative parts for polygonization. Representative parts are indicated by arrows in Figure 13. Figure 14 shows results polygonizing the representative parts.
Fourth, we translated the resulting polygons into a point cloud by using parallel translation and ICP. Figure 15 shows the results of polygonizing each part and their arrangement.
Computation of local similarity shape matching took 53.492 sec. Other computations took less than 1 sec. We used a common PC (Intel Core™ i5-3570K CPU @ 3.40 GHz) in this experiment.
4.3 Discussion
While our method, which was designed to find similar parts from an input point cloud via a local shape matching technique, was able to roughly decompose the point cloud into parts, it was not able to completely classify two types of parts. Since this method used spheres, decomposed parts often had extra points outside of the part.
In this experiment, extra points were located on the surface parts such as walls and roads and resulted from the parts having decomposed over time. However, in order to accept various point clouds, it will be necessary to devise a method of rejecting the extra points of such parts.
Additionally, it should be noted that this harbour area runs along a slope, and that breakwater height gradually decreases. This low-height region was not used for our experiment. However, since such civil structures exist and must be taken into consideration, it will be necessary to broaden, magnify, or shrink point cloud data or polygons in the future.
5. CONCLUSION
In this study, we proposed a method that can be used to efficiently create product models from the point cloud data of civil structures. Our primary idea was to find similar parts via local shape matching and translate those into the same polygons. We evaluated our method using the point cloud of a harbour area that contains two types of supports. The results showed that our method was capable of decomposing the point cloud into parts and arranging them in a way that matched the actual structure. Thus, we conclude our proposed method is capable of roughly decomposing the point clouds of civil structures into parts arrange into product models.
Our future work will focus on two issues: (1) to improve part decomposition by rejecting extra points which fall outside of parts, and (2) to evaluate our method by using the point clouds generated by other scanning devices.
Acknowledgements
This research is supported in part by the Japan Construction Information Center Foundation.
References
Adan, A., Xiong, X., Akinci, B. and Huber, D., 2013. Automatic Creation of Semantically Rich 3D Building Models from Laser Scanner Data. Automation in Construction, 31, pp. 325-337.
Attene, M., Marini, S., Spagnuolo, M. and Flacidieno, B., 2010. The Fast Reject Schema for Part-in-Whole 3D Shape Matching. In Proceedings of the 3rd Eurographics conference on 3D Object Retrieval, pp. 23-30.
Ballard, H., D. and Brown, M., C., 1982. COMPUTER VISON, Prentice Hall, pp. 149-165.
Besl, P., J., and McKay, N., D., 1992. A Method for Alignment of 3-D Shapes. IEEE Transactions on Pattern Analysis and Machine Intelligence, 14 (2), pp. 239-256
Kazhdan, M., Bolitho, M., and Hoppe, H., 2006. Poisson Surface Reconstruction. Proceedings of the fourth Eurographics symposium on Geometry processing, 7, pp. 61-70. Lee, G., Sacks, R., and Eastman, C., M. 2006. Specifying Parametric Building Object Behavior (BOB) for a Building Information Modeling System. Automation in Construction, 15(6), 758-776
Matsuoka, R. and Masuda, H., 2014. Surface Extraction and Shape Reconstruction of Engineering Facilities. Journal of the Japan Society for Precision Engineering, 80 (6), pp. 604-608
Mori, G., Belongie, S. and Malik, J., 2005. Efficient Shape Matching Using Shape Contexts. IEEE Transactions on Pattern Analysis and Machine Intelligence, 27, pp.1832-1837.
Nan, L., Xie, K. and Sharf, A., 2012. A Search-classify Approach for Cluttered Indoor Scene Understanding. ACM Transactions on Graphics (TOG), 31 (6), pp. 137:0-137:10 Wang, J., Cai, H. and He, Y., 2008. A Method for Content-based Searching of 3D Model Databases. Data Science Journal, 7, pp. 46-53.
Yabuki, N., 2012. BIM and Construction Information Modeling (CIM). Proceedings of the International Conference on Computational Design in Engineering (CODE 2012), 2012. 11, pp. 325.
Figure 10. Keypoints sampling result
Figure 11. Local shape matching result
Figure 12. Decomposition result
Figure 13. Final decomposition result
(a) (b)
Figure 14. Results of polygonizing each part