1
Poverty Alleviation in Indonesia:
Government Programs and Challenges Ahead
Raden Muhamad Purnagunawan
Department of Economics, Padjadjaran University
Secretariat of the National Team for the Acceleration of Poverty Reduction
27 October 2016
The 4
thAnnual Convention of
2 2
Poverty rate has declined significantly, but has been
slowing down in the last few years
70. 00 54. 20 47. 20 42. 30 40. 60 35. 00 30. 00 27.20 25. 90 34. 01 49. 50 47. 97 38. 74 37. 87 38. 39 37. 34 36. 15 35.10 39. 30 37. 17 34. 96 32. 53 31. 02 30. 02 29. 89 29. 13 28. 59 28. 07 28. 55 28. 28 27. 73 28. 59 28. 51 28. 01 60. 00 40. 10 33. 30 28. 60 26. 90 21. 60 17. 40 15.10 13. 70 17. 47 24. 20 23. 43 19. 14 18. 41 18. 20 17. 42 16. 66 15.97 17. 75 16. 58 15. 42 14. 15 13. 33 12. 49 12. 36 1 1. 96 1 1. 66 1 1. 37 1 1. 47 1 1. 25 10. 96 1 1. 22 1 1. 13 10. 86 -5 5 15 25 35 45 55 65 0 10 20 30 40 50 60 70 80 1970 1976 1978 1980 1981 1984 1987 1990 1993 1996 1998 1999 2000 2001 2002 2003 2004 2005 2006 2007 2008 2009 2010 Mar-11 Sep-11 Mar-12 Sep-12 Mar-13 Sep-13 Mar-14 Sep-14 Mar-15 Sep -15 Mar-16
Jumlah Penduduk Miskin Presentase Penduduk Miskin
J um lah Penduduk M is k in ( J ut a Orang) Pres ent as e Penduduk M is k in (%)
Sumber: Badan Pusat Statistik, 2016 Keterangan: Sejak tahun 1996 menggunakan dasar perhitungan yang disempurnakan
Poverty rate and the number of poor people,
Indonesia 1970-2016
3 3
Poverty rate varies across provinces
2 8 .4 0 2 5 .7 3 2 2 .5 8 1 9 .3 6 1 8 .1 6 1 7 .1 6 1 7 .1 1 1 6 .5 4 1 4 .0 7 1 3 .7 7 1 3 .7 4 1 3 .5 3 1 3 .3 2 1 3 .1 6 1 2 .2 8 1 1 .9 0 1 0 .7 9 1 0 .1 2 9 .5 7 9 .1 2 8 .9 8 8 .8 2 8 .4 4 6 .7 1 6 .3 2 6 .2 2 6 .1 0 5 .9 1 5 .7 8 5. 75 5 .2 5 4 .8 3 4 .7 2 3 .6 1 1 1 .1 3 0 5 10 15 20 25 30 P ap ua P ap ua B ar at N us a Ten gg ar a Ti mur M aluku G oront al o B en gk ulu Aceh N u sa T en g g ar a B ara t S ulaw es i Te ng ah S umat era S elat an Sul aw esi Tenggar a La mpun g Ja w a Ten ga h D I Y og ya ka rt a Ja w a Ti mur S ulaw es i B arat Sumat era U tara S ulaw es i S el atan Ja w a Ba rat Ja mbi S ulaw es i U tar a R iau K ali mant an B arat Sumat era B ar at K ali mant an U tara M aluku U tara K ali mant an Ti mur K ali mant an Te ng ah K ep ulaua n R iau B an ten Bali K ep ulaua n B an gk a… K ali mant an S el atan DK I Ja ka rt a Ind on es ia
Sumber: Badan Pusat Statistik, 2016
Poverty Rate by Province (%)
September 2015
4 4
2011
32
Poverty pockets can be found in every region categories
5
Poor and vulnerable
communities make up
40%
of the population
11,25%Popul
at
ion
Source: Susenas (2014)200.000
400.000
600.000
800.000
1.000.000
|
5
6
are vulnerable to shocks
4 of 10 people
Initial
Condition
7 7
2011
28
… They are easy move out and in of Poverty
Sumber: SMERU, 2010
2008
53%
2009
8 8
Who do you think is more eligible for the gov’t assistance?
More eligible to receive government assistance because the spouse is not working, have more
dependent families
Looks like they are more eligible
9 30% 40% 50% 60% 70% 80% 90% 100%
Characteristic of Working Age in Poor Household
Employed Unemployed Not in labor force
30% 40% 50% 60% 70% 80% 90% 100%
Employed Unemployed Not in labor force
Urban Rural
WORKING POOR
Most of poor people have job, but it does
not make them get out of poverty.
Decreasing trend until to 2006, sudden
increase in 2007
Urban vs Rural
- Less proportion of working poor, but
higher unemployment in Urban
Better job opportunity but high
competition
30% 40% 50% 60% 70% 80% 90% 100% 19 93 1 9 9 6 19 99 20 00 20 01 20 02 20 03 20 04 20 05 20 06 20 07 20 08 2 0 0 9 20 10 20 11 20 12
10 10
... Working poor is also a problem in other countries
Share of employed, unemployed and economically in total population aged 15+
living below the US$1.25 poverty line, selected countries
11
11
Ketimpangan Utamanya Dijelaskan Oleh Pertumbuhan Kelompok Atas
yang Jauh Lebih Tinggi Dibandingkan dengan Kelompok Miskin……
12 12
Increase income
Reduce Burden
Targeted Social Assistance Program:
•
Healthcare
•
Education Assistance
•
Conditional Cash Transfer
•
Rice for the Poor
Poverty & Inequality Reduction Strategy
1
2
13
Initial
Condition
30%
Only
Of poor people
receive
14
Less
than
of poor people
receive BSM
10%
Household Expenditure (Consumption) per Decile
Percent of 6-18-year-olds that receive BSM
15 15
| 15
TARGETING OPTIONS
MEANS TESTING:
this requires high-quality data that
was not available in Indonesia and may be expensive to
put in place.
GEOGRAPHICAL TARGETING: transfers are provided to
those living in areas with a high incidence of poverty.
COMMUNITY-BASED TARGETING:
uses community
structures to identify the poorest members in a community
or those eligible, according to agreed criteria.
PROVIDING BENEFITS
to those recognized as belonging
to a specific vulnerable category of the population.
SELF-TARGETING:
for example, in work programs that
offer a below-market wage, based on the logic that
individuals choose to opt into the program.
1
|
2
|
3
|
4
|
16 16
Indonesian Unified Database
for Social Protection Programs
|
16
of the population with the
lowest socioeconomic
status
40
%
24.7
million households
96.7
million individuals
Census
for the poor and vulnerable
Managed by Independent & High Hierarchy Government
Institution
Integrated MIS
17
Percentage of Population With
Almost Identical Social Economic Characteristics
Poverty Line (Sep 2014)
Covers 5,5 million HH or 27,73 million people below PL
Unified Data Base (BDT - BASIS DATA TERPADU)
Coverage 24,7 milion households (HH) or or 96,7 million people PENERIMA KPS/KKS Including15,5 million HH or 65,6 million people
10,96%
40%
60%
25%
Poo
r
Inclusion Error Exclusion ErrorPENERIMA BANTUAN IURAN (PBI) JKN Covering 21,8 million HH or 86,4 million people
35%
Nea
r
Po
o
r
/
V
u
ln
era
b
le
PROGRAM KELUARGA HARAPAN (PKH) covers 3 million HH
8%
18
18
Cakupan Program Bantuan Sosial Saat Ini
Program Jumlah Pelaksana
Keluarga Jiwa Kelompok
Kartu Perlindungan Sosial (KPS)
15,5 Juta 65,6 Juta 25%
terbawah Kementerian Sosial
Kartu Keluarga Sejahtera (KKS)
Simpanan Keluarga Sejahtera (SKS) 15,5 Juta 65,6 Juta 25%
terbawah Kementerian Sosial
Raskin 15,5 Juta 65,6 Juta 25%
terbawah Kementerian Sosial
Program Keluarga Harapan 2,8 Juta 11,2 Juta 8%
terbawah Kementerian Sosial
Bantuan Siswa Miskin (BSM)/Kartu
Indonesia Pintar 15,5 Juta
11,1 juta Siswa
25% terbawah
Kementerian Pendidikan dan Kebudayaan & Kementerian
Agama
Penerima Bantuan Iuran (PBI) Jaminan Kesehatan Nasional/Kartu Indonesia
Sehat (KIS) 21,8 Juta 86,4 Juta 35% terbawah Kementerian Kesehatan melalui BPJS Kesehatan Program Daerah
Terdapat 42 permintaan dari 26 Provinsi dan 288 permintaan dari 247 Kabupaten/Kota untuk menggunakan BDT dalam pelaksaan Program Perlindungan Sosial yang dibiayai oleh APBD di daerah masing-masing
Program Kementerian/Lembaga lainnya
Terdapat 22 permintaan dari 15 Kementerian/Lembaga untuk
menggunanakan BDT dalam pelaksanaan Program Perlindungan Sosial lainnya (Termasuk KUR, KUBE, Rutilahu, dan program lainnya)
19 19 10.86 5.02 0.397 0.340 0.350 0.360 0.370 0.380 0.390 0.400 0.410 0.420 0 5 10 15 20 2009 2010 2011 2012 2013 2014 2015 2016
Tingkat Kemiskinan (Skala Kiri)
Rasio Gini (Skala
Kanan)
Pertumbuhan Ekonomi (Skala Kiri)
Penurunan Ketimpangan dan Kemiskinan Terjadi dalam Dua Tahun Terakhir….
Perlu Upaya Untuk Melanjutkan Tren Penurunan Tersebut
20
Promoting Financial Inclusion
21 21
21
21POPULATION’S ACCESS
TO FINANCIAL SERVICES
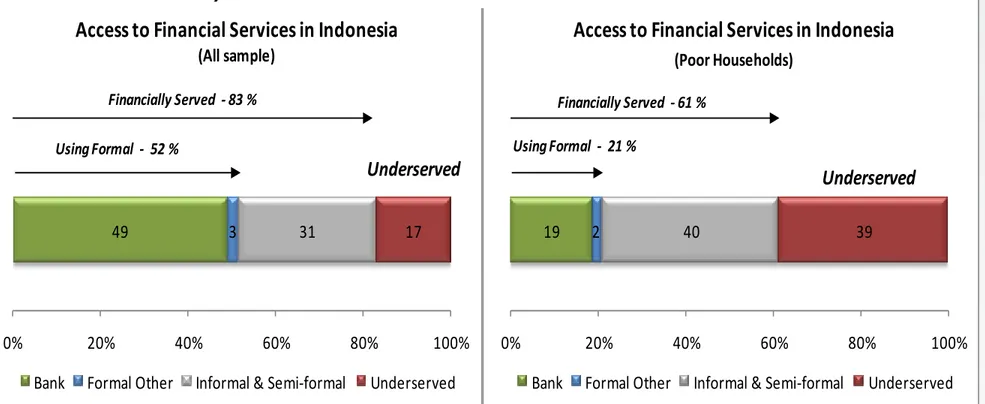
49 3 31 17 0% 20% 40% 60% 80% 100%Access to Financial Services in Indonesia
(All sample)Bank Formal Other Informal & Semi-formal Underserved
Using Formal - 52 %
Financially Served - 83 %
Underserved
19 2 40 39
0% 20% 40% 60% 80% 100%
Access to Financial Services in Indonesia
(Poor Households)Bank Formal Other Informal & Semi-formal Underserved
Using Formal - 21 %
Financially Served - 61 %
Underserved
Approximately 80 per cent of Indonesia's poor have no access to formal financial
services
Source: World Bank 2012
Figure 1. Access to Financial Services in Indonesia (all and poor
households)
22 22
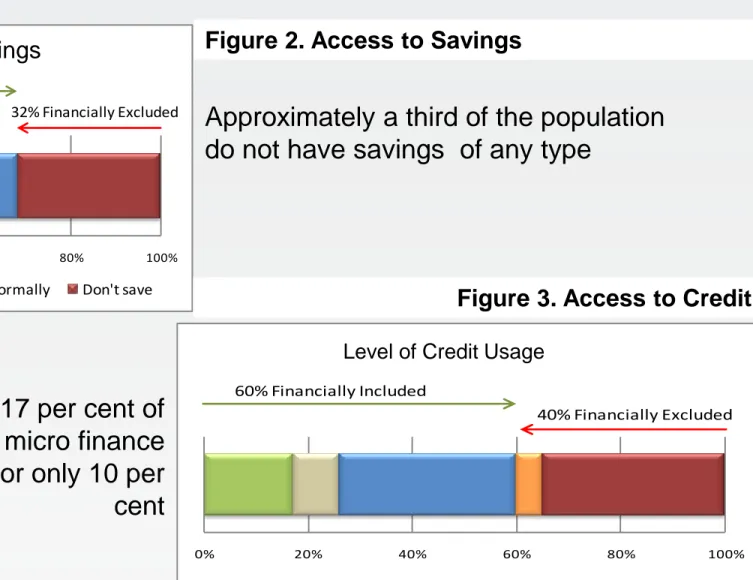
Approximately a third of the population
do not have savings of any type
0% 20% 40% 60% 80% 100%
Banks Other Formal Only Informally Don't save
68% Financially Included
32% Financially Excluded
POPULATION’S ACCESS
TO SAVINGS AND CREDIT
0% 20% 40% 60% 80% 100%
Banks Semi-Formal Informally Voluntarily Excluded Can't Borrow
60% Financially Included
40% Financially Excluded
Bank credit only covers 17 per cent of
the population, while the micro finance
institutions account for only 10 per
cent
The Use of Savings
Level of Credit Usage
22
Source: World Bank 2012
Figure 2. Access to Savings
Figure 3. Access to Credit
23 23
23
23• Macro-economic:
More rapid economic growth (Zuang 2009)
• Micro-economic:
Links to poverty reduction, especially savings (Grameen Foundation
2010)
• Social:
Financial inclusion = financial citizenship; gives financial identity
and unique address
• In social transfer programs:
Financial inclusion is critical to impact of schemes on growth at
micro-level through alleviating liquidity constraints on investment (Barrientos
2008)
THE BENEFIT OF A FINANCIALLY INCLUSIVE
SYSTEM
24 24
National Strategy for Financial Inclusion
• Just recently signed by President in form of Presidential
25 25
Challenges Ahead
• Global Economic Slowdown
• Global rising in Inequality
• Digital Divide
26 26
What can WE do
• Be a Connector…. or even a SUPER CONNECTOR
(Alatas, 2016)
• Control and supervise the Government
• Report
27