UMEÅ UNIVERSITY MEDICAL DISSERTATIONS New Series No. 885 ISSN 0346-6612 ISBN 91-7305-590-5
From Epidemiology and Public Health Sciences, Department of Public Health and Clinical Medicine, Umeå University, S-901 87 Umeå, Sweden
and
Community Health and Nutrition Research Laboratories, Gadjah Mada University, Jogjakarta, Indonesia and
Nutrition Academy, Ministry of Health, Jogjakarta, Indonesia
Food habits, dietary intake and
nutritional status during economic
crisis among pregnant women
in Central Java, Indonesia
¤Copyright: Th. Ninuk Sri Hartini Photograph: Th. Ninuk Sri Hartini and Birgitta Åström Printed in Sweden by Print & Media, Umeå University2004:402008
ABSTRACT
Objectives: The overall objective of this thesis was to study the effect of the economic crisis on food habits, dietary intake and nutritional status among pregnant women in Purworejo District, Central Java, Indonesia.
Subjects and Methods: Since 1994, the Community Health and Nutrition
Research Laboratories (CHN-RL), Gadjah Mada University, Jogjakarta, Indonesia have operated a surveillance system in Purworejo District, Central Java, Indonesia. Between 1996 and 1998, a monthly monitoring of new pregnancies took place within the surveillance system. This project included a detailed evaluation of dietary intake during pregnancy. Each trimester six repeated 24-hour recalls were conducted on 450 pregnant women. Weight and mid-upper arm circumference (MUAC) were measured monthly, height and serum ferritin concentration was measured once. Here, the dietary intake and nutritional status of the women during the second trimester are evaluated in relation to the emergence of the economic crisis, that started in 1997. Women were classified into four socio-economic groups. A computer program (Inafood) was developed to calculate nutrient intake. To support the quantitative results, a qualitative study was carried out between January and June 1999. Focus group discussions were held with four groups of women, in-depth interviews with 16 women, three traditional birth attendants and four midwives, and observations were carried out with four women. Here, food habits and coping strategies in relation to the economic crisis were explored.
Results: Before the crisis, more than 80% of the pregnant women had
“during crisis” because relatives and neighbours provided some foods and perhaps also because of the government support programme.
Conclusion: Before the crisis, energy and nutrient intake of pregnant women were inadequate. The food pattern of the women was predominately plant-based. Rich women were able to maintain a good nutrient intake during the crisis, although fat intake decreased. Rural poor women with access to rice fields had a higher rice intake than other groups throughout the crisis. Urban poor and rural poor, landless women experienced a decreased intake of most nutrients in the transition period but an increased intake during the crisis, reflecting government intervention and support from relatives and neighbours. The latter, however, is not sustainable. Thus, vulnerable groups are at risk of developing nutritional deficiencies without food support programmes.
ORIGINAL PAPERS
The thesis is based on the following papers:
I. Hartini TNS, Winkvist A, Lindholm L, Stenlund H, Surjono A, Hakimi M. Energy intake during economic crisis depends on initial wealth and access to rice fields: the case of pregnant
Indonesian women. Health Policy. 2002. 61(1): 57-71.*
II. Hartini TNS, Winkvist A, Lindholm L, Stenlund H, Persson V, Nurdiati DS and Surjono A. Nutrient intake and iron status of urban and rural poor without access to rice fields are affected by the emerging economic crisis: the case of pregnant Indonesian
women. European Journal of Clinical Nutrition. 2003. 57(5):
654-666.*
III. Hartini TNS, Winkvist A, Lindholm L, Stenlund H, Surjono A. Food pattern during economic crisis among pregnant women in
Purworejo District, Central Java, Indonesia. Food and Nutrition
Bulletin. 2003. 24(3): 256-267.*
IV. Hartini TNS, Padmawati RS, Lindholm L, Surjono A, Winkvist A. The importance of eating rice: qualitative and quantitative study on Indonesian pregnant women’s food habits in relation to the economic crisis. Submitted.
V. Hartini TNS, Padmawati RS, Lindholm L, Surjono A, Winkvist A. The coping strategies of pregnant women during the economic crisis in Central Java, Indonesia. Manuscript.
ABBREVIATIONS
ACC/SCN Administrative Committee on Coordination/Sub-Committee on Nutrition
ASEAN Association of South East Asian Nations Bappenas = NDPA Badan Perencanaan Nasional = National
Development Planning Agency BKKBN = NFPCB Badan Keluarga Berencana Nasional =
National Family Planning Coordinating Board BPS = CBS Biro Pusat Statistik = Central Bureau of Statistics BULOG = NLA Badan Urusan Logistik = the National
Logistic Agency
DPBD Development & Planning Board of District Level
EAR Estimated Average Requirement
FAO/WFP Food and Agriculture Organisation/ World Food Programme
GDP Gross Domestic Product
GNP Gross National Product
HFA Health for All
HKI Helen Keller International
ICN International Conference on Nutrition
IDD Iodine Deficiency Disorders
IFPRI International Food Policy Research Institute
IOM Institute of Medicine
IU International Unit
JPS = SSN Jaringan Pengaman Sosial = Social Safety Net KEK = CED Kurang Energi Kronis = Chronic Energy
Deficiency kcal kilocalory
LPKGM = CHN-RL Lembaga Penelitian Kesehatan dan Gizi Masyarakat = Community Health and Nutrition Research Laboratories LLA = MUAC Lingkar Lengan Atas = Mid-Upper Arm Circumference
MDS Maternal Depletion Study
MOH Ministry of Health
NGO Non Government Organisation
NPAFN National Plan of Action for Food and Nutrition
NRC National Research Council
PEM Protein Energy Malnutrition
Pelita = FYDP Pembangunan Lima Tahun = Five-Year
Development Programme
RDA Recommended Dietary Allowances
RE Retinol Equivalent
Rp Rupiah (Indonesian currency)
Sida/SAREC The Swedish International Development Authority/the Swedish Agency for Research Co-operation in Developing Countries
STINT The Swedish Foundation for International Cooperation in Research and Higher Education SUSENAS Survei Sosial Ekonomi Nasional = National
Survey of Social Economy UNICEF United Nation Children's Fund
VAD Vitamin A Deficiency
24 VASQ 24-hour Vitamin A Semi-Quantitative
VOC Vereniging Oost Indische Compagnie = Royal East
Indian Company
WHO World Health Organization
GLOSSARY AND DEFINITIONS
Anaemia Abnormally low haemoglobin level due to
pathological condition(s), defined as less than 11.0 g/dl.
Bias Deviation of results or inferences from the truth, or processes leading to such deviation. Any trend in the collection, analysis, interpretation, publication, or review of data that can lead to conclusions that are systematically different from the truth.
Bioavailibility The amount of the nutrient that reaches the blood.
Chronic energy deficiency A nutritional status corresponding to MUAC less than 23.5 cm (Indonesian definition) or body mass index less than 18.5. (International definition)
Confounder A variable that can cause or prevent the outcome of interest, is not an intermediate variable, and is associated with the factor under investigation.
Cross-sectional study A study that examines the relationship between diseases (or other health-related characteristics) and other variables of interests as they exist in a defined population at one particular time. The presence or absence of disease and the presence or absence of the other variables (or, if they are quantitative, their level) are determined in each member of the study population or in a representative sample at one particular time.
Iron deficiency Abnormal iron biochemistry with or without the presence of anaemia, defined as less than 12.0Pg/l.
Power The ability of a study to demonstrate an
magnitude of the effect, the study design, and sample size.
Selection bias Bias arising from the manner in which the study subjects were chosen from the entire population that theoretically could be studied.
Validity (Internal) The index and comparison groups are selected and compared in such a manner that the observed differences between them on the dependent variables under study may, apart of sampling error, be attributed only to the hypothesized effect under investigation.
Validity (External) A study is externally valid or generalisable if it
can produce unbiased inferences regarding a target population.
CONTENTS
ABSTRACT... III ORIGINAL PAPERS ... V ABBREVIATIONS ...VI GLOSSERY AND DEFINITIONS ... VIII CONTENTS... X
INTRODUCTION ... 1
1. Health and nutrition in Indonesia... 1
General description of Indonesia...1
Food and nutritional problems...2
Nutrition policy and programmes in Indonesia...4
2. Economic development in Indonesia and the current crisis... 5
Economic development ...5
Economic crisis ...6
Government intervention ...8
3. Nutrient needs of pregnant women ... 8
OBJECTIVES OF THE THESIS ... 12
CONCEPTUAL MODEL ... 13
METHODS ... 17
1. Study site ... 17
2. Subjects... 18
Quantitative study .... 18
Qualitative study ...20
3. Data collection ... 22
Dietary intake data ...22
Qualitative data collection ...25
Anthropometric measurements and blood samples...26
Socio-economic and other background data ...26
4. Time periods in the crisis... 27
5. Data quality control... 29
6. Analyses ... 30
Quantitative data analyses ...30
Qualitative data analyses ...31
RESULTS... 32
1. Household expenditures before the crisis ... 32
2. Selection of women ... 34
3. Effect of the crisis on food habits and food intake (Paper I, III, IV and V)... 37
4. Effect of the crisis on nutrient intake (Paper I and Paper II) ... 45
5. Effect of the crisis on nutritional status (Paper I and Paper II)... 48
MAIN FINDINGS...51
DISCUSSION ... 53
1. Power and validity ... 53
Quantitative study ...53
Qualitative study ...55
2. Dietary intake survey... 55
3. Adequacy of nutrient intake ... 56
4. Food habits and food intake ... 57
5. Nutrient intake... 61
7. Vulnerable groups... 63
8. Lessons learned about the dietary intake of pregnant women during the crisis... 64
CONCLUSION... 67
ACKNOWLEDGEMENTS... 68
INTRODUCTION
SS
INTRODUCTION
1. Health and nutrition in Indonesia
General description of Indonesia
The Republic of Indonesia is the largest archipelago in the world with an aggregate land area of 1,900,000 square kilometres. It is located in Southern Asia and is situated between the Indian Ocean and the Pacific Ocean. This strategic position has always influenced the cultural, social, political and economic life of the country. There are a total of 13,667 islands. The five main islands are Sumatra, Java, Kalimantan, Sulawesi and Irian Jaya (Papua) (National Information and Communication Agency, 2001).
INTRODUCTION
About 60% of the population live on Java Island. During the
New Order1, general short-term and long-term developments
were centralised in Java. The resulting economic growth in Java yielded a decrease in mortality, an improvement in nutritional status, and better living conditions than in other parts of the country.
Food and nutritional problems
Food is important for humans as part of social life and especially because it contains nutrients needed by humans. Unfortunately, people are not always able to access food, for various political, economic and geographic reasons. Food eaten in amounts that are too small, or too large, or that is unbalanced, results in malnutrition or diseases (WHO, 1990).
Several Indonesian reports suggest that the usual dietary intake of certain nutrients is inadequate for meeting the needs of the pregnant women and children in the country. In a study conducted in Bogor, Indramayu and Purwakarta, and Gunungkidul Districts, mean maternal energy (1,500 kcal/day) and protein intake (40 g/day) during pregnancy were low in all
areas (Soekirman et al., 1992). This should be compared with
several studies reported by researchers around the world indicating that mean daily energy intakes among pregnant women range from approximately 1,500 to 2,800 kcal/day (IOM, 1990). Similarly, the average dietary intake of pregnant women in Madura, Indonesia, was estimated at 1,500 kcal and 40 g of protein per day in another study (Kardjati et al., 1994). For these women, the energy deficit (77% of Recommended Dietary Allowances = RDA) was greater than the protein deficit (84% of RDA). Protein contributed 10-11% of the total energy intake. Typical of the diet of low-income households was its extremely low fat content, contributing less than 10% of the energy intake.
Still, in 1995, energy intake per capita was generally high, and only 14% of the population had a daily per capita energy intake below the Government’s recommended daily allowance (2,100
1 The New Order refers to the new regime under the second president, Soeharto. He ruled
INTRODUCTION
kcal). Thus, overall, food availability was no longer a critical constraint in the early 1990s (GOI & UNICEF, 1995). In 2002, energy intake was 1986 kcal/cap/day and protein intake was 54.42 g/cap/day. Compared to daily allowance, the protein intake was sufficient (Ministry of Agriculture, 2004).
It is difficult to present a complete picture of the nutritional status of pregnant women in Indonesia, as most information originates from scattered surveys in various parts of the country (Soekirman et al., 1992). The nationally representative National Survey of Social Economy (Survei Sosial Ekonomi Nasional = SUSENAS) data from 2000 on the nutritional status of reproductive-aged women showed that 21.5% had chronic energy deficiency as indicated by a mid-upper arm circumference (MUAC) < 23.5 cm (MOH, 2001).
In poor societies, the prevalence of anaemia is three to four times higher than in rich societies. Globally as many as fifty-six percent of pregnant women are affected by anaemia (ACC/SCN & IFPRI, 2000). A positive sign in Indonesia has been that a national survey showed that a significant change had taken place in the prevalence of iron deficiency anaemia in pregnant women, from 63.5% in 1991 to 50.9% in 1995 (MOH, 1997). Further, a study in West Java in 1992 reported that 43.5% of women had low serum ferritin levels, no women were vitamin A deficient, but 10% had marginal vitamin A status (Suharno et al., 1993).
INTRODUCTION
Indonesia had successfully reduced the prevalence of Xerophthalmia in children to 0.33%.
Nutrition policy and programmes in Indonesia
Food and nutrition problems are often difficult to solve because of the multitude of factors in their aetiology and maintenance. Undernutrition is a result of inadequate food intake and disease. A child who consumes a good diet but who frequently suffers from diarrhoea or fever most likely becomes undernourished. Thus, disease is the immediate causes of undernutrition (UNICEF, 1998). Poor diet and disease, in turn, are caused by food insecurity, as well as inadequate maternal and child health care. The distant causes are social structures and institutions, political systems and ideology, economic distribution, and potential resources (UNICEF, 1998).
The associations between health and national development are complex. The interaction is a two-way phenomenon, with health being both influenced by and influencing economic development. Unfortunately, improved health has for too long been considered solely a result of economic growth, a part of the product of growth, rather than one of its causes (Sorkin, 1977).
INTRODUCTION
least costly approaches to reducing micronutrient deficiency problems are to increase the availability and consumption of micronutrient-rich foods (Buyckx, 1993).
To continue the progress made in improving health status, and monitoring dietary intake and growth, the Indonesian Government drew up a National Plan of Action for Food and Nutrition (NPAFN) for the years 2001-2005. The NPAFN constitutes the main guidelines for food and nutrition programmes for coordinated plans for policy makers at all levels. Specific objectives of the food and nutrition programme for the years 2001- 2005 are: a) to increase the quantity and quality of food availability through increasing production, productivity, the variety of food, and innovations in processed food; b) to increase diversity of food consumption while establishing food security at the household level; c) to improve the delivery of nutrition services in order to achieve good nutritional status by reducing the prevalence of undernutrition and overnutrition; and d) to improve the self-sufficiency of the family in attaining a healthy life by improving nutritional status (MOH & WHO, 2000).
2. Economic development in Indonesia and the current crisis
Economic development
In 1512, the Dutch landed on the Banten shore in Java. At first, the Dutch came as traders for the Royal East Indies Company
(Vereniging Oost Indische Compagnie = VOC). When the VOC
INTRODUCTION
comprising political stability, economic growth and equality (CBS et al., 1998).
The gross national product (GNP) per capita is often used as a summary index of the relative economic well-being of people in different nations. When Indonesia started its first Five-Year Development Plan (FYDP I) in 1969, it was one of the poorest countries in the world. At that time, Indonesia's per capita income was only US$ 50, or about half that of India,
Bangladesh and Nigeria (Soekirman et al., 1992). During the
following three decades, Indonesia's economy underwent substantial improvement. The GNP per capita grew by 4.5% in the 1980s, and by 1990 the per capita income had reached US$ 570. The incidence of rural poverty declined from over 40% in 1976 to about 14% in 1997 (MOH, 1997).
Agriculture is the largest sector in the Indonesian economy. The increase in food crop production, particularly rice (oryza sativa) influenced the growth of the gross domestic product (GDP) and had a dominant role in the Indonesian economy (Kasryno,
2000). Rice was the most preferred cereal (Latief et al., 2000),
and during 1995-1998 rice/cereal contributed 62-66% of the total energy intake (MOH & WHO, 2000). Unfortunately, lately the production has decreased whereas the demand has increased. Today, Indonesia is the largest importer of rice, the second largest importer of sugar, and it imports milk, meats and prepared products (Krisnamurti, 2003).
Economic crisis
Overall, for a period of three decades, Indonesian economic development brought higher standards of living and better diets. However, improved income is not in itself sufficient for an improvement in nutrition, because it may be that more calories are not bought with increased income. The reasons for this are that important non-food factors such as environmental hygiene and health may not be purchasable with increased income, and because much depends on how food and non-food resources are actually used in households (Gillespie, 1997).
INTRODUCTION
of the financial crisis that severely affected many Asian countries (The Jakarta Post, 1998). The prices of food and other basic necessities rose sharply amidst rapidly increasing unemployment, thus seriously eroding the purchasing power of large segments of the population. The fact that prices increased fuelled inflation, which reached 39% in March 1998, the highest level in 23 years (Shiner, 1998). The value of the Indonesian rupiah in July 1998 was a mere one-sixth of its pre-crisis value in July 1997, while inflation had soared to 46.5 percent during the first half of 1998. The situation worsened further as fears of unemployment rose (Kompas, 1998). Between 1997 and 1998, the Indonesian per capita GNP declined by 41% i.e. from US$ 1089 to 640 (World Bank, 2000).
The country’s sixth Five-Year Development Plan, FYDP VI 1994-1999, had targeted a further reduction in absolute poverty to six percent of the population (GOI & UNICEF, 1995). Despite this, more than eight million people lost their jobs following the summer of 1997 (Shiner, 1998). In short, the poverty situation started to become worse again after the summer of 1997. The Central Bureau of Statistics (BPS) reported in July 1998 that the number of Indonesians living below the poverty level had soared to 79.4 million, or about 40 percent of the population (Jawa Pos, 1998).
INTRODUCTION
economic crisis on food and nutrition is complex. Poverty is certainly the root cause of malnutrition (Tanski, 1994). Even so, households with the lowest incomes often develop a food consumption strategy that allows them to soften the effects of economic adjustment by maximising the nutritional potential of the foods available with the lowest relative prices (Summerfield, 1994). Still, changing food habits involves not only an acceptance of new foods but also a decrease or an increase in the quantity and variety of foods people are already familiar with. Therefore, it is difficult for people to change their food habits (Hartog et al., 1996). Further, availability of one’s own produced food will strongly influence the degree of adaptation of food habits during a crisis.
Government intervention
In response to the crisis, the Indonesian Government implemented a broad programme referred to as the social safety net programme (SSN) (NDPA, 2000). This programme had several components: a) A “low price rice” programme that aimed at ensuring food security. The government offered 20 kg rice per month at the discount price of Rp 1,000/kg to eligible poor households, b) Labour intensive programme. This programme provided employment opportunities (SMERU, 1999), c) Subsidised credit programme. Families could borrow money to start up small business (SMERU, 2000), d) Education programme, and e) Social safety net programme was implemented in the health sector. This programme provided supplementary feeding to children 4-24 months of age and to anaemic mothers, revitalized village health posts, and revitalized the nutrition surveillance system (Soekirman, 1999).
3. Nutrient needs of pregnant women
Human eating behaviour depends on both biological and cultural factors. Both perceptions and food taboos often influence food intake during pregnancy. Perceptions and food taboos are often influenced by traditions passed on from generation to generation.
INTRODUCTION
addition to her non pregnancy energy balance (Hytten and Leitch, 1971). The 80 000 kcal are expected to cover the increased basal metabolic rate (36 000 kcal) and the synthesis of new tissue including foetal tissue, maternal fat deposits and increased blood volume (in total 44 000 kcal). Hence, the mother requires extra energy and extra intake of nutrients.
INTRODUCTION
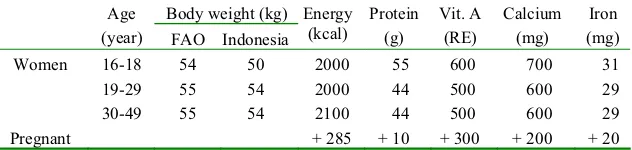
Table 1. Recommended Dietary Allowances of Indonesian women
Body weight (kg) Age
(year) FAO Indonesia Energy
Source: Muhilal et al., 1998.
The primary physiological role of vitamin A involves vision and maintenance of the general health of the eyes, the immune system, growth, reproduction and epithelial tissue maintenance. During pregnancy, a daily supplement should not exceed 10 000 IU (3000 RE) (Braesco and Pascal, 2000). The Indonesian Government recommends that pregnant women consume 2300
IU or the equivalent of 700 RE (Muhilal et al., 1998). Further,
calcium is the major factor in the formation of bone mineral and plays an important role as intracellular messenger in many systems and cells (Bronner and Pansu, 1999). During pregnancy the official recommendation is 900 to 1000 mg calcium per day
(Muhilal et al., 1998). Finally, iron is needed during pregnancy
for the growing foetus and placenta and to increase the maternal red cell mass. The iron need is equally distributed over the duration of pregnancy, but the iron requirements of the foetus are most important during the second and third trimesters. The American recommendation is an extra 30 mg of ferrous iron per day during pregnancy starting at about week 12 of gestation (IOM, 1990) and the Indonesian recommendation is an extra 30 mg/day.
INTRODUCTION
corresponds to the estimated average requirement only, because of concerns about over-intake leading to obesity. Comparisons of individual intakes in a population with RDA may unfairly judge too many to have inadequate intake, because of the addition of two standards deviations to the median average requirement. Therefore, today intake of individuals often are compared simply with the Estimated Average Requirements (EAR) instead (National Academy of Sciences, 1997; Institute of Medicine, 1990).
OBJECTIVES OF THE THESIS
OBJECTIVES OF THE THESIS
The general objective of this thesis was to study the effect of the economic crisis on food habits, dietary intake and nutritional status among pregnant women in Purworejo District, Central Java, Indonesia.
Specific objectives were:
1. To evaluate the adequacy of dietary intake before the crisis in comparison with Indonesian Estimated Average Requirements (EAR).
2. To explore food habits in relation to the economic crisis.
3. To explore the coping strategies during the economic crisis.
4. To describe the consequences of the economic crisis with respect to food intake.
CONCEPTUAL MODEL
CONCEPTUAL MODEL
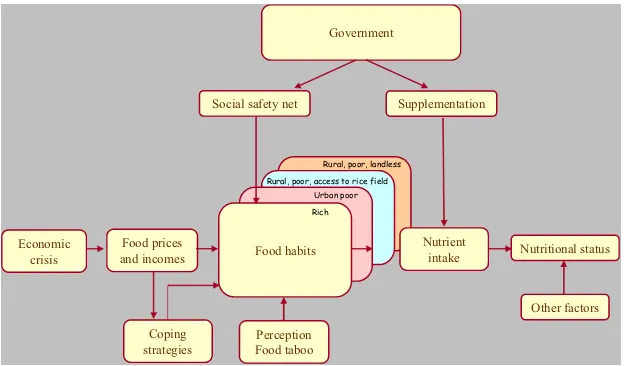
In order to properly understand and investigate the effect of the crisis, a simple conceptual model was developed (Figure 1). We assume that the economic crisis directly affects food prices and incomes of the households. In Indonesia, prices increased, sometimes sharply, and real incomes dropped due to rising unemployment and increasing prices.
Figure 1. Conceptual framework for studying the effects of the economic crisis on food habits, dietary intake, and nutritional status.
Economic crisis
Food prices
and incomes Nutritional status
Nutrient intake Food habits
Perception Food taboo
Government
Coping strategies
Rich Urban poor Rural, poor, access to rice field
Rural, poor, landless
CONCEPTUAL MODEL
In the next step, food habits are likely to change due to increased prices and decreased income. If food intake changes, it may also influence nutrient intake, since different foods have different nutrient content.
For so called normal goods the demand, and thereby intake, will decrease when prices increase. However, rice in Indonesia is perhaps not a normal good in this sense, but is probably what is called a Giffen good in economic terms. A Giffen good is a strongly inferior good for which the quantity demanded increases as prices rise. Also, it should represent a large part of the household food expenditure. For example, a study done in Bangladesh reported that the people were so poor that most of their income was spent on rice. If the price of rice falls, Bangladeshi consumers may reduce their demand for rice and purchase meat or some other more nutritious food instead
(Hardwick et al., 1999). Thus, this theory predicts that when the
price of rice increases, rice consumption increases and households instead reduce their demand for more expensive food such as meat, chicken, etc. Hence, it seems reasonable to expect changes in the entire pattern of food intake.
However, it would be naive to expect a uniform response to price increases among people, as the income level or wealth of the household must naturally also be an important determinant of adjustments to price changes. A wealthy pregnant woman obviously has greater possibilities of handling the crisis by redistributing her income, e.g. decreasing her savings for a period of time, thereby avoiding nutritional consequences.
CONCEPTUAL MODEL
primitive property rights, and in each society there are rules governing this right. The entitlement approach concentrates on each person's entitlements to commodity bundles including food, and views starvation as resulting from failure to be entitled to a bundle with enough food.
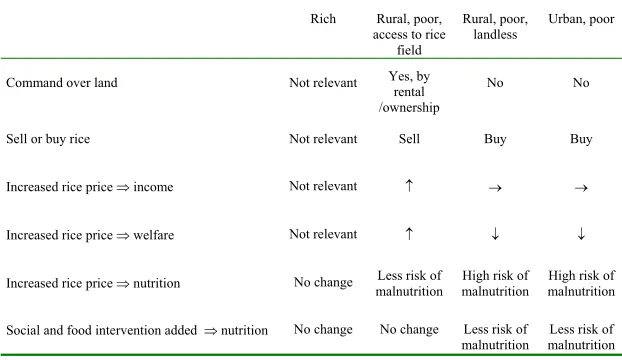
We would expect the most severe nutritional consequences among women who are paid with money and who must get command over food through market exchange. In particular, we would expect vulnerable groups to be landless agricultural labourers and workers in industry and service. Further, the theory predicts more severe consequences from an increase in rice prices in urban areas than in rural areas. The reason for this is of course that a larger proportion of rural people have command over land through ownership or rental arrangement. Based on Sen’s theory, our hypotheses regarding the effects of the crisis on pregnant Indonesian women is shown in Table 2.
Table 2. Classification of households by means of income support in Indonesia, and expected consequences of a significant increase in rice prices.
Classification of households by means of income support
Rich Rural, poor, access to rice
field
Rural, poor, landless
Urban, poor
Command over land Not relevant Yes, by rental /ownership
No No
Sell or buy rice Not relevant Sell Buy Buy
Increased rice price income Not relevant n o o
Increased rice price welfare Not relevant n p p
CONCEPTUAL MODEL
Firstly, rich pregnant women obviously have greater possibilities of handling the crisis by redistributing their income. Rich women are thus treated as one sub group, irrespective of command over land. But a farmer classified as rich will of course increase their income possibilities if the rice price increases while a landless rich (for instance a teacher) will experience negative consequences such as decreased welfare. Secondly, urban poor and rural, poor, landless women are vulnerable groups, they work for wages, and they are at high risk of becoming malnourished. Thirdly, pregnant women in rural areas whose families own or cultivate rice fields have more direct access to basic food such as rice. They may increase their income and welfare when rice prices increase, since they are the sellers.
METHODS
METHODS
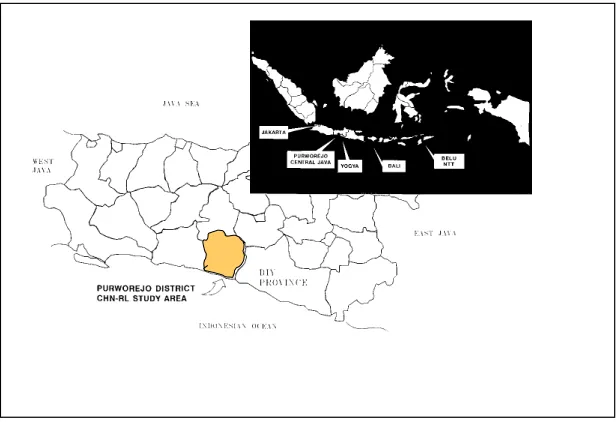
1. Study site
METHODS
There is one government hospital, 22 primary health centres, and 48 subsidiary primary health centres. Also present in the District are one private mother and child hospital, one surgery unit, three birth centres, and several pharmacies (DPBD & CBS, 1999). Using data from the 1990 census, a crude death rate of 9.9 per 1,000 was estimated. The infant mortality rate has shown a declining pattern in the past five years, and the most recent estimates are 52 per 1,000 births (Wilopo, 2001). Infectious diseases still dominate the health condition of the population in Purworejo. The prevalence of children under five years of age with Protein Energy Malnutrition (PEM) was 5.43% in the late of 1990s (Purworejo District Health Office, 2000).
2. Subjects
Quantitative study
METHODS
and use of contraceptive methods was available (n = 13,094 in 1994).
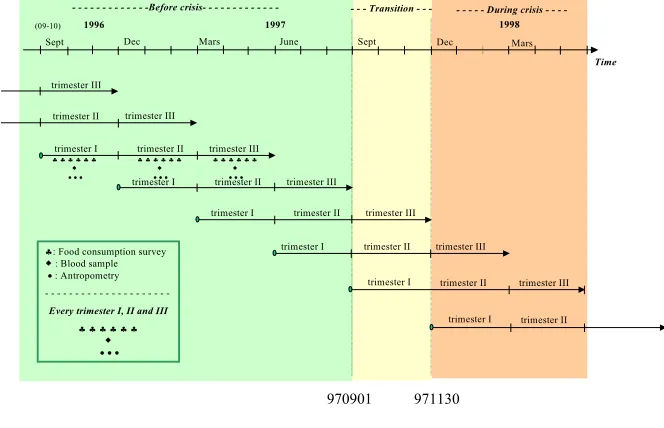
Between 1996 and 1998 a monthly monitoring of new pregnancies among the women of reproductive age took place within the surveillance system. The detection of pregnancy was based on recording the date of the last menstrual period (LMP) and this was
confirmed with a E-HCG pregnancy kit in the field. For cultural
reasons, women were excluded from intensive monitoring for pregnancy if they were not married and if they were pregnant beyond the first trimester. In total 2173 women whose duration of pregnancy was no more than 120 days, and who consented to participate, were randomised to the treatment groups of Zibuvita. Among these, in total, 846 women were invited to participate and assigned to intensive follow-up in the study of maternal depletion. The intensive group underwent anthropometric measurements, and symptoms of pregnancy morbidity were recorded monthly. Also, one blood sample and six repetitions of dietary intake data were collected every trimester (Figure 3).
1996 1997 1998
h: Food consumption survey
: Blood sample x: Antropometry
-Every trimester I, II and III
METHODS
In the non-intensive group, anthropometric measurements and symptoms of pregnancy morbidity were recorded monthly. The ethics committees of the Medical Faculties of Umeå University, Umeå, Sweden, and the Gadjah Mada University, Jogjakarta, Indonesia, approved the study.
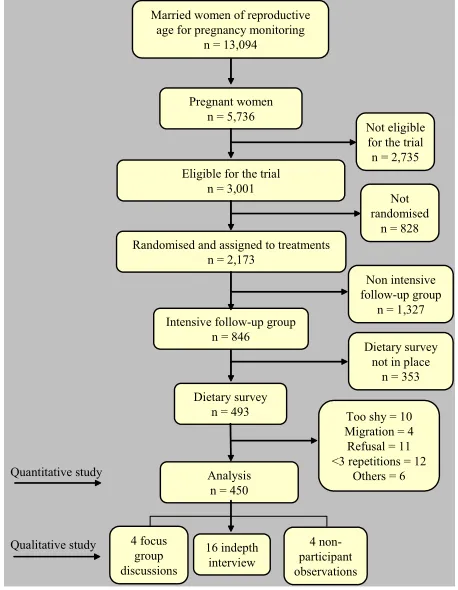
The maternal depletion study included a detailed evaluation of dietary intake during pregnancy and lactation. In this thesis, information from the second trimester of pregnancy was analysed cross-sectionaly, in relation to date of data collection. Unfortunately, this module was not in place from the start of the cohort, some pregnancies were detected late in the first trimester (n = 232 missed subjects), and some were lost at the peak of the crisis because field workers had to be laid off (121), or for other reasons (43). In all, dietary data for 450 (53%) pregnant women were included in these analyses (Figure 4). The reason for selecting the second trimester was that data from this trimester were the most complete; 90% of the pregnant women who participated in the dietary study had all six recalls completed during this trimester. Some women were detected late during the first trimester and also, some women suffered from nausea and vomiting yielding inconsistent intake data. During the third trimester, some women had already delivered when the interviewer visited the women at home. Written informed consent was obtained from all women.
Qualitative study
A qualitative study was carried out between January and June 1999. This study examined the cultural pattern of food habits and coping strategies in different socio-economic and educational groups. In total, 16 women, three traditional birth attendants (TBA) and four midwives took part in in-depth interviews, 24 women took part in four focus group discussions (FGD) and four women took part in non-participant observation.
METHODS
and therefore six women living in nearby villages of the same socio-economic status was chosen for each FGD. Women not participating in FGD were available as candidates to be interviewed and for observations. Based on socio-economic status, education and place of residency (hilly and coastal), women were purposively selected. Because of few urban poor women in the dietary survey, we also recruited urban poor women among participants in the larger maternal and child health study. The researchers were nutritionist, anthropologist, health economist and medical doctor from Indonesia and Sweden.
Married women of reproductive
METHODS
3. Data collection
Dietary intake data
Six 24-hour recalls were used in each trimester to estimate the dietary intake of individual pregnant women. The six recalls were randomly distributed over the five different days in the Javanese calendar (five days within one week). Detailed descriptions of all foods, beverages, vitamins and minerals consumed between 00.00 am and 24.00 pm the previous day, as well as cooking methods, were recorded by 22 trained female interviewers at the homes of the women. The training was carried out in two parts. The first part was theory-based and lasted one week, and the second part consisted of practical exercises and lasted three weeks. The interviewers were trained by nutritionists and an anthropologist. The interviewers usually completed the pre-coded questionnaire in 1-2 hours. We tried to have the same interviewer interview the same women. Food taboo data was collected once during second trimester.
METHODS
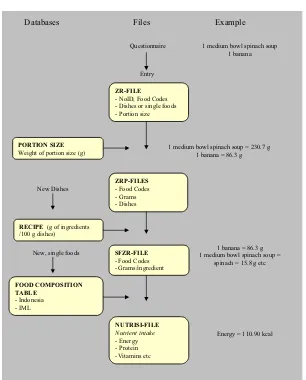
Figure 5. The steps in the dietary analysis system.
The first stage in the process is to identify each food item or meal according to the assigned code number. Quantities of foods eaten
Databases Files Example
Questionnaire
Entry
ZR-FILE - NoID, Food Codes - Dishes or single foods - Portion size
PORTION SIZE Weight of portion size (g)
ZRP-FILES
1 medium bowl spinach soup 1 banana
1 medium bowl spinach soup = 230.7 g 1 banana = 86.3 g
1 banana = 86.3 g 1 medium bowl spinach soup =
spinach = 15.8 g etc
Energy = 110.90 kcal New, single foods
METHODS
information on the food and nutrient intake, we conducted a portion size survey. For each food item and recipe, we specified a portion size, using commonly used household measurements and food whenever possible. The average weights of portion sizes and household measurements were weighed in grams in order to estimate the nutrient contents.
In our study, the majority of the food consumed by the women were mix of dishes. We therefore conducted a community-based assessment of the food recipes and measured the food at women's houses and at field laboratories (Figure 6). Standard recipes are rare in the community and some 3,105 recipes recorded from the women were included in these analyses.
Figure 6. Weighing food and evaluating a food recipe in the field laboratory.
METHODS
the cooked food item itself. Basic cooking methods were also recorded. The most important information was the relative amounts of the ingredients and how they were processed and/or prepared.
In order to perform the calculations of nutrients, the Indonesian nutrient composition database was used in most cases (92%)
(Mahmud et al., 1990; Briawan & Hardiansyah, 1990; Mukrie et
al., 1995). However, in a few cases this was supplemented with
databases from other countries (Siong et al., 1988). Vitamin A
values were predominantly taken from the food composition table in de Pee and Bloom (de Pee & Bloom, 1999). We used the standard conversion factor of 1 Pg retinol = 6 Pg beta-carotene (FAO, 1988). Eighty-five food items not listed in the Indonesian Food Composition Table were sent to the Research and Development Centre for Nutrition, Bogor, Indonesia, for biochemical analysis (Hartini et al., 1995).
Qualitative data collection
All in-depth interviews took place in the subjects’ homes and this provided an opportunity to observe the environment and eating habits. The interview guide included questions on the effect of the crisis on food habits in general, food taboo, and the value of rice. The questions were open-ended, pre-tested on seven pregnant women and one midwife, and thereafter discussed and finalised with field supervisors and an anthropologist.
Focus group discussions were held at the village hall. Each group was homogenous with respect to socio-economic subgroups. During the discussions, the main researchers and the research assistant (anthropologist) were moderator and note taker. All interviews and discussions were conducted in the local language (Javanese), tape recorded and noted.
METHODS
conditions, food preparing, food processing, food serving as well as food intake of the women. Each participant completed a written consent form. No women refused to participate except one TBA who refused to be interviewed because she felt too old.
Anthropometric measurements and blood samples
Nutritional status is assessed through anthropometric measurements. In this study, anthropometric measurements on the sample of 450 women included body weight measured monthly to within 0.1 kg with a calibrated electronic scale (Seca Model 835, CMS Ltd, London, United Kingdom) with as light clothes as possible. Body height was measured once using a stadiometer with an accuracy of 0.1 cm (CMS Ltd., London, United Kingdom), and mid-upper arm circumference (MUAC) was measured monthly to the nearest mm on the left arm using insertion-type UNICEF tapes. Chronic Energy Deficiency (CED) was defined as MUAC<23.5 cm (MOH, 1995b). Ten trained field workers took anthropometric measurements. The standardisation procedures for anthropometry were carried out every sixth month. Calibration of anthropometry instruments was carried out every three months.
Specially trained nurses collected the second trimester blood sample from the women (nonfasting) at their homes. Blood samples were centrifuged in a field laboratory and analysed at the Gadjah Mada University laboratory. Serum ferritin was assessed by the IMX ferritin assay (ABBOTT Laboratories, IL, USA). Low iron stores was defined as serum ferritin <12 Pg/l (Cook & Skikne, 1989).
Socio-economic and other background data
METHODS
rice fields and other assets such as land, pond, livestock, jewellery, radio, vehicles etc, collected by field workers during the same year as the dietary intake data were collected, was obtained mainly from the head of the household.
According to the conceptual model, the population was divided into four socio-economic subgroups. In our study area, prices were high for motorbikes and cars. In West Java a motorbike may indicate relative wealth (Achadi et al., 1995). Thus, we assumed that the group in which it was possible to buy a motorbike or a car comprised “rich” women. ”Rich” was defined by ownership of a car or motorbike irrespective of whether the pregnant women lived in a rural or urban area and irrespective of access to rice fields. ”Urban poor” was defined as living in an urban area without fulfilling the criterion for ”rich”. ”Rural poor” was defined as living in a rural area without fulfilling the criterion for ”rich”. In the last step, ”rural poor” was divided according to access to rice fields.
Pregnant women with access to rice fields included those who either had a legal certificate or those who had received the rice field as a traditional gift from their parents. It also included those who had access to rice fields through rental arrangements or as a loan from the government or through parental ownership. This subgroup was labelled ”rural, poor, access to rice field”. Finally, the fourth subgroup was labelled ”rural, poor, landless”.
4. Time periods in the crisis
METHODS
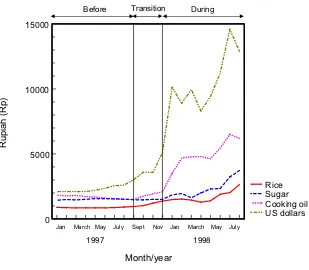
Based on changes in the price of rice, cooking oil and sugar, and the value of Indonesian rupiah, we defined three periods of time.
Figure 7. The prices of foods and currency during 1997 and 1998.
The first period up to August 1997 was labelled “before crisis”, and the second period from September 1997 to November 1997 was labelled “transition”. The third period from December 1997 and onwards was labelled “during crisis” (Figure 7). By limiting the transition period to November 1997, our “during crisis” period coincide with the start of the social safety net. Thus we have three relatively homogenous time periods, “before crisis” characterised by prices, “transition” characterised by increasing prices and finally “during crisis” characterised by rapidly increasing and high
0 5000 10000 15000
US dollars Cooking oil Sugar Rice
Month/year
1997 1998
Jan March May July Sept Nov Jan March May July
Before Transition During
Rupi
ah
METHODS
prices in combination with governmental activities in order to relieve the consequences.
The study design is cross-sectional, in that data on 450 women were collected during their second trimester of pregnancy, and some groups of women in this sample are compared with other groups of women in the same sample. For simplicity, in the presentation of results from the comparisons of women measured before the crisis, in the transition period and during the crisis, expressions such as “a decrease was seen among urban poor women” is used. However, it should be remembered that the underlying data do not represent longitudinal changes within individual women, but cross-sectional trends among different sub-groups of women.
5. Data quality control
A system of quality control of the anthropometric measurements, dietary intake, blood samples and other information collected was implemented in the field. We designed the structured forms to be easy to complete, easy to be checked by a supervisor, and easy with respect to data entry. The forms had a logical layout, and used a sequence based on the information that needed to be recorded by interviewers. Editing of the data forms was conducted in the field within a few days of data collection. Supervisors periodically checked the questionnaire and data during the survey. A random sample of 5% of interviews was repeated later the same day for quality control.
METHODS
6. Analyses
Quantitative data analyses
We used multiple linear regression models to examine potential confounding factors when assessing the association between socio-economic groups and food and nutrient intake in relation to the crisis. These potential confounding variables (education, age, parity, household member, and job) were all found to be non-significant in the models. Also, their inclusion did not change the association between socio-economic groups and dietary intake. Hence, they were not included in further analyses.
Differences in means between the three periods among the subgroups of women were analysed using Student’s t-test or ANOVA. Vitamin A intake and serum ferritin concentration as well as animal, vegetables and fruit intakes did not exhibit a normal distribution, but were skewed to the right. These are therefore presented as median values and the Kruskal-Wallis test and the Mann-Whitney U test were used. In total, only seven women consumed vitamin and mineral supplements. For these women, the supplements contributed 26% of their calcium intake and 21% of their iron intake. Because these intakes strongly affected the mean and standard deviations of the groups, nutrient intake of vitamin and mineral supplements were excluded from the main analysis where access to food was the focus. However, in the discussion of the adequacy of total intake, supplements were included, and this is mentioned in the text.
METHODS
0.05. Statistical analyses were conducted using the Statistical Package for Social Sciences (SPSS version 9.0).
Power was calculated in the beginning of the larger maternal and child health studies to assure that the aims of those studies (Zibuvita and MDS) could be achieved. However, the data were not collected for the purpose of evaluating the economic crisis. The study presented here simply took advantage of existing data. Hence, some cells in the conceptual model contain very individuals. These small cells were not collapsed together during the analyses because the conceptual model made us expect that different socio-economic groups would be affected in different ways. Also, we expected women to behave differently in the transition period, when no government intervention programmes and few coping mechanisms were in place, compared with during the crisis.
Qualitative data analyses
RESULTS
RESULTS
1. Household expenditures before the crisis
RESULTS
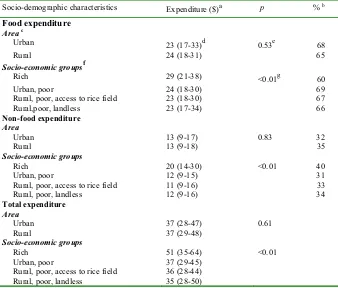
Table 3. Median household expenditures of pregnant women before crisis according to socio-demographic characteristics (n = 235).
Socio-demographic characteristics Expenditure ($)a p % b Food expenditure
In 1997, the exchange rate was 4,000 rupiah per US dollar. bPercentage of total expenditure.
c
The number of pregnant women in each area (urban, n=21; rural, n=214). dMedian (25th –75th percentile).
e
Mann-Whitney U Test, differences in median expenditure among pregnant women who live in urban or rural areas.
f
The number of pregnant women in each socioeconomic group (rich, n=31; urban, poor, n=16; rural, poor, access to rice fields, n=118; rural, poor, landless, n=61).
g
RESULTS
2. Selection of women
RESULTS
Table 4. Basic characteristics of the dietary study sample women and all women of reproductive age, in the surveillance area.
Basic characteristics Dietary survey of the
second trimester (n = 450)
Women of reproductive age
(n = 13,094)a
p
MUAC (cm) – Mean r SD 25.1 r 2.7 24.8 r 2.8 0.01
Age (yr) – Mean r SD 28.3 r 5.3 30.4 r 9.7 <0.01
Height (cm) – Mean r SD 150.4 r 0.2 149.1 r 5.1 <0.01
Area (%)
Rural 92.9 85.9 <0.01
Urban 7.1 14.1 <0.01
Occupation (%)
Unemployed/housewife 40.4 41.2 0.73
Farmer 37.2 38.5 0.58
Other 22.4 20.4 0.30
Education (%)
0-6 years 56.0 59.9 0.10
7-9 years 22.0 18.7 0.08
t 10 years 22.0 21.4 0.76
Owns television (%) 41.3 37.5 0.10
Owns radio (%) 86.9 84.7 0.20
Owns bicycle (%) 83.8 74.7 <0.01
a
Nurdiati et al., (1998)
RESULTS
Table 5. Sample sizes for the three samples of women in relation to socio-demographic characteristics
Period Socio-demographic
characteristics Before crisis
Transition During crisis
Total
Area
Urban 21 7 4 32
Rural 214 97 107 418
Total 235 104 111 450
Socio-economic groups
Rich 31 19 27 77
Urban poor 16 5 3 24
Rural, poor, access to rice fields 118 67 63 248 Rural, poor, landless 61 11 17 89
Total 226 102 110 438a
a
Twelve women rejected to be interviewed on ownership of rice fields.
RESULTS
Table 6. Mean age and height of pregnant women according to socio-demographic characteristics and time of data collection in relation to the economic crisis.
Period Socio-demographic
characteristics Before crisis n = 235
a Anova, differences in mean age and height for all subgroups between “before crisis”, “transition”,
and “during crisis”.
3. Effect of the crisis on food habits and food intake (Paper I, III, IV and V)
RESULTS
(all women), 4) Rice is essential for survival and to increase one’s strength, and to make pregnant women stronger during delivery (all women), 5) In some areas the price of non-rice staple foods was higher than that of rice (women who lived in hilly area), 6) Cooking methods for non-rice staple foods were rather difficult (all women), 7) Non-rice staple foods were difficult to combine with common side dishes (all women), and 8) The non-rice staple foods could not be stored as long as rice (all women) (paper IV).
Table 7. Average daily intake of food/food groups (g) according to time of data collection in relation to the economic crisis.
Period p
Mann-Whitney U Test/Student’s t-test, differences in median/mean food/food group intake between “before crisis” and “transition” period among the women.
b
Mann-Whitney U Test/Student’s t-test, differences in median/mean food/food group intake between “before crisis” and “during crisis” period among the women.
In addition, the intake of nuts and pulses, including soybeans, increased between “before crisis” and “during crisis”, although not significantly. In contrast, the intake of non-rice staple foods (p<0.05), fruits (non-significant) and animal foods (p<0.05) decreased. Thus the diets became mainly plant-based. Sugar and fat and oils displayed a stable pattern. Jamu is a traditional herbal medicine commonly used by Indonesians. Among the 450 pregnant women in quantitative study, only 68 (15%) had
consumedjamu during pregnancy and the consumption was lowest
RESULTS
taboos also existed. In total, 126 (28%) of the pregnant women avoided certain food items because of food taboos. Among the 351 occasions of avoided food items, in 103 (30%) cases the women did not know the reason for their avoidance. Our qualitative study revealed that sugar, fat and oil were regarded to make the foods tasty. Although all women interviewed believed that nutritious foods were essential to achieve maternal and foetal well-being, during the economic crisis, most women preferred to serve tasty foods rather than nutritious foods, for themselves and their families. All women interviewed reported that although they knew that pregnant women need extra food, the husband and children ate first at meal times (Paper IV).
The women worried not only about the increases in food prices, but also about increases in fees of education and health care survices. One women interviewed said (Paper V):
“Although I keep some chicken in our home garden, I and my family do not consume these. Instead I sell them, because my children need more funds for studying at the High School. During the crisis, not only the price of foods and other basic necessities have increased, but the education fees also have increased”.
With regard to the socio-economic groups, a significant increase in rice intake was observed for the rural, poor women with access to rice fields between “before crisis” and “during crisis” (p<0.05) (Paper I, Table 3). Concurrently, non-rice staple foods intake in this subgroup decreased, and the difference was significant
(p<0.05). Rich women decreased their animal food intake. Rural
poor landless increased their consumption of nuts and pulses (p<0.05) between “before crisis” and “during crisis” (Paper III, Table 2).
RESULTS
consumption “during the crisis”. Some women with access to rice fields stored the rice production in the rice barn.
Relatives and neighbours commonly assisted the poor families with foods, especially with rice and vegetables. Further, more than 70% of the women cultivated different varieties of vegetables and fruits in their home gardens. Other food sources were sea shores, lands, rivers, ponds and grasslands (Figure 8). Food productions from these resources were primarily consumed by the women and their families. Compared to before crisis, the percentage of women who kept duck in the home garden increased during the crisis (p<0.05) (Paper V).
Figure 8. A woman freely picking the water spinach in a grassland.
RESULTS
intake. Most calcium intake (27%) and iron intake (38%) were derived from nuts and pulses. The food item in the nuts and pulses group that was of most importance to calcium and iron intake was
fermented soybeans (tempe). The main source of fat was shown to
be fat and oils (44%), and in particular cooking oil was important. The dominant contributor of vitamin A intake was vegetables
(53%). Spinach (Amaranthus Hibridus) and cassava leaves were
Table 8. Contribution (%) of various foods/food groups to nutrient intake according to time of data collection in relation to the economic crisis.
Time period Nutrient
Before Transition During p
Food Mean ± SD Food Mean ± SD Food Mean ± SD a b
Energy Rice 48 ± 12 Rice 50 ± 12 Rice 51 ± 9 0.10 0.31
Protein Rice 38 ± 12 Rice 38 ± 11 Rice 41 ± 10 0.50 0.01
Fat Fat and oils 44 ± 9 Fat and oils 46 ± 10 Fat and oils 47 ± 8 0.1 0.01
Carbohydrate Rice 62 ± 12 Rice 65 ± 13 Rice 67 ± 11 0.1 0.01
Vitamin A Vegetables 53 ± 25 Vegetables 51 ± 24 Vegetables 66 ± 24 0.48 0.02
Calcium Nuts and pulses 27 ± 11 Nuts and pulses 28 ± 11 Nuts and pulses 30 ± 12 0.48 0.02
Iron Nuts and pulses 38 ± 14 Nuts and pulses 40 ± 13 Nuts and pulses 41 ± 13 0.13 0.35
a
Student’s t-test differences in contribution of foods/food groups to nutrient intake between “before crisis” and “transition” period among the women.
b Student’s
t-test differences in contribution of foods/food groups to nutrient intake between “before crisis” and “during crisis” period among the women.
R
ESULTS
4
RESULTS
The correlations between consumption of rice and side dishes (animal foods, nuts and pulses, vegetables and fruits) in each time period are presented in Figures 9, 10 and 11. Before crisis, a positive significant correlation (p<0.05) between the intake of rice and pulses plus vegetables was found (Figure 9). This means that the more rice a woman consumed, the more pulses she also consumed. A different pattern was found regarding rice and animal foods. In this case the correlation was negative: the more rice the less animal foods. For rice and fruits the correlation was positive but weak.
Figure 9. Correlation between intake of rice and intake of animal foods, nuts and pulses, vegetables and fruits among pregnant Indonesian women before crisis.
RESULTS
Figure 10. Correlation between intake of rice and intake of nuts and pulses, animal foods, fruits and vegetables among pregnant Indonesian women in transition period.
Figure 11. Correlation between intake of rice and intake of animal foods, nuts and pulses, vegetables and fruits among pregnant Indonesian women during crisis.
RESULTS
4. Effect of the crisis on nutrient intake (Paper I and II)
Mean nutrient intakes in the period before the crisis are shown in Table 9. Energy, vitamin A, calcium or iron intakes were lower than the Indonesian EARs. Overall, more than 40% of the pregnant women had inadequate protein, vitamin A, or calcium intakes and all women had inadequate iron intakes. With regard to socio-economic groups, before the crisis there was a tendency towards a higher intake of carbohydrates, vitamin A, calcium and iron among urban women as compared to rural pregnant women; this was significant. Likewise, there was a significantly different intake “before crisis” for protein and fat for the different socio-economic groups, with higher values for rich women compared to other subgroups (p-valuees in interval 0.00-0.04) (Paper II, Table 2).
Table 9. Average energy and nutrient intake per day before the crisis and percentage of pregnant Indonesian women with a nutrient intake below Indonesian Estimated Average Requirements (EARs) (n=235).
Nutrient Nutrient intake EARs Percentage of EARs
Prevalence of inadequacy a(%)
Energy (kcal) 1875 + 534 2200-2400 78 82
Protein (g) 46 + 14 43-52 c 109 40
Fat (g) 44 + 17 40-42 d - -
Carbohydrate (g) 327+95 270-285 e - -
Vitamin A (IU) 1540 (717-1961) f 2100-2400 c 79 74
Calcium (mg) 360 + 140 640-720 c 56 96
Iron (mg) 14 + 5 39-41 c 36 100
a Proportion of pregnant women with nutrient intake below the EARs.
b Mean + SD.
cIndonesian EARs (Muhilal, 2002).
d A general recommendation is that the fat content of the Indonesian diet should not exceed 20% of
the caloric intake (Muhilal et al, 1998).
e A general recommendation is that the carbohydrate content of the Indonesian diet should be at
RESULTS
Table 10 shows significantly higher mean intakes of calcium and iron when including the information on supplements (p<0.05). However, even when these intakes of vitamin and mineral supplements were included in the analyses, more than 95% of women still had inadequate calcium and iron intakes, respectively. This reflects the fact that only seven women out of 450 were consuming supplements.
Table 10. Differences in calcium and iron intake with and without supplements (n = 450).
Nutrient Nutrient intake
without supplement
Nutrient intake with supplement
p
Calcium (mg) 360 ± 138 466 ± 304 <0.01
Iron (mg) 14 ± 5 17 ± 8 <0.01
Comparisons of nutrient intakes according to time-period are presented in Table 11. When comparing “before” and “transition”, there were no significant changes in energy, protein, carbohydrates, calcium or iron intake, but a significant increase in vitamin A intake. In the comparison between “before crisis” and “during crisis”, a significant increase in carbohydrate intake was observed (p<0.05).
RESULTS
Table 11. Average energy and nutrient intakes of pregnant women according to time of data collection in relation to the economic crisis.
Period p
1540 (717-1961) 1708 (833-2691) 1452 (817-2313) 0.02 0.12
Calcium (mg)
360 + 140 355 + 134 364 + 137 0.72 0.67
Iron (mg) 14 + 5 14 + 5 15 + 5 0.85 0.21
aMann-Whitney U Test/Student’s
t-test, differences in median/mean food/food group intake
between “before crisis” and “transition” period among the women. b
Mann-Whitney U Test/Student’s t-test, differences in median/mean food/food group intake between
“before crisis” and “during crisis” period among the women.
RESULTS
subgroups (difference between “before crisis” and “during crisis”, p<0.05) (Paper II, Table 3).
Table 12. Average nutrient densities of pregnant women according to time of measurement in relation to the economic crisis.
Period p
(IU/1000 kcal) 724 (413-1090) 875 (486-1361) 733 (467-1142)
<0.01 0.34
Calcium
(mg/1000 kcal) 192 + 53 194 + 66 186 + 50 0.84 0.26
Iron
(mg/1000 kcal) 7 + 2 8 + 2 7 + 2 0.48 0.96
a Mann-Whitney U Test/Student’s t-test, differences in median/mean food/food group intake
between “before crisis” and “transition” period among the women.
b Mann-Whitney U Test/Student’s
t-test, differences in median/mean food/food group intake
between “before crisis” and “during crisis” period among the women.
5. Effect of the crisis on nutritional status (Paper I and II)
RESULTS
Figure 12. Mid upper arm circumference (MUAC) of pregnant women according to socio-economic groups and time period of data collection.
The median serum ferritin concentration was 13.5 (8.1-21.4) Pg/l
in the total sample. The total prevalence of low ferritin stores was 42%. With respect to socio-economic groups, between the “before crisis” and “transition” periods, there was a significant decrease in serum feritin concentration among the rural, poor, landless (Figure 13, p<0.05). Between the “before crisis” and “during crisis” periods, a significant decrease in serum ferritin concentration occurred among the urban poor (p<0.05). In contrast, a significant increase in serum ferritin concentration was experienced by the rich women between “before crisis” and “during crisis” (Paper II, Table 4).
Before crisis Transition During crisis 22
23 24 25 26 27 28
Rural, poor, landless Rural, poor, access to rice field Urban, poor
Rich
Period
MUAC (cm
)
RESULTS
Figure 13. Serum ferritin concentration of pregnant women according to socio-economic group and time period of data collection.
Rural, poor, landless Rural, poor, access to rice field Urban, poor
Rich
Before crisis Transition During crisis 0 Rural, poor, access to rice field Urban, poor
Rich
MAIN FINDINGS
MAIN FINDINGS
Objective Results
To evaluate the adequacy of dietary intake before the crisis in comparison with the Indonesian Estimated Average Requirements (EARs)
1. Before crisis, more than 80% of the pregnant women had inadequate energy, and more than 40% had inadequate protein and vitamin A intake.
2. Almost all women had inadequate calcium and iron intake.
To explore the food habits in relation to the economic crisis
1. During the economic crisis, tasty foods were more important than nutritious foods
2. Twenty eight percent of women observed food taboos. Most avoided food items were beneficial or neutral. In 30% of taboo consumers, the women did not know the reason for the avoidance.
3. In general, 15% percent of women consumed jamu
(traditional medicine)
4. Rice was believed to have the highest value for survival, to give strength and to be easier to store and cook than non-rice staple foods
5. Husband and children had the highest priority to receive foods at meal times
To explore the coping strategies during the economic crisis
1. Rural, poor, landless and urban poor women borrowed rice and vegetables, and/or were given by relatives and neighbours.
2. Rich women did not change the kind of foods eaten, but they decreased the portion sizes of expensive foods such as meat, milk and fish.
3. Rural, poor with access to rice fields stored or borrowed rice in rice barn managed by the staff of village office. 4. Fish, eel, shrimp and shell fish picked from rivers, ponds
and sea shores were regarded as common goods. 5. More women kept ducks in their home gardens during the
economic crisis than before the crisis (p<0.05).
6. A family selling assets such as window or door is likely a very poor family.
MAIN FINDINGS
To describe the consequences of the economic crisis with respect to food intake.
1. The food patterns consisted of rice, nuts and pulses, and vegetables, meaning that food intake was mainly plant-based.
2. Rice remained an important supplier of energy, protein and carbohydrates during the economic crisis
3. Rice behaved as a Giffen good.
4. Nuts and pulses were an important supplier of calcium and iron.
5. Vegetables were an important supplier of vitamin A. 6. During crisis, the rural, poor with access to rice fields
increased their intake of rice and decreased their intake of non-rice staple foods (p <0.05).
7. During crisis, rich women decreased their consumption of animal food (p<0.05).
To describe the consequences of the economic crisis with respect to nutrient intake and nutritional status.
1. Before crisis, the carbohydrate, vitamin A, calcium, and iron intake of urban, poor women were the highest (p<0.05). 2. The protein, fat, carbohydrate, and calcium intakes of urban
poor decreased during the transition (p<0.05).
3. Rich women experienced a significant decrease in fat intake “during crisis” (p<0.05).
4. Negative changes in fat density during crisis were
experienced by rich and the rural, poor, access to rice fields subgroups (p<0.05).
5. A significant increase in carbohydrate densities was seen for the rich and rural, poor, access to rice fields (p<0.05). 6. Urban poor experienced decreased MUAC (not significant)
and decreased serum ferritin concentration during crisis (p<0.05).
DISCUSSION
DISCUSSION
In this thesis, the consequences of the economic crisis with respect to the food and nutrition of pregnant Indonesian women were studied. Food habits, food intake, nutrient intake and nutritional status were investigated by means of in-depth interviews, focus group discussions, observation, survey questions, anthropometric measures and blood samples. Based on the price levels of three basic commodities, the period under study was divided into three different parts: “before crisis”, “transition” and “during crisis”. The study was carried out in both urban and rural areas. Although the quantitative study design was cross-sectional, data were collected over several years, and thus this study can present a picture of the consequences of the economic crisis in terms of food intake, nutrient intake and nutritional status among pregnant women. In addition, the qualitative study addressed similar issues as the quantitative study. Taken together, the two studies provide a coherent picture of food and nutritional consequences of the crisis.
1. Power and validity
Quantitative study