A COMPARATIVE STUDY ON STUDENTS’ ACHIEVEMENT TAUGHT PRESENT CONTINUOUS TENSE BY USING DIALOGUE AND
READING PASSAGE AT THE SECOND YEAR OF SMPN 2 BANYUDONO IN THE ACADEMIC YEAR OF 20012/2013
PUBLICATION ARTICLE
Submitted as a Partial Fulfillment of the Requirements for Getting Bachelor Degree of Education
in English Department
DIAN WIDAYANTI A 320090095
SCHOOL OF TEACHER TRAINING OF EDUCATION MUHAMMADIYAH UNIVERSITY OF SURAKARTA
A COMPARATIVE STUDY ON STUDENTS’ ACHIEVEMENT TAUGHT PRESENT CONTINUOUS TENSE BY USING DIALOGUE AND
READING PASSAGE AT THE SECOND YEAR OF SMPN 2 BANYUDONO IN THE ACADEMIC YEAR OF 20012/2013
Dian Widayanti A 320090095
ABSTRACT
This study is aimed at comparing the result of teaching present continuous tense taught by using dialogues and reading passage. The population of this study is second year students of SMP N 2 Banyudono academic year of 2012/2013. To take sample the writer used random sampling technique. The writer took two classes for this research, students taught by using dialogues is applied in class VIII C and students taught by using reading passage is applied in class VIII D. Each class consists of 30 students. From the result of the study, it is known that there is significant difference in students’ achievement present continuous tense taught by using dialogues and reading passage is accepted. The second hypothesis shows that the students taught by using dialogues have better than taught by using reading passage.
Keywords: Present Continuous Tense, Dialogues, Reading Passage
INTRODUCTION
According to structural learning theory, there are many rules to be learned consisting of a domain, range, and procedure. There may be alternative rule sets for any given class of tasks. Problem solving maybe facilitated when higher older rules are used, i.e., rules that generate new rules. Higher older rule account for creative behavior (an anticipated outcomes) as well us the ability to solve complex problem by making it possible to generate (learn) new rules.
The English teacher, who is influenced by recent theoretical work on the difference between language and acquisition, tends, not to teach structure at all. the students acquire the first language without covering structure instruction and stimulating student to learn their second language the same way. they assume that student will absorb structure rule as they hear, read and use language in communication activities.
The teaching English process that has been conducted to teach structure in the past was traditional one where the teachers gives the sentence pattern to the
students directly without conducting it with speaking skill or reading skill. Based on this condition the writer wants to find the students’ different achievement taught present continuous tense by using dialogue and reading passage. This tense shows an activity that is being done in a certain period
RESEARCH METHOD
The type of this research is descriptive research because she uses numeral forms for analyzing the data (Arikunto, 2002:10). The data of the result come from the result of pre-test and post-test. The object of the study is the student’s ability in mastering structure especially Present Continuous Tense using reading passage and dialogues. The data of this research are taken from the answer sheets of the test in the classroom activity which is showing into written data. Form of the data is table. The sources of the data in this research are event, informant and document.
1. Event is teaching-learning process before test by the student of eight grade of SMPN 2 Banyudono 2012/2013
2. Informants are the teacher and students of eight grade of SMPN 2 Banyudono. 3. Document is written materials, books related to the problem and test result
Method of Collecting Data is as follows: 1. Carrying out The Experiment
She starts to give experimental treatment after getting well balanced group. The control group is taught the Present Continuous Tense by using reading passage while as by using dialogues method.
2. Document
The forms of documents are report, material, lesson plan and test result. 3. Test
Considering the importance of good test, to know the quality of items the researcher uses two important characteristics of good test. They are validity and reliability.
RESEARCH RESULT AND DISSCUSSION 1. Research Finding
of students whose scores are analyzed, i.e. the group to whom dialogues is applied and the group to whom reading passage method is applied. The dialogues group is applied in class VIII D and the reading passage group is applied in class VIII C. There are 30 students in class VIII C and 30 students in class VIII D. Thus, there are 60 students as the subjects of this research. a. The Students’ Scores Taught by Using Dialogues
The result of the test shows that the highest score of pre-test is 16 and the lowest is 5, while the highest score of post-test is 19 and the lowest is 11. The mean of the score is measured from the difference of the post-test and pre-post-test. The mean is 7.86 (see appendix 16). The distribution frequency of these data can be seen on Table 1, 2 and the polygon distribution frequency can be seen on the figure 1 and 2.
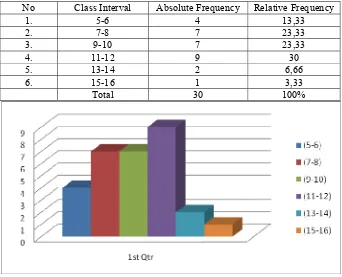
Table 1: The Distribution Frequency of Pre-test Taught by Using Dialogues.
No Class Interval Absolute Frequency Relative Frequency
1. 5-6 4 13,33
2. 7-8 7 23,33
3. 9-10 7 23,33
4. 11-12 9 30
5. 13-14 2 6,66
6. 15-16 1 3,33
Total 30 100%
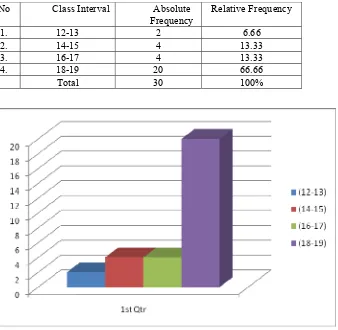
The table and figure 1 explain that in the class interval of 5, the absolute frequency is 4, while the relative frequency is 13.33%. These mean that, there are four students who had 5-6 correct answers which belong to the lowest score. In highest class interval of 15-16, the absolute frequency is 1, and the relative frequency is 3.33%. it describes that there are a student who had 15-16 correct answers and also the highest score. The highest absolute frequency is 9 found in the class interval of 11-12. While the lowest absolute frequency is 1 found in the class interval 15-16. Table 2: The Distribution Frequency of Post-test Taught by Using Dialogues.
No Class Interval Absolute
Frequency
Relative Frequency
1. 12-13 2 6.66
2. 14-15 4 13.33
3. 16-17 4 13.33
4. 18-19 20 66.66
Total 30 100%
The result of post-test explains that the lowest class interval also belongs to the lowest absolute frequency. The lowest class interval is12-13, and that the lowest absolute frequency is 2. The highest class interval is 18-19 whose absolute is 20. It means that there are 20 students who had the highest score. The highest absolute frequency is 20. It is found in the class interval of 18-19.
b. The Students’ Scores Taught by Using Reading Passage.
The result of the test shows that the highest score of pre-test is 16 and the lowest score is 5. While the highest score of post-test is 19 and the lowest score is 11. The mean of the score is measured from the difference of post-test and pre-test. The mean is 7.7 (see appendix 16). The distribution frequency of these data can be seen on table 3, 4 and the distribution frequency polygon can be seen on figure 3 and 4 .
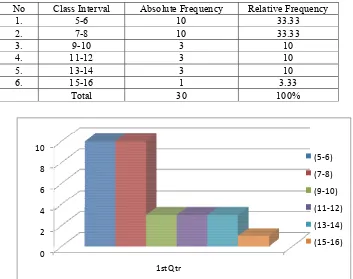
Table 3: The Distribution Frequency of Pre-test Taught by Using Reading Passage.
No Class Interval Absolute Frequency Relative Frequency
1. 5-6 10 33.33
2. 7-8 10 33.33
3. 9-10 3 10
4. 11-12 3 10
5. 13-14 3 10
6. 15-16 1 3.33
Total 30 100%
0 2 4 6 8 10 1st Qtr (5‐6) (7‐8) (9‐10) (11‐12) (13‐14) (15‐16)
The table and figure 4 explain that the lowest class interval is 5-6 and its absolute frequency is 10. The highest class interval is 15-16, and its absolute frequency is 1. These mean that, there is only 10 students who had the lowest and highest score, which is 1. The highest absolute frequency is 10 and it is found in the class interval of 5-6 and 7-8.
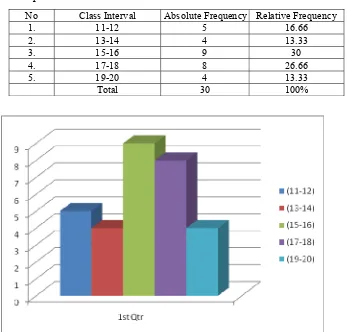
Table 4: The Distribution Frequency of Post-test in the Reading Passage Group.
No Class Interval Absolute Frequency Relative Frequency
1. 11-12 5 16.66
2. 13-14 4 13.33
3. 15-16 9 30
4. 17-18 8 26.66
5. 19-20 4 13.33
Total 30 100%
Figure 4: The Polygon of the Distribution Frequency of Post-test Taught by Using Reading Passage.
c. Students’ Achievement Level
In this research, the writer classify the students’ score into five levels of achievement as proposed by Tinambunan (1988:29) as follows: Table 5: The Levels of Students’ Achievement according to Tinambunan.
Percentage of Correct Answer
Grade Level of Achievement
93-100% A – Outstanding Out-standing Achievement
85-92% B – Very Good Above Average
75-84% C – Satisfactory Achievement
60-74% D – Very Weak Average Achievement
Below 60% E – Poor Below Average / Insufficient
The following are students’ achievement levels in post-test taught by using dialogues and reading passage.
Table 6: Students’ Achievement Levels Taught by Using Dialogues
No Number of
Students
Percentage of Correct
Level of Achievement
1. 14 93-100% Out-standing Achievement
2. 7 85-92% Above Average Achievement
3. 5 75-84% Average Achievement
4. 4 60-74% Below Average
5. 0 Below 60% Insufficient
Table 7: Students’ Achievement Levels Taught by Using Reading Passage
No Number of
Students
Percentage of Correct
Level of Achievement
1. 4 93-100% Out-standing Achievement
2. 8 85-92% Above Average Achievement
3. 9 75-84% Average Achievement
4. 7 60-74% Below Average
5. 2 Below 60% Insufficient
the students in taught by reading passage got average achievement. Here, the students taught by dialogues tend to have better achievement than the taught by reading passage.
2. Discussion
a. Hypothesis Testing
The writer uses t-test in analyzing the data. The hypothesis is accepted if the t-test value is greater than t-table. From the computation, the writer knows that the t-test value is 2.4. After t-value and t-table are compared, it shows that the t-value is higher than the t-table 1.697. It means that the hypothesis explaining that “the students taught by using dialogues method have better structure achievement than those taught by using reading passage” is accepted.
b. Data Interpretation
The data obtained shows that the results gained by the two groups are different. The students are taught by using dialogues have better result than the students that are taught by using reading passage. Besides, it can be seen from the mean score. The mean score is measured from the difference of the pre-test and post-test. The mean score of the students taught by using dialogues is 7.86 and the mean score of the students taught by using reading passage is 7.7. Thus, the difference mean between them is 0.16. From the mean score of two groups, the writer counts the value of t-test.
On the level of significance α:0.005 and degree of freedom 55, the table shows 1.697. From the computation of t-test value, the writer got the t-test value. The t-test value is 2.4 (Appendix 16). After t-value and t-table are compared, they show that t-value is higher than t-table 1.697. It means that the hypothesis explaining that “the students taught by using dialogues is better structure achievement than those taught by using reading passage”.
Besides, it can be seen from the students’ achievement level in post-test. From the table 6 and 7, they show that the students taught by using dialogues have higher achievement level than the students taught by using reading passage.
CONCLUSION
After analyzing the data, the writer gets the result of the analysis. Refering to the hypothesis testing, it is stated that t0 is 2.4. The tt for n=55 with the level of significance 0.05 is 1.697. The result shows that the hypothesis is accepted. It means that there is a significant difference in students’ achievement in structure test, between the students taught by using dialogues and reading passage. Teaching present continuous tense by using dialogues makes the students understand better the rules given. Thus, the students taught by using dialogues have better achievement in English structure test than those are taught by using reading passage. The result of the research shows that dialogues can increase the students’ ability of structure achievement. It means that dialogues are appropriate to be applied in teaching present continuous tense to the students of SMPN 2 Banyudono. The selection of dialogues is reasonable because it is suitable to the condition of the students. They are not ready to force themselves to find the conclusion of the data without the explanation from the teacher first. The conclusion above has some implications as follows:
2. The teacher can arrange the time in the class and use the time effectively to explain the present continuous tense to the students by dialogues or reading passage.
BIBLIOGRAPHY
Annastasi, A. And Urbina, S. 1997. Psychological Testing. London: Prentice Hall. Arikunto, Suharsimi. 2002. Procedure Penelitian Suatu Pendekatan Praktik.
Jakarta: PT. RinekaCipta.
Ary, D., Jacobs, L.C. and Razavieh, A. 2002. Introduction to Research in Education. Wadsworth: Thomson Learning.
Bond, Guy L and Wagner, Eva B. 1963.Teaching the Child to Read. New York: The Macmillan Company.
Budiyono.2000.Statistika Dasar untuk Penelitian .Fakultas Keguruan dan Ilmu Pendidkan: UniversitasSebelasMaret Surakarta.
Fauziati, Endang. 2002. Teaching of English as a Foreign Language (tefl).
Surakarta: Muhammadiyah University Press.
Hadi, Sutrisno. 1979. Bimbingan Menulis Skripsi – Thesis 2. Yogyakarta: Yay. BPFP-UGM.
Hallonen, Jane S and Santroct, John W. 1999.Psychology: Applied and Application 3. USA: McGraw- Hill College.
Hornby, AS. 1983. Oxford Advanced Learner’s Dictionary of Current English. London: Richard D. Inc.
Kennedy, Eddie. C. 1981. Method in Teaching Developmental Reading Second Edition Itasca. Illinois: F.E Peacock Publisher Inc.
Low, Ona. 1972. A New Certificate of Profiency English Course For Foreign Students With Use of English. London: Edward Arnold Limited.
Nasution, S. 2001. Metode Research. Jakarta: PT. BumiAksara.
Petty, WT and Jensen, JM. 1980. Developing Children’s Language. Boston: Allyn and Bacon Inc.
Richard, Jack. 1990. Error Analysis. London: Longman Group Ltd.
Sugiyono. 2006. Metode Penelitian Kuantitatif, Kualitatif, dan R&D. Jakarta: Rineka Cipta.
Shaugnessy, JJ and Zechmester BE. 1997. Research Method in Psychology.