Tree Crop Estate Statistics Of Indonesia
STATISTIK PERKEBUNAN INDONESIA
Direktorat Jenderal Perkebunan
Directorate General of Estate Crops
Jakarta, Desember 2015
Tobacco
2014 - 2016
2014 - 2016
TEMBAKAU
TEMBAKAU
STATISTIK PERKEBUNAN INDONESIA 2014-2016
TREE CROP ESTATE STATISTICS OF INDONESIA 2014-2016
Naskah/Manuscript
Direktorat Jenderal Perkebunan,
Directorate General of Estate Crops
Kementerian Pertanian
Ministry of Agriculture
Penasehat/Advisor:
Ir. Irmijati Rachmi Nurbahar, M.Sc.
Penyunting/Senior Editors:
Ir. Muh. Edi Subiyantoro, MM
Yanuar Arianto, STP, MM
Staf Penyunting/Editorial Staffs:
Widya Khonik Zuraina, S.Si
Eko Pudjianto, S.Kom
Asep Udin, S.Kom
Neny Kurniawati, S.Si
Susilo Novianto Damarjati, A.Md.
Diterbitkan oleh/Published by
Direktorat Jenderal Perkebunan
Directorate General of Estate Crops
Jl. Harsono RM No. 3 Gedung C
Pasar Minggu - Jakarta 12550
Kotak Pos 1060/Jkt,10010
Tlp. : 021 - 7815380 - 4
Fax. : 021 - 715486 - 7815586
Jakarta, Desember 2015
Jakarta, December 2015
Kata
Pengantar
K
omoditas perkebunan merupakan andalan bagi pendapatan
nasional dan devisa negara Indonesia, yang dapat dilihat dari nilai
ekspor komoditas perkebunan, pada Tahun 2014 total ekspor
perkebunan mencapai US$ 28,234 milyar atau setara dengan Rp. 367,040
triliun (asumsi 1 US$ = Rp. 13.000,00). Kontribusi sub sektor perkebunan
terhadap perekonomian nasional semakin meningkat dan diharapkan
dapat memperkokoh pembangunan perkebunan secara menyeluruh. Agar
informasi perkebunan dapat tersebar secara luas, setiap tahun diterbitkan
Buku Statistik Perkebunan Indonesia yang menyajikan data secara handal,
sahih, objektif, mutakhir dan konsisten.
S
tatistik Perkebunan Indonesia Tahun 2014-2016 menyajikan data luas areal, produksi,
produktivitas baik secara nasional maupun provinsi menurut status pengusahaannya
yaitu Perkebunan Rakyat, Perkebunan Besar Negara dan Perkebunan Besar Swasta.
Penyajian data juga dilengkapi dengan data ekspor dan impor untuk masing-masing komoditas
yang mencakup negara tujuan/asal, volume dan nilai, harga di dalam dan luar negeri serta untuk
beberapa komoditas tertentu disajikan data keseimbangan dunia.
D
ata yang disajikan merupakan hasil sinkronisasi dan validasi data statistik perkebunan
2014-2016 yang dilaksanakan secara berjenjang dari tingkat kabupaten sampai tingkat
nasional dengan mengacu pada Pedoman Pelaksanaan Pengelolaan Data Komoditas
Perkebunan yang diterbitkan Direktorat Jenderal Perkebunan. Data tersebut meliputi angka
tetap (ATAP) Tahun 2014, angka sementara (ASEM) Tahun 2015 dan angka estimasi (AESTI)
Tahun 2016. Data yang disajikan bersumber dari data primer yang dikumpulkan dari dinas yang
membidangi perkebunan di provinsi dan data sekunder yang dikutip dari data yang diterbitkan
oleh Badan Pusat Statistik (BPS), Kementerian Perindustrian, Kementerian Perdagangan, Bank
Indonesia, dan publikasi yang diterbitkan oleh asosiasi-asosiasi perkebunan baik dalam maupun
luar negeri.
B
uku ini dapat diterbitkan, atas dukungan dan kerjasama yang baik dari berbagai pihak.
Untuk itu, pada kesempatan ini, kami mengucapkan terima kasih atas dukungan dan
kerjasama tersebut. Kami menyadari bahwa buku yang diterbitkan ini masih jauh dari
sempurna. Untuk itu, kritik dan saran yang sifatnya membangun sangat diharapkan sebagai
bahan masukan dalam perbaikan penerbitan di masa datang.
S
emoga apa yang disajikan dalam buku ini dapat digunakan oleh berbagai kalangan dan
para pengguna data serta dapat dijadikan acuan dalam pengambilan kebijakan.
Jakarta, Desember 2015
DIREKTUR JENDERAL PERKEBUNAN
Ir. Gamal Nasir, MS
Preface
T
he estate crop commodities is the mainstay of national income
and Indonesia’s foreign exchange wich can be seen from export
value of the estate crop commodities. In 2014, total export of the
estate crops was US $ 28.234 billion or equivalent to Rp. 367.040 trillion
(assumed 1 US $ = Rp. 13,000.00). The contribution of estate crops sub
sector to the national economy tends to increase from year to year and
expected to strengthen overall national development. Furthermore,
to spread estate crops information widely, The Estate Crop Statistics of
Indonesia is published every year that presented reliable, valid, objective,
up to date and consistent data.
T
he Estate Crop Statistics of Indonesia 2014-2016 presents area, production and
productivity data by province and district level of smallhoder, government and private
estates. It is completed by volume, value of both export and import data, price data for
domestic and world market and also world balance data for some commodities.
D
ata presented are the result of synchronization and validation of the estate crop
statistical data 2014-2016 which are held hierarchical from the district to the national
level by using guidelines of data management of estate crop commodities. In this edition,
data of the 2014 are presented as fixed data, data of the 2015 are the preliminary data and data
of the 2016 are the estimation. The primary data were collected from the Estate Crops Province
Level and the secondary data were collected from related instution such as Board of Central
Statistics, Ministry of Industry, Ministry of Trade, Central Bank of Indonesia, the publication of
Estate Commodity Associations and others.
I
t would have been impossible to compile this book without substantional support and
contribution from many instutions. At this opportunity, we would like to thank all for their
support and cooperation. We realize that the publication still needs further improvement.
We would greatly appreciate comments and suggestions for future improvement.
H
opefully this publication will have high values for users and references for policy
makers.
Jakarta, December 2015
DIRECTOR GENERAL OF ESTATE CROPS
Ir. Gamal Nasir, MS
Kata Pengantar
Preface
...
iii
Daftar Isi
Contents
...
v
Daftar Gambar
List of Figures...
vi
Daftar Tabel
List of Tables ...
vii
Daftar
Isi
Gambar 1. Perbandingan Luas Areal dan Produksi Tembakau Menurut Status
Pengusahaan Tahun 2014
Figure
Area and Production Comparison Graph of Tobacco by Farming
Category, 2014 ...
1
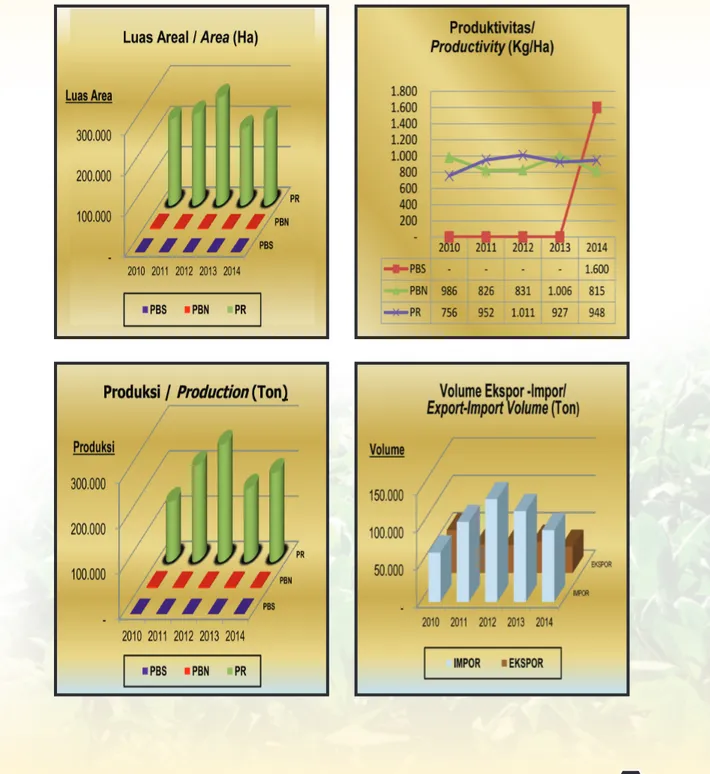
Gambar 2. Perkembangan Luas Areal, Produksi, Produktivitas dan
Volume Ekspor-Impor Tembakau Tahun 2010 - 2014
Figure
Area, Production, Productivity and Export-Import Volume Trend
Graph of Tobacco, 2010 - 2014 ...
2
Daftar
Gambar
Tabel 1
Luas Areal dan Produksi Tembakau Menurut Status
Pengusahaan Tahun 1975-2015
Table
Area and Tobacco Production by Farming Category, 1975-2015 ...
3
Tabel 2.
Volume dan Nilai Ekspor - Impor Tembakau Tahun 1970-2015
Table
Export - Import Volume and Value of Tobacco, 1970-2015 ...
4
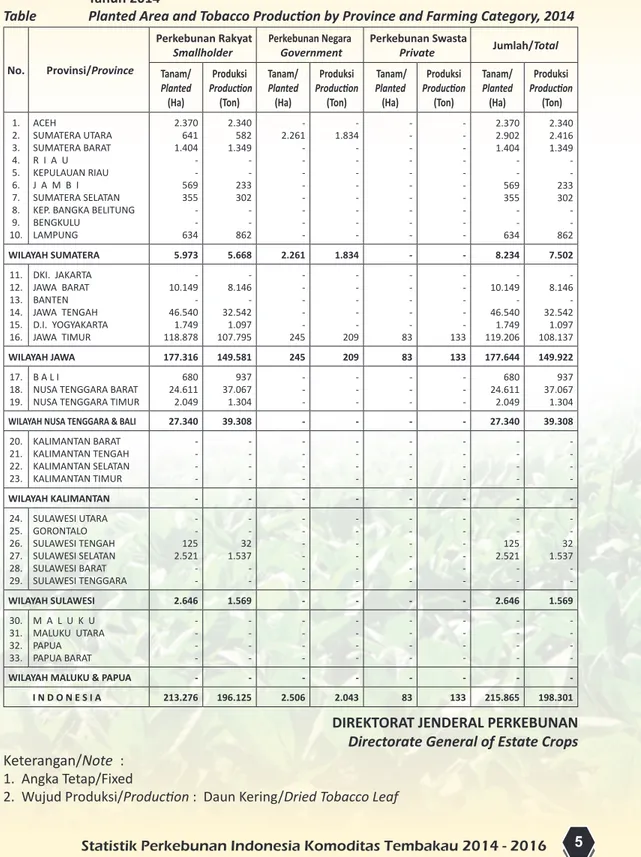
Tabel 3.
Luas Tanam dan Produksi Tembakau Menurut Provinsi dan
Status Pengusahaan Tahun 2014
Table
Planted Area and Tobacco Production by Province and
Farming Category, 2014 ...
5
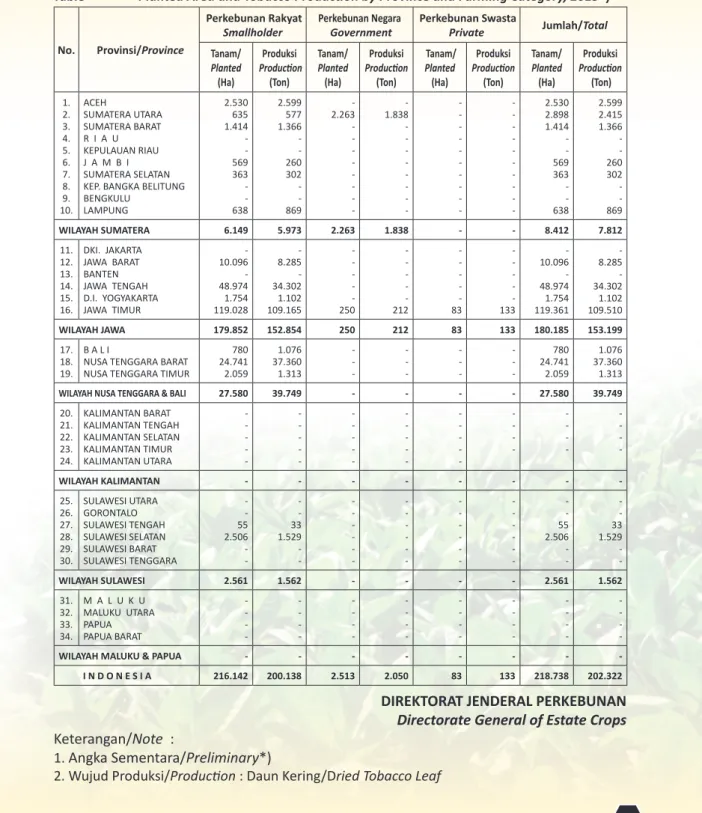
Tabel 4.
Luas Tanam dan Produksi Tembakau Menurut Provinsi dan
Status Pengusahaan Tahun 2015*)
Table
Planted Area and Tobacco Production by Province and
Farming Category, 2015*) ...
6
Tabel 5.
Luas Tanam dan Produksi Tembakau Menurut Provinsi dan
Status Pengusahaan Tahun 2016**)
Table
Planted Area and Tobacco Production by Province and
Farming Category, 2015*) ...
7
Tabel 6.
Luas Panen dan Produksi Tembakau Menurut Provinsi dan
Status Pengusahaan Tahun 2014
Table
Harvested Area and Tobacco Production by Province and
Farming Category, 2014 ...
8
Tabel 7.
Luas Panen dan Produksi Tembakau Menurut Provinsi dan
Status Pengusahaan Tahun 2015*)
Table
Harvested Area and Tobacco Production by Province and
Farming Category, 2015*) ...
9
Tabel 8.
Luas Panen dan Produksi Tembakau Menurut Provinsi dan
Status Pengusahaan Tahun 2016**)
Table
Harvested Area and Tobacco Production by Province and
Farming Category, 2016**) ...
10
Tabel 9.
Luas Areal dan Produksi Tembakau Perkebunan Rakyat,
Besar Negara dan Besar Swasta (PR+PBN+PBS)
Menurut Provinsi dan Keadaan Tanaman Tahun 2014
Table
Area and Tobacco Production of Smallholder, Government and
Private Estate by Province and Tree Crops Classification, 2014 ...
11
Tabel 10.
Luas Areal dan Produksi Tembakau Perkebunan Rakyat,
Besar Negara dan Besar Swasta (PR+PBN+PBS)
Menurut Provinsi dan Keadaan Tanaman Tahun 2015*)
Table
Area and Tobacco Production of Smallholder, Government and
Private Estate by Province and Tree Crops Classification, 2015*) ...
12
Daftar
Tabel
Tabel 11.
Luas Areal dan Produksi Tembakau Perkebunan Rakyat,
Besar Negara dan Besar Swasta (PR+PBN+PBS)
Menurut Provinsi dan Keadaan Tanaman Tahun 2016**)
Table
Area and Tobacco Production of Smallholder, Government and
Private Estate by Province and Tree Crops Classification, 2016**) ...
13
Tabel 12.
Luas Areal dan Produksi Tembakau Perkebunan Rakyat
Menurut Provinsi dan Keadaan Tanaman Tahun 2014
Table
Area and Tobacco Production of Smallholder by Province and
Tree Crops Classification, 2014...
14
Tabel 13.
Luas Areal dan Produksi Tembakau Perkebunan Rakyat
Menurut Kabupaten dan Keadaan Tanaman Tahun 2014
Table
Area and Tobacco Production of Smallholder by District and
Tree Crops Classification, 2014 ...
15
Tabel 14.
Luas Areal dan Produksi Tembakau Perkebunan Rakyat
Menurut Provinsi dan Keadaan Tanaman Tahun 2015*)
Table
Area and Tobacco Production of Smallholder by Province and
Tree Crops Classification, 2015*) ...
23
Tabel 15.
Luas Areal dan Produksi Tembakau Perkebunan Rakyat
Menurut Provinsi dan Keadaan Tanaman Tahun 2016**)
Table
Area and Tobacco Production of Smallholder by Province and
Tree Crops Classification, 2016**) ...
24
Tabel 16.
Luas Areal dan Produksi Tembakau Perkebunan Besar Negara
Menurut Provinsi dan Keadaan Tanaman Tahun 2014
Table
Area and Tobacco Production of Government Estate by Province and
Tree Crops Classification, 2014...
25
Tabel 17.
Luas Areal dan Produksi Tembakau Perkebunan Besar Negara
Menurut Kabupaten dan Keadaan Tanaman Tahun 2014
Table
Area and Tobacco Production of Government Estate by District and
Tree Crops Classification, 2014...
26
Tabel 18.
Luas Areal dan Produksi Tembakau Perkebunan Besar Negara
Menurut Provinsi dan Keadaan Tanaman Tahun 2015*)
Table
Area and Tobacco Production of Government Estate by Province and
Tree Crops Classification, 2015*) ...
27
Tabel 19.
Luas Areal dan Produksi Tembakau Perkebunan Besar Negara
Menurut Provinsi dan Keadaan Tanaman Tahun 2016**)
Table
Area and Tobacco Production of Government Estate by Province and
Tree Crops Classification, 2016**) ...
28
Tabel 20.
Luas Areal dan Produksi Tembakau Perkebunan Besar Swasta
Menurut Provinsi dan Keadaan Tanaman Tahun 2014
Table
Tobacco Area and Production of Private Estate by Province and
Tree Crops Classification, 2014...
29
Tabel 21.
Luas Areal dan Produksi Tembakau Perkebunan Besar Swasta
Menurut Kabupaten dan Keadaan Tanaman Tahun 2014
Table
Tobacco Area and Production of Private Estate by District and
Tabel 22.
Luas Areal dan Produksi Tembakau Perkebunan Besar Swasta
Menurut Provinsi dan Keadaan Tanaman Tahun 2015*)
Table
Tobacco Area and Production of Private Estate by Province and
Tree Crops Classification, 2015*) ...
31
Tabel 23.
Luas Areal dan Produksi Tembakau Perkebunan Besar Swasta
Menurut Provinsi dan Keadaan Tanaman Tahun 2016**)
Table
Tobacco Area and Production of Private Estate by Province and
Tree Crops Classification, 2016**) ...
32
Tabel 24.
Volume dan Nilai Ekspor - Impor Tembakau Menurut
Negara Tujuan dan Asal Tahun 2014
Table
Export - Import Volume and Value of Tobacco by Destination and
Origin Country, 2014 ...
33
Tabel 25.
Perkembangan Harga Rata-rata Triwulanan Tembakau di Pasar
Domestik Tahun 2014
Gambar 1. Perbandingan Luas Areal dan Produksi Tembakau Menurut Status Pengusahaan
Tahun 2014
Gambar 2. Perkembangan Luas Areal, Produksi, Produktivitas dan Volume Ekspor-Impor
Tembakau Tahun 2010 - 2014
Figure
Area, Production, Productivity and Export-Import Volume Trend Graph of
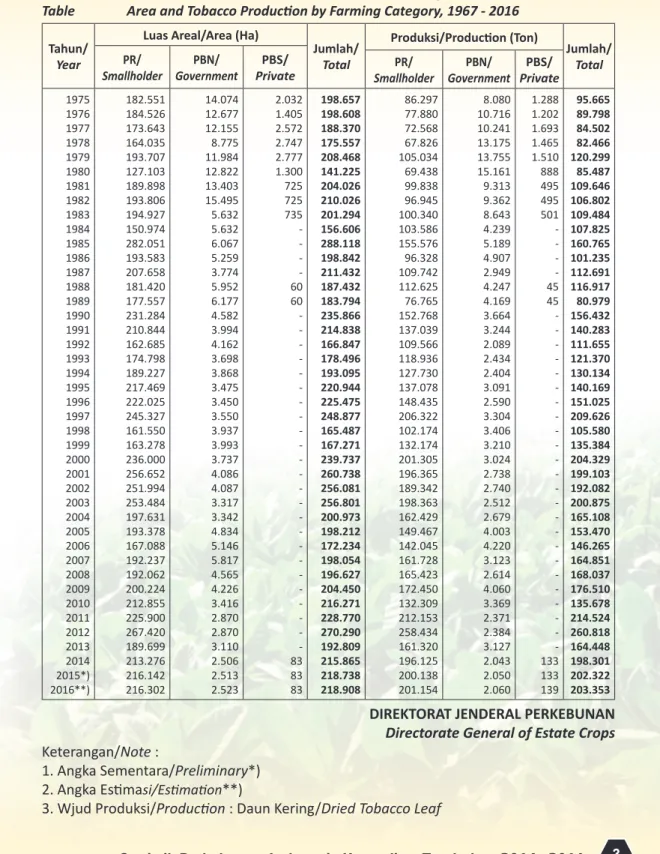
Tabel 1
Luas Areal dan Produksi Tembakau Menurut Status Pengusahaan Tahun 1967 - 2016
Table
Area and Tobacco Production by Farming Category, 1967 - 2016
Tahun/
Year
Luas Areal/Area (Ha)
Jumlah/
Total
Produksi/Production (Ton)
Jumlah/
Total
PR/
Smallholder
Government
PBN/
Private
PBS/
Smallholder
PR/
Government
PBN/
Private
PBS/
1975
1976
1977
1978
1979
1980
1981
1982
1983
1984
1985
1986
1987
1988
1989
1990
1991
1992
1993
1994
1995
1996
1997
1998
1999
2000
2001
2002
2003
2004
2005
2006
2007
2008
2009
2010
2011
2012
2013
2014
2015*)
2016**)
182.551
184.526
173.643
164.035
193.707
127.103
189.898
193.806
194.927
150.974
282.051
193.583
207.658
181.420
177.557
231.284
210.844
162.685
174.798
189.227
217.469
222.025
245.327
161.550
163.278
236.000
256.652
251.994
253.484
197.631
193.378
167.088
192.237
192.062
200.224
212.855
225.900
267.420
189.699
213.276
216.142
216.302
14.074
12.677
12.155
8.775
11.984
12.822
13.403
15.495
5.632
5.632
6.067
5.259
3.774
5.952
6.177
4.582
3.994
4.162
3.698
3.868
3.475
3.450
3.550
3.937
3.993
3.737
4.086
4.087
3.317
3.342
4.834
5.146
5.817
4.565
4.226
3.416
2.870
2.870
3.110
2.506
2.513
2.523
2.032
1.405
2.572
2.747
2.777
1.300
725
725
735
-
-
-
-
60
60
-
-
-
-
-
-
-
-
-
-
-
-
-
-
-
-
-
-
-
-
-
-
-
-
83
83
83
198.657
198.608
188.370
175.557
208.468
141.225
204.026
210.026
201.294
156.606
288.118
198.842
211.432
187.432
183.794
235.866
214.838
166.847
178.496
193.095
220.944
225.475
248.877
165.487
167.271
239.737
260.738
256.081
256.801
200.973
198.212
172.234
198.054
196.627
204.450
216.271
228.770
270.290
192.809
215.865
218.738
218.908
86.297
77.880
72.568
67.826
105.034
69.438
99.838
96.945
100.340
103.586
155.576
96.328
109.742
112.625
76.765
152.768
137.039
109.566
118.936
127.730
137.078
148.435
206.322
102.174
132.174
201.305
196.365
189.342
198.363
162.429
149.467
142.045
161.728
165.423
172.450
132.309
212.153
258.434
161.320
196.125
200.138
201.154
8.080
10.716
10.241
13.175
13.755
15.161
9.313
9.362
8.643
4.239
5.189
4.907
2.949
4.247
4.169
3.664
3.244
2.089
2.434
2.404
3.091
2.590
3.304
3.406
3.210
3.024
2.738
2.740
2.512
2.679
4.003
4.220
3.123
2.614
4.060
3.369
2.371
2.384
3.127
2.043
2.050
2.060
1.288
1.202
1.693
1.465
1.510
888
495
495
501
-
-
-
-
45
45
-
-
-
-
-
-
-
-
-
-
-
-
-
-
-
-
-
-
-
-
-
-
-
-
133
133
139
95.665
89.798
84.502
82.466
120.299
85.487
109.646
106.802
109.484
107.825
160.765
101.235
112.691
116.917
80.979
156.432
140.283
111.655
121.370
130.134
140.169
151.025
209.626
105.580
135.384
204.329
199.103
192.082
200.875
165.108
153.470
146.265
164.851
168.037
176.510
135.678
214.524
260.818
164.448
198.301
202.322
203.353
DIREKTORAT JENDERAL PERKEBUNAN
Directorate General of Estate Crops
Keterangan/Note :
1. Angka Sementara/Preliminary*)
2. Angka Estimasi/Estimation**)
Tabel 2.
Volume dan Nilai Ekspor - Impor Tembakau Tahun 1970 - 2015
Table
Export - Import Volume and Value of Tobacco, 1970 - 2015
Tahun/
Year
Ekspor/Export
Impor/Import
Volume/Volume
(Ton)
Nilai/Value
(000 US$)
Volume/Volume
(Ton)
Nilai/Value
(000 US$)
1970
1971
1972
1973
1974
1975
1976
1977
1978
1979
1980
1981
1982
1983
1984
1985
1986
1987
1988
1989
1990
1991
1992
1993
1994
1995
1996
1997
1998
1999
2000
2001
2002
2003
2004
2005
2006
2007
2008
2009
2010
2011
2012
2013
2014
2015*)
10.799
17.748
25.638
32.558
25.513
19.762
20.630
25.927
25.586
23.362
28.339
24.800
19.100
22.400
19.317
20.227
23.092
18.745
18.239
17.721
17.401
22.403
32.365
37.259
30.926
21.989
33.240
42.281
49.960
37.096
35.957
43.030
42.686
40.638
46.463
53.729
53.729
46.834
50.269
52.515
57.408
38.905
37.110
41.765
35.009
35.123
4.167
15.206
29.958
39.736
35.555
35.955
39.260
55.520
54.639
55.556
58.848
50.300
37.600
38.200
42.994
48.006
62.530
57.085
42.746
70.312
58.612
57.862
80.949
66.014
53.261
61.456
85.623
104.743
147.552
91.833
71.287
91.404
76.684
62.874
90.618
117.433
107.787
124.423
133.196
172.629
195.633
146.698
159.564
199.589
181.323
185.082
2.942
4.767
8.176
5.616
16.769
9.661
9.455
9.476
11.909
13.148
20.047
21.622
16.563
13.523
13.229
7.942
9.824
11.542
10.510
13.601
26.546
28.542
25.108
30.226
40.321
47.953
45.060
47.108
23.219
40.914
34.248
44.346
33.289
29.579
35.171
48.142
54.514
69.742
77.302
53.199
65.685
106.570
137.426
121.218
95.732
78.033
1.622
2.040
3.458
3.922
13.460
5.177
4.673
5.428
9.114
9.116
26.516
28.150
33.398
16.547
21.804
10.130
21.412
27.775
27.543
24.827
41.963
58.430
64.547
76.995
100.217
104.474
134.153
157.767
108.464
128.021
114.834
139.608
105.953
95.190
120.854
179.201
189.915
267.083
330.510
290.170
378.710
507.188
658.922
627.301
569.776
464.235
DIREKTORAT JENDERAL PERKEBUNAN
Directorate General of Estate Crops
Sumber/Source :
Badan Pusat Statistik
Tabel 3.
Luas Tanam dan Produksi Tembakau Menurut Provinsi dan Status Pengusahaan
Tahun 2014
Table
Planted Area and Tobacco Production by Province and Farming Category, 2014
No.
Provinsi/Province
Perkebunan Rakyat
Smallholder
Perkebunan Negara
Government
Perkebunan Swasta
Private
Jumlah/Total
Tanam/
Planted
(Ha)
Produksi
Production
(Ton)
Tanam/
Planted
(Ha)
Produksi
Production
(Ton)
Tanam/
Planted
(Ha)
Produksi
Production
(Ton)
Tanam/
Planted
(Ha)
Produksi
Production
(Ton)
1. 2. 3. 4. 5. 6. 7. 8. 9. 10. ACEH SUMATERA UTARA SUMATERA BARAT R I A U KEPULAUAN RIAU J A M B I SUMATERA SELATAN KEP. BANGKA BELITUNG BENGKULU LAMPUNG 2.370 641 1.404 - - 569 355 - - 634 2.340 582 1.349 - - 233 302 - - 862 - 2.261 - - - - - - - -- 1.834 - - - - - - - - - - - - - - - - - - - - - - - - - - - 2.370 2.902 1.404 - - 569 355 - - 634 2.340 2.416 1.349 - - 233 302 - - 862 WILAYAH SUMATERA 5.973 5.668 2.261 1.834 - - 8.234 7.502 11. 12. 13. 14. 15. 16. DKI. JAKARTA JAWA BARAT BANTEN JAWA TENGAH D.I. YOGYAKARTA JAWA TIMUR - 10.149 - 46.540 1.749 118.878 - 8.146 - 32.542 1.097 107.795 - - - - - 245 - - - - - 209 - - - - - 83 - - - - - 133 - 10.149 - 46.540 1.749 119.206 - 8.146 - 32.542 1.097 108.137 WILAYAH JAWA 177.316 149.581 245 209 83 133 177.644 149.922 17. 18. 19. B A L INUSA TENGGARA BARAT NUSA TENGGARA TIMUR
680 24.611 2.049 937 37.067 1.304 - - - - - - - - - - - - 680 24.611 2.049 937 37.067 1.304
WILAYAH NUSA TENGGARA & BALI 27.340 39.308 - - - - 27.340 39.308
20. 21. 22. 23. KALIMANTAN BARAT KALIMANTAN TENGAH KALIMANTAN SELATAN KALIMANTAN TIMUR - - - - - - - - - - - - - - - - - - - - - - - - - - - - WILAYAH KALIMANTAN - - - - - - - - 24. 25. 26. 27. 28. 29. SULAWESI UTARA GORONTALO SULAWESI TENGAH SULAWESI SELATAN SULAWESI BARAT SULAWESI TENGGARA - - 125 2.521 - -- - 32 1.537 - - - - - - - - - - - - - - - - - - - - - - - - - - - 125 2.521 - -- - 32 1.537 - -WILAYAH SULAWESI 2.646 1.569 - - - - 2.646 1.569 30. 31. 32. 33. M A L U K U MALUKU UTARA PAPUA PAPUA BARAT - - - - - - - - - - - - - - - - - - - - - - - - - - - - - - - -
WILAYAH MALUKU & PAPUA - - - - - - - - I N D O N E S I A 213.276 196.125 2.506 2.043 83 133 215.865 198.301
DIREKTORAT JENDERAL PERKEBUNAN
Directorate General of Estate Crops
Keterangan/Note :
1. Angka Tetap/Fixed
Tabel 4.
Luas Tanam dan Produksi Tembakau Menurut Provinsi dan Status Pengusahaan
Tahun 2015*)
Table
Planted Area and Tobacco Production by Province and Farming Category, 2015*)
No.
Provinsi/Province
Perkebunan Rakyat
Smallholder
Perkebunan Negara
Government
Perkebunan Swasta
Private
Jumlah/Total
Tanam/
Planted
(Ha)
Produksi
Production
(Ton)
Tanam/
Planted
(Ha)
Produksi
Production
(Ton)
Tanam/
Planted
(Ha)
Produksi
Production
(Ton)
Tanam/
Planted
(Ha)
Produksi
Production
(Ton)
1. 2. 3. 4. 5. 6. 7. 8. 9. 10. ACEH SUMATERA UTARA SUMATERA BARAT R I A U KEPULAUAN RIAU J A M B I SUMATERA SELATAN KEP. BANGKA BELITUNG BENGKULU LAMPUNG 2.530 635 1.414 - - 569 363 - - 638 2.599 577 1.366 - - 260 302 - - 869 - 2.263 - - - - - - - -- 1.838 - - - - - - - - - - - - - - - - - - - - - - - - - - - 2.530 2.898 1.414 - - 569 363 - - 638 2.599 2.415 1.366 - - 260 302 - - 869 WILAYAH SUMATERA 6.149 5.973 2.263 1.838 - - 8.412 7.812 11. 12. 13. 14. 15. 16. DKI. JAKARTA JAWA BARAT BANTEN JAWA TENGAH D.I. YOGYAKARTA JAWA TIMUR - 10.096 - 48.974 1.754 119.028 - 8.285 - 34.302 1.102 109.165 - - - - - 250 - - - - - 212 - - - - - 83 - - - - - 133 - 10.096 - 48.974 1.754 119.361 - 8.285 - 34.302 1.102 109.510 WILAYAH JAWA 179.852 152.854 250 212 83 133 180.185 153.199 17. 18. 19. B A L INUSA TENGGARA BARAT NUSA TENGGARA TIMUR
780 24.741 2.059 1.076 37.360 1.313 - - - - - - - - - - - - 780 24.741 2.059 1.076 37.360 1.313
WILAYAH NUSA TENGGARA & BALI 27.580 39.749 - - - - 27.580 39.749
20. 21. 22. 23. 24. KALIMANTAN BARAT KALIMANTAN TENGAH KALIMANTAN SELATAN KALIMANTAN TIMUR KALIMANTAN UTARA - - - - - - - - - -- - - - -- - - - -- - - - - - - - - - - - - WILAYAH KALIMANTAN - - - - - - - - 25. 26. 27. 28. 29. 30. SULAWESI UTARA GORONTALO SULAWESI TENGAH SULAWESI SELATAN SULAWESI BARAT SULAWESI TENGGARA - - 55 2.506 - -- - 33 1.529 - - - - - - - - - - - - - - - - - - - - - - - - - - - 55 2.506 - -- - 33 1.529 - -WILAYAH SULAWESI 2.561 1.562 - - - - 2.561 1.562 31. 32. 33. 34. M A L U K U MALUKU UTARA PAPUA PAPUA BARAT - - - - - - - - - - - - - - - - - - - - - - - - - - - - - - - -
WILAYAH MALUKU & PAPUA - - - - - - - - I N D O N E S I A 216.142 200.138 2.513 2.050 83 133 218.738 202.322
DIREKTORAT JENDERAL PERKEBUNAN
Directorate General of Estate Crops
Keterangan/Note :
1. Angka Sementara/Preliminary*)
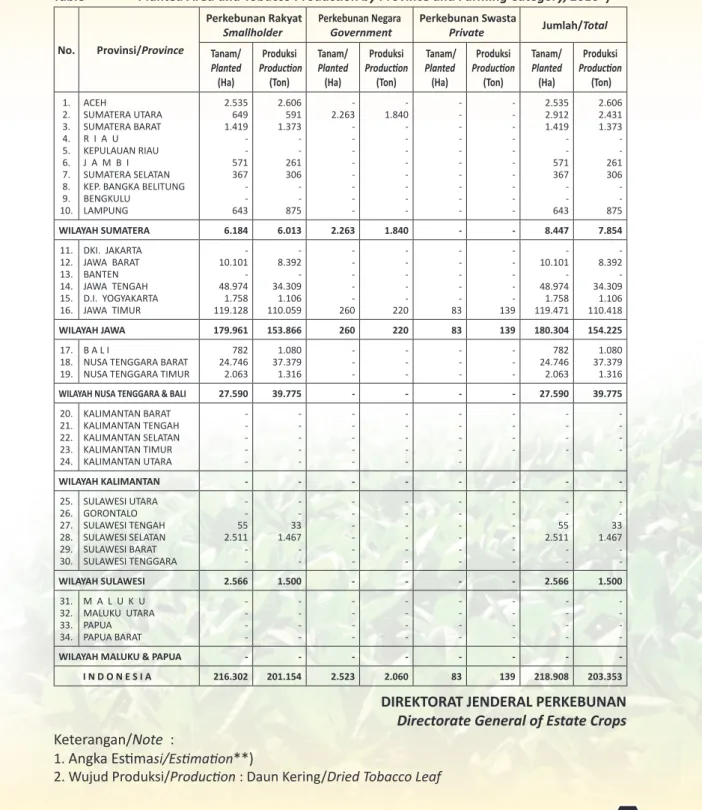
Tabel 5.
Luas Tanam dan Produksi Tembakau Menurut Provinsi dan Status Pengusahaan
Tahun 2016**)
Table
Planted Area and Tobacco Production by Province and Farming Category, 2016*)
No.
Provinsi/Province
Perkebunan Rakyat
Smallholder
Perkebunan Negara
Government
Perkebunan Swasta
Private
Jumlah/Total
Tanam/
Planted
(Ha)
Produksi
Production
(Ton)
Tanam/
Planted
(Ha)
Produksi
Production
(Ton)
Tanam/
Planted
(Ha)
Produksi
Production
(Ton)
Tanam/
Planted
(Ha)
Produksi
Production
(Ton)
1. 2. 3. 4. 5. 6. 7. 8. 9. 10. ACEH SUMATERA UTARA SUMATERA BARAT R I A U KEPULAUAN RIAU J A M B I SUMATERA SELATAN KEP. BANGKA BELITUNG BENGKULU LAMPUNG 2.535 649 1.419 - - 571 367 - - 643 2.606 591 1.373 - - 261 306 - - 875 - 2.263 - - - - - - - -- 1.840 - - - - - - - - - - - - - - - - - - - - - - - - - - - 2.535 2.912 1.419 - - 571 367 - - 643 2.606 2.431 1.373 - - 261 306 - - 875 WILAYAH SUMATERA 6.184 6.013 2.263 1.840 - - 8.447 7.854 11. 12. 13. 14. 15. 16. DKI. JAKARTA JAWA BARAT BANTEN JAWA TENGAH D.I. YOGYAKARTA JAWA TIMUR - 10.101 - 48.974 1.758 119.128 - 8.392 - 34.309 1.106 110.059 - - - - - 260 - - - - - 220 - - - - - 83 - - - - - 139 - 10.101 - 48.974 1.758 119.471 - 8.392 - 34.309 1.106 110.418 WILAYAH JAWA 179.961 153.866 260 220 83 139 180.304 154.225 17. 18. 19. B A L INUSA TENGGARA BARAT NUSA TENGGARA TIMUR
782 24.746 2.063 1.080 37.379 1.316 - - - - - - - - - - - - 782 24.746 2.063 1.080 37.379 1.316
WILAYAH NUSA TENGGARA & BALI 27.590 39.775 - - - - 27.590 39.775
20. 21. 22. 23. 24. KALIMANTAN BARAT KALIMANTAN TENGAH KALIMANTAN SELATAN KALIMANTAN TIMUR KALIMANTAN UTARA - - - - - - - - - -- - - - -- - - - -- - - - - - - - - - - - - WILAYAH KALIMANTAN - - - - - - - - 25. 26. 27. 28. 29. 30. SULAWESI UTARA GORONTALO SULAWESI TENGAH SULAWESI SELATAN SULAWESI BARAT SULAWESI TENGGARA - - 55 2.511 - - - - 33 1.467 - - - - - - - - - - - - - - - - - - - - - - - - - - - - 55 2.511 - - - - 33 1.467 - - WILAYAH SULAWESI 2.566 1.500 - - - - 2.566 1.500 31. 32. 33. 34. M A L U K U MALUKU UTARA PAPUA PAPUA BARAT - - - - - - - - - - - - - - - - - - - - - - - - - - - - - - - -
WILAYAH MALUKU & PAPUA - - - - - - - - I N D O N E S I A 216.302 201.154 2.523 2.060 83 139 218.908 203.353
DIREKTORAT JENDERAL PERKEBUNAN
Directorate General of Estate Crops
Keterangan/Note :
1. Angka Estimasi/Estimation**)
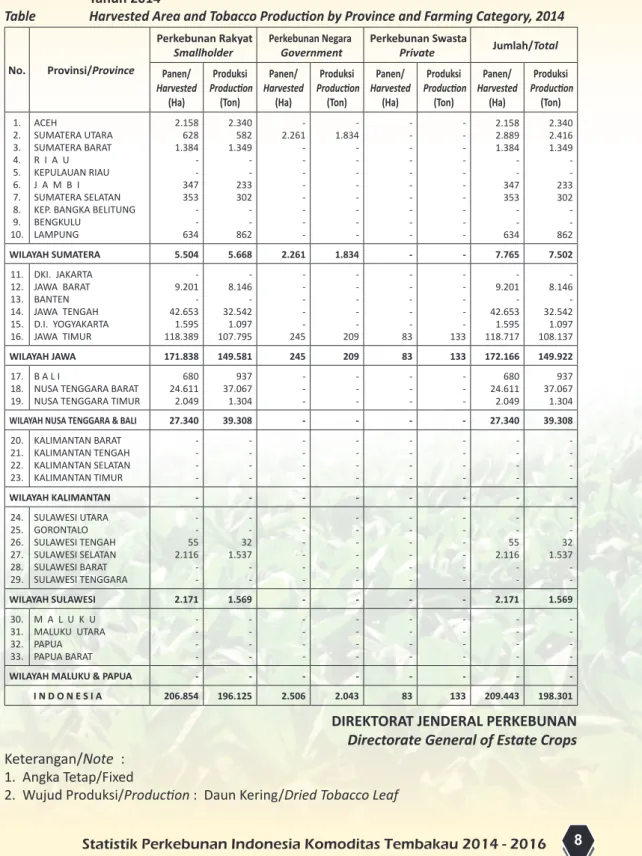
Tabel 6.
Luas Panen dan Produksi Tembakau Menurut Provinsi dan Status Pengusahaan
Tahun 2014
Table
Harvested Area and Tobacco Production by Province and Farming Category, 2014
No.
Provinsi/Province
Perkebunan Rakyat
Smallholder
Perkebunan Negara
Government
Perkebunan Swasta
Private
Jumlah/Total
Panen/
Harvested
(Ha)
Produksi
Production
(Ton)
Panen/
Harvested
(Ha)
Produksi
Production
(Ton)
Panen/
Harvested
(Ha)
Produksi
Production
(Ton)
Panen/
Harvested
(Ha)
Produksi
Production
(Ton)
1. 2. 3. 4. 5. 6. 7. 8. 9. 10. ACEH SUMATERA UTARA SUMATERA BARAT R I A U KEPULAUAN RIAU J A M B I SUMATERA SELATAN KEP. BANGKA BELITUNG BENGKULU LAMPUNG 2.158 628 1.384 - - 347 353 - - 634 2.340 582 1.349 - - 233 302 - - 862 - 2.261 - - - - - - - - - 1.834 - - - - - - - - - - - - - - - - - - - - - - - - - - - 2.158 2.889 1.384 - - 347 353 - - 634 2.340 2.416 1.349 - - 233 302 - - 862 WILAYAH SUMATERA 5.504 5.668 2.261 1.834 - - 7.765 7.502 11. 12. 13. 14. 15. 16. DKI. JAKARTA JAWA BARAT BANTEN JAWA TENGAH D.I. YOGYAKARTA JAWA TIMUR - 9.201 - 42.653 1.595 118.389 - 8.146 - 32.542 1.097 107.795 - - - - - 245 - - - - - 209 - - - - - 83 - - - - - 133 - 9.201 - 42.653 1.595 118.717 - 8.146 - 32.542 1.097 108.137 WILAYAH JAWA 171.838 149.581 245 209 83 133 172.166 149.922 17. 18. 19. B A L INUSA TENGGARA BARAT NUSA TENGGARA TIMUR
680 24.611 2.049 937 37.067 1.304 - - - - - - - - - - - - 680 24.611 2.049 937 37.067 1.304
WILAYAH NUSA TENGGARA & BALI 27.340 39.308 - - - - 27.340 39.308
20. 21. 22. 23. KALIMANTAN BARAT KALIMANTAN TENGAH KALIMANTAN SELATAN KALIMANTAN TIMUR - - - - - - - - - - - - - - - - - - - - - - - - - - - - - WILAYAH KALIMANTAN - - - - - - - - 24. 25. 26. 27. 28. 29. SULAWESI UTARA GORONTALO SULAWESI TENGAH SULAWESI SELATAN SULAWESI BARAT SULAWESI TENGGARA - - 55 2.116 - -- - 32 1.537 - - - - - - - - - - - - - - - - - - - - - - - - - - - 55 2.116 - -- - 32 1.537 - -WILAYAH SULAWESI 2.171 1.569 - - - - 2.171 1.569 30. 31. 32. 33. M A L U K U MALUKU UTARA PAPUA PAPUA BARAT - - - - - - - - - - - - - - - - - - - - - - - - - - - - - - - -
WILAYAH MALUKU & PAPUA - - - - - - - - I N D O N E S I A 206.854 196.125 2.506 2.043 83 133 209.443 198.301
DIREKTORAT JENDERAL PERKEBUNAN
Directorate General of Estate Crops
Keterangan/Note :
1. Angka Tetap/Fixed
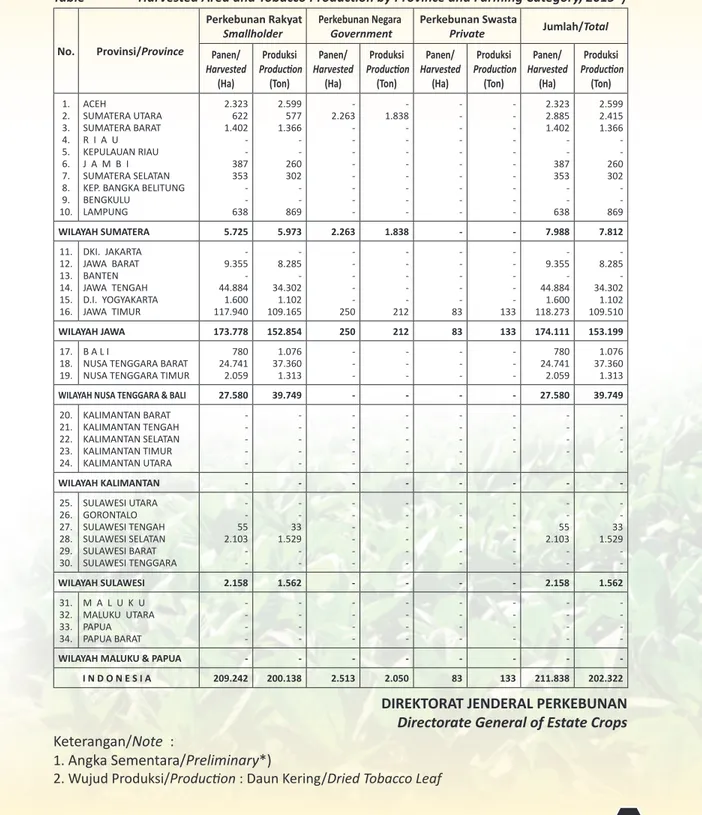
Tabel 7.
Luas Panen dan Produksi Tembakau Menurut Provinsi dan Status Pengusahaan
Tahun 2015*)
Table
Harvested Area and Tobacco Production by Province and Farming Category, 2015*)
No.
Provinsi/Province
Perkebunan Rakyat
Smallholder
Perkebunan Negara
Government
Perkebunan Swasta
Private
Jumlah/Total
Panen/
Harvested
(Ha)
Produksi
Production
(Ton)
Panen/
Harvested
(Ha)
Produksi
Production
(Ton)
Panen/
Harvested
(Ha)
Produksi
Production
(Ton)
Panen/
Harvested
(Ha)
Produksi
Production
(Ton)
1. 2. 3. 4. 5. 6. 7. 8. 9. 10. ACEH SUMATERA UTARA SUMATERA BARAT R I A U KEPULAUAN RIAU J A M B I SUMATERA SELATAN KEP. BANGKA BELITUNG BENGKULU LAMPUNG 2.323 622 1.402 - - 387 353 - - 638 2.599 577 1.366 - - 260 302 - - 869 - 2.263 - - - - - - - -- 1.838 - - - - - - - - - - - - - - - - - - - - - - - - - - - 2.323 2.885 1.402 - - 387 353 - - 638 2.599 2.415 1.366 - - 260 302 - - 869 WILAYAH SUMATERA 5.725 5.973 2.263 1.838 - - 7.988 7.812 11. 12. 13. 14. 15. 16. DKI. JAKARTA JAWA BARAT BANTEN JAWA TENGAH D.I. YOGYAKARTA JAWA TIMUR - 9.355 - 44.884 1.600 117.940 - 8.285 - 34.302 1.102 109.165 - - - - - 250 - - - - - 212 - - - - - 83 - - - - - 133 - 9.355 - 44.884 1.600 118.273 - 8.285 - 34.302 1.102 109.510 WILAYAH JAWA 173.778 152.854 250 212 83 133 174.111 153.199 17. 18. 19. B A L INUSA TENGGARA BARAT NUSA TENGGARA TIMUR
780 24.741 2.059 1.076 37.360 1.313 - - - - - - - - - - - - 780 24.741 2.059 1.076 37.360 1.313
WILAYAH NUSA TENGGARA & BALI 27.580 39.749 - - - - 27.580 39.749
20. 21. 22. 23. 24. KALIMANTAN BARAT KALIMANTAN TENGAH KALIMANTAN SELATAN KALIMANTAN TIMUR KALIMANTAN UTARA - - - - - - - - - -- - - - -- - - - -- - - - - - - - - - - - - WILAYAH KALIMANTAN - - - - - - - - 25. 26. 27. 28. 29. 30. SULAWESI UTARA GORONTALO SULAWESI TENGAH SULAWESI SELATAN SULAWESI BARAT SULAWESI TENGGARA - - 55 2.103 - -- - 33 1.529 - - - - - - - - - - - - - - - - - - - - - - - - - - - 55 2.103 - -- - 33 1.529 - -WILAYAH SULAWESI 2.158 1.562 - - - - 2.158 1.562 31. 32. 33. 34. M A L U K U MALUKU UTARA PAPUA PAPUA BARAT - - - - - - - - - - - - - - - - - - - - - - - - - - - - - - - -
WILAYAH MALUKU & PAPUA - - - - - - - - I N D O N E S I A 209.242 200.138 2.513 2.050 83 133 211.838 202.322
DIREKTORAT JENDERAL PERKEBUNAN
Directorate General of Estate Crops
Keterangan/Note :
1. Angka Sementara/Preliminary*)
Tabel 8.
Luas Panen dan Produksi Tembakau Menurut Provinsi dan Status Pengusahaan
Tahun 2016**)
Table
Harvested Area and Tobacco Production by Province and Farming Category, 2016**)
No.
Provinsi/Province
Perkebunan Rakyat
Smallholder
Perkebunan Negara
Government
Perkebunan Swasta
Private
Jumlah/Total
Panen/
Harvested
(Ha)
Produksi
Production
(Ton)
Panen/
Harvested
(Ha)
Produksi
Production
(Ton)
Panen/
Harvested
(Ha)
Produksi
Production
(Ton)
Panen/
Harvested
(Ha)
Produksi
Production
(Ton)
1. 2. 3. 4. 5. 6. 7. 8. 9. 10. ACEH SUMATERA UTARA SUMATERA BARAT R I A U KEPULAUAN RIAU J A M B I SUMATERA SELATAN KEP. BANGKA BELITUNG BENGKULU LAMPUNG 2.328 636 1.407 - - 388 357 - - 643 2.606 591 1.373 - - 261 306 - - 875 - 2.263 - - - - - - - - - 1.840 - - - - - - - - - - - - - - - - - - - - - - - - - - - 2.328 2.899 1.407 - - 388 357 - - 643 2.606 2.431 1.373 - - 261 306 - - 875 WILAYAH SUMATERA 5.759 6.013 2.263 1.840 - - 8.022 7.854 11. 12. 13. 14. 15. 16. DKI. JAKARTA JAWA BARAT BANTEN JAWA TENGAH D.I. YOGYAKARTA JAWA TIMUR - 9.460 - 44.884 1.604 118.039 - 8.392 - 34.309 1.106 110.059 - - - - - 260 - - - - - 220 - - - - - 83 - - - - - 139 - 9.460 - 44.884 1.604 118.382 - 8.392 - 34.309 1.106 110.418 WILAYAH JAWA 173.986 153.866 260 220 83 139 174.329 154.225 17. 18. 19. B A L INUSA TENGGARA BARAT NUSA TENGGARA TIMUR
782 24.746 2.063 1.080 37.379 1.316 - - - - - - - - - - - - 782 24.746 2.063 1.080 37.379 1.316
WILAYAH NUSA TENGGARA & BALI 27.590 39.775 - - - - 27.590 39.775
20. 21. 22. 23. 24. KALIMANTAN BARAT KALIMANTAN TENGAH KALIMANTAN SELATAN KALIMANTAN TIMUR KALIMANTAN UTARA - - - - - - - - - -- - - - -- - - - -- - - - - - - - - - - - - WILAYAH KALIMANTAN - - - - - - - - 25. 26. 27. 28. 29. 30. SULAWESI UTARA GORONTALO SULAWESI TENGAH SULAWESI SELATAN SULAWESI BARAT SULAWESI TENGGARA - - 55 2.018 - -- - 33 1.467 - - - - - - - - - - - - - - - - - - - - - - - - - - - 55 2.018 - -- - 33 1.467 - -WILAYAH SULAWESI 2.073 1.500 - - - - 2.073 1.500 31. 32. 33. 34. M A L U K U MALUKU UTARA PAPUA PAPUA BARAT - - - - - - - - - - - - - - - - - - - - - - - - - - - - - - - -
WILAYAH MALUKU & PAPUA - - - - - - - - I N D O N E S I A 209.408 201.154 2.523 2.060 83 139 212.014 203.353
DIREKTORAT JENDERAL PERKEBUNAN
Directorate General of Estate Crops
Keterangan/Note :
1. Angka Estimasi/Estimation**)
Tabel 9.
Luas Areal dan Produksi Tembakau Perkebunan Rakyat, Besar Negara dan Besar
Swasta (PR+PBN+PBS) Menurut Provinsi dan Keadaan Tanaman Tahun 2014
Table
Area and Tobacco Production of Smallholder, Government and Private Estate by
Province and Tree Crops Classification, 2014
No.
Provinsi/Province
Luas Areal/Area (Ha)
Produksi
Production
(Ton)
Produktivitas/
Productivity
(Kg/Ha)
Jumlah
Petani/
Farmers
(KK)
Jumlah
Penyerapan
Tenaga Kerja
(TK)
Tanam/
Planted
Harvested
Panen/
1. 2. 3. 4. 5. 6. 7. 8. 9. 10. ACEH SUMATERA UTARA SUMATERA BARAT R I A U KEPULAUAN RIAU J A M B I SUMATERA SELATAN KEP. BANGKA BELITUNG BENGKULU LAMPUNG 2.370 2.902 1.404 - - 569 355 - - 634 2.158 2.889 1.384 - - 347 353 - - 634 2.340 2.416 1.349 - - 233 302 - - 862 1.084 836 975 - - 671 856 - - 1.360 2.989 1.281 4.525 - - 392 1.024 - - 977 - 8.367 - - - - - - - - WILAYAH SUMATERA 8.234 7.765 7.502 966 11.188 8.367 11. 12. 13. 14. 15. 16. DKI. JAKARTA JAWA BARAT BANTEN JAWA TENGAH D.I. YOGYAKARTA JAWA TIMUR - 10.149 - 46.540 1.749 119.206 - 9.201 - 42.653 1.595 118.717 - 8.146 - 32.542 1.097 108.137 - 885 - 763 688 911 - 26.319 - 125.154 8.888 351.217 - - - - - 1.065 WILAYAH JAWA 177.644 172.166 149.922 871 511.578 1.065 17. 18. 19. B A L I
NUSA TENGGARA BARAT NUSA TENGGARA TIMUR
680 24.611 2.049 680 24.611 2.049 937 37.067 1.304 1.377 1.506 636 1.098 38.336 2.563 - - -
WILAYAH NUSA TENGGARA & BALI 27.340 27.340 39.308 1.438 41.997 -
20. 21. 22. 23. KALIMANTAN BARAT KALIMANTAN TENGAH KALIMANTAN SELATAN KALIMANTAN TIMUR - - - - - - - - - - - - - - - - - - - - - WILAYAH KALIMANTAN - - - - - -24. 25. 26. 27. 28. 29. SULAWESI UTARA GORONTALO SULAWESI TENGAH SULAWESI SELATAN SULAWESI BARAT SULAWESI TENGGARA - - 125 2.521 - - - - 55 2.116 - - - - 32 1.537 - - - - 582 726 - - - - 229 2.645 - - - - - - -WILAYAH SULAWESI 2.646 2.171 1.569 723 2.874 - 30. 31. 32. 33. M A L U K U MALUKU UTARA PAPUA PAPUA BARAT - - - - - - - - - - - - - - - - - - - - - - -
-WILAYAH MALUKU & PAPUA - - - - -
I N D O N E S I A 215.865 209.443 198.301 947 567.637 9.432
DIREKTORAT JENDERAL PERKEBUNAN
Directorate General of Estate Crops
Keterangan/Note :
1. Angka Tetap/Fixed
Tabel 10.
Luas Areal dan Produksi Tembakau Perkebunan Rakyat, Besar Negara dan Besar
Swasta (PR+PBN+PBS) Menurut Provinsi dan Keadaan Tanaman Tahun 2015*)
Table
Area and Tobacco Production of Smallholder, Government and Private Estate by
Province and Tree Crops Classification, 2015*)
No.
Provinsi/Province
Luas Areal/Area (Ha)
Produksi
Production
(Ton)
Produktivitas/
Productivity
(Kg/Ha)
Jumlah
Petani/
Farmers
(KK)
Jumlah
Penyerapan
Tenaga Kerja
(TK)
Tanam/
Planted
Harvested
Panen/
1. 2. 3. 4. 5. 6. 7. 8. 9. 10. ACEH SUMATERA UTARA SUMATERA BARAT R I A U KEPULAUAN RIAU J A M B I SUMATERA SELATAN KEP. BANGKA BELITUNG BENGKULU LAMPUNG 2.530 2.898 1.414 - - 569 363 - - 638 2.323 2.885 1.402 - - 387 353 - - 638 2.599 2.415 1.366 - - 260 302 - - 869 1.119 837 974 - - 673 856 - - 1.361 3.398 1.269 4.599 - - 397 1.047 - - 983 - 8.374 - - - - - - - - WILAYAH SUMATERA 8.412 7.988 7.812 978 11.693 8.374 11. 12. 13. 14. 15. 16. DKI. JAKARTA JAWA BARAT BANTEN JAWA TENGAH D.I. YOGYAKARTA JAWA TIMUR - 10.096 - 48.974 1.754 119.361 - 9.355 - 44.884 1.600 118.273 - 8.285 - 34.302 1.102 109.510 - 886 - 764 689 926 - 26.164 - 119.981 8.913 351.660 - - - - - 1.065 WILAYAH JAWA 180.185 174.111 153.199 880 506.718 1.065 17. 18. 19. B A L I
NUSA TENGGARA BARAT NUSA TENGGARA TIMUR
780 24.741 2.059 780 24.741 2.059 1.076 37.360 1.313 1.380 1.510 638 1.259 38.538 2.576 - - -
WILAYAH NUSA TENGGARA & BALI 27.580 27.580 39.749 1.441 42.373 -
20. 21. 22. 23. 24. KALIMANTAN BARAT KALIMANTAN TENGAH KALIMANTAN SELATAN KALIMANTAN TIMUR KALIMANTAN UTARA - - - - - - - - - -- - - - -- - - - -- - - - - WILAYAH KALIMANTAN - - - - - -25. 26. 27. 28. 29. 30. SULAWESI UTARA GORONTALO SULAWESI TENGAH SULAWESI SELATAN SULAWESI BARAT SULAWESI TENGGARA - - 55 2.506 - - - - 55 2.103 - - - - 33 1.529 - - - - 600 727 - - - - 115 2.230 - - - - - - -WILAYAH SULAWESI 2.561 2.158 1.562 723 2.345 - 31. 32. 33. 34. M A L U K U MALUKU UTARA PAPUA PAPUA BARAT - - - - - - - - - - - - - - - - - - - - - - -
-WILAYAH MALUKU & PAPUA - - - - -
I N D O N E S I A 218.738 211.838 202.322 955 563.130 9.439
DIREKTORAT JENDERAL PERKEBUNAN
Directorate General of Estate Crops
Keterangan/Note :
1. Angka Sementara/Preliminary*)
Tabel 11.
Luas Areal dan Produksi Tembakau Perkebunan Rakyat, Besar Negara dan Besar
Swasta (PR+PBN+PBS) Menurut Provinsi dan Keadaan Tanaman Tahun 2016**)
Table
Area and Tobacco Production of Smallholder, Government and Private Estate by
Province and Tree Crops Classification, 2016**)
No.
Provinsi/Province
Luas Areal/Area (Ha)
Produksi
Production
(Ton)
Produktivitas/
Productivity
(Kg/Ha)
Jumlah
Petani/
Farmers
(KK)
Jumlah
Penyerapan
Tenaga Kerja
(TK)
Tanam/
Planted
Harvested
Panen/
1. 2. 3. 4. 5. 6. 7. 8. 9. 10. ACEH SUMATERA UTARA SUMATERA BARAT R I A U KEPULAUAN RIAU J A M B I SUMATERA SELATAN KEP. BANGKA BELITUNG BENGKULU LAMPUNG 2.535 2.912 1.419 - - 571 367 - - 643 2.328 2.899 1.407 - - 388 357 - - 643 2.606 2.431 1.373 - - 261 306 - - 875 1.120 839 976 - - 673 858 - - 1.361 3.398 1.297 4.616 - - 399 1.059 - - 991 - 8.374 - - - - - - - - WILAYAH SUMATERA 8.447 8.022 7.854 979 11.760 8.374 11. 12. 13. 14. 15. 16. DKI. JAKARTA JAWA BARAT BANTEN JAWA TENGAH D.I. YOGYAKARTA JAWA TIMUR - 10.101 - 48.974 1.758 119.471 - 9.460 - 44.884 1.604 118.382 - 8.392 - 34.309 1.106 110.418 - 887 - 764 690 933 - 26.177 - 119.981 8.934 351.956 - - - - - 1.070 WILAYAH JAWA 180.304 174.329 154.225 885 507.048 1.070 17. 18. 19. B A L I
NUSA TENGGARA BARAT NUSA TENGGARA TIMUR
782 24.746 2.063 782 24.746 2.063 1.080 37.379 1.316 1.381 1.511 638 1.263 38.546 5.966 - - -
WILAYAH NUSA TENGGARA & BALI 27.590 27.590 39.775 1.442 45.775 -
20. 21. 22. 23. 24. KALIMANTAN BARAT KALIMANTAN TENGAH KALIMANTAN SELATAN KALIMANTAN TIMUR KALIMANTAN UTARA - - - - - - - - - -- - - - -- - - - -- - - - - WILAYAH KALIMANTAN - - - - - -25. 26. 27. 28. 29. 30. SULAWESI UTARA GORONTALO SULAWESI TENGAH SULAWESI SELATAN SULAWESI BARAT SULAWESI TENGGARA - - 55 2.511 - - - - 55 2.018 - - - - 33 1.467 - - - - 600 727 - - - - 115 2.635 - - - - - - -WILAYAH SULAWESI 2.566 2.073 1.500 724 2.750 - 31. 32. 33. 34. M A L U K U MALUKU UTARA PAPUA PAPUA BARAT - - - - - - - - - - - - - - - - - - - - - - -
-WILAYAH MALUKU & PAPUA - - - - -
I N D O N E S I A 218.908 212.014 203.353 959 567.332 9.444
DIREKTORAT JENDERAL PERKEBUNAN
Directorate General of Estate Crops
Keterangan/Note :
1. Angka Estimasi/Estimation**)
Tabel 12.
Luas Areal dan Produksi Tembakau Perkebunan Rakyat Menurut Provinsi dan
Keadaan Tanaman Tahun 2014
Table
Area and Tobacco Production of Smallholder by Province and Tree Crops
Classification, 2014
No.
Provinsi/Province
Luas Areal/Area (Ha)
Produksi
Production
(Ton)
Produktivitas/
Productivity
(Kg/Ha)
Jumlah
Petani/
Farmers
(KK)
Tanam/
Planted
Harvested
Panen/
1. 2. 3. 4. 5. 6. 7. 8. 9. 10. ACEH SUMATERA UTARA SUMATERA BARAT R I A U KEPULAUAN RIAU J A M B I SUMATERA SELATAN KEP. BANGKA BELITUNG BENGKULU LAMPUNG 2.370 641 1.404 - - 569 355 - - 634 2.158 628 1.384 - - 347 353 - - 634 2.340 582 1.349 - - 233 302 - - 862 1.084 927 975 - - 671 856 - - 1.360 2.989 1.281 4.525 - - 392 1.024 - - 977 WILAYAH SUMATERA 5.973 5.504 5.668 1.030 11.188 11. 12. 13. 14. 15. 16. DKI. JAKARTA JAWA BARAT BANTEN JAWA TENGAH D.I. YOGYAKARTA JAWA TIMUR - 10.149 - 46.540 1.749 118.878 - 9.201 - 42.653 1.595 118.389 - 8.146 - 32.542 1.097 107.795 - 885 - 763 688 911 - 26.319 - 125.154 8.888 351.217 WILAYAH JAWA 177.316 171.838 149.581 870 511.578 17. 18. 19. B A L I
NUSA TENGGARA BARAT NUSA TENGGARA TIMUR
680 24.611 2.049 680 24.611 2.049 937 37.067 1.304 1.377 1.506 636 1.098 38.336 2.563
WILAYAH NUSA TENGGARA & BALI 27.340 27.340 39.308 1.438 41.997
20. 21. 22. 23. KALIMANTAN BARAT KALIMANTAN TENGAH KALIMANTAN SELATAN KALIMANTAN TIMUR - - - - - - - - - - - - - - - - - - WILAYAH KALIMANTAN - - - - - 24. 25. 26. 27. 28. 29. SULAWESI UTARA GORONTALO SULAWESI TENGAH SULAWESI SELATAN SULAWESI BARAT SULAWESI TENGGARA - - 125 2.521 - - - - 55 2.116 - - - - 32 1.537 - - - - 582 726 - - - - 229 2.645 - - WILAYAH SULAWESI 2.646 2.171 1.569 723 2.874 30. 31. 32. 33. M A L U K U MALUKU UTARA PAPUA PAPUA BARAT - - - - - - - - - - - - - - - - - - - -
WILAYAH MALUKU & PAPUA - - - - - I N D O N E S I A 213.276 206.854 196.125 948 567.637