CHAPTER III
RESEARCH METHODOLOGY
This chapter describes research methodology used in the study that is relevant to pursue the
aim of the study. First, it describes the research design used in the study. Second, it describes
the participants involved in the study. Third, it describes the data collection including the
instruments used to collect the data and the procedure of collecting the data. Last, it describes
how the data were analysed in the study. All of the descriptions are followed by the
justification of why the study chooses a particular participants, instruments, and method to
collect and analyse the data.
3.1 Research Design
The study applied a quantitative approach as the main methodology. According to Creswell
(2008), a quantitative approach is a way to describe a relationship among variables. The
variables investigated in the study must be clear and can be measured so that the statistical
procedures can be adapted. Basically, analysis of pauses can be conducted in both
quantitatively and qualitatively. However, the consideration for using quantitative, qualitative
or mix-method is determined by the aim of the study. In this study, the goal is to describe the
distribution of mid-pause in different narrative structure and different English proficiency.
From the goal of the study, it can be noticed that there are two controlled variables which are
narrative structure and English proficiency, and one dependent variable which is the
distribution of mid-pause. The variables were then investigated to see to what extent the
independent variables affect the dependent variable. It stands for the reason of using a
quantitative approach rather than other approaches. Moreover, previous study by Tavakoli &
Foster (2011) also uses a quantitative approach to analyse the variables.
3.2 Participants
The study used one sample group consisting of 40 students in the English Education
Department at Indonesia University of Education. The number of 40 participants is chosen
because the more participants involved in the study, the better the result will be. The 40
students consisted of 16 males and 24 females, ranging between 19 and 23 years old (in June,
2016). Students from English Education Department were chosen because they were the most
the score. Gender variable was not taken into account because it was out of the scope of the
study. Age variable was also discarded because the study did not aim to see the development
of L2 learners, but rather to investigate one specific level of speech production, which was
adult speech production.
The participants were selected based on their PTESOL score, above 525. PTESOL is
the abbreviation of The Proficiency Test of English for Speaker of Other Languages. The
study used PTESOL score because it was the most available method provided by the
university. Moreover, PTESOL score was assumed to reflect English proficiency of learners.
The minimum score of 525 was chosen following the department policy. English students
have to reach score of minimum 525 in order to graduate. It was based on the assumption that
by scoring 525 in the test, the students have mastered the skills that were taught during the
college. After that, they were divided into two groups based on their PTESOL score. The
participants with score between 525 to 542 were in Intermediate group as indicated by
Cambridge Institute. Meanwhile the participants with score between 543 to 626 were in
Higher Intermediate group as indicated by Cambridge Institute.
3.3 Data collection
The data collection is described in two separate sections. The first section explains the
instruments used on the study including four picture stories, recording software on Samsung
Galaxy A8, PRAAT software and SPSS software. The second section explains the procedure
of collecting the data.
3.3.1 Instruments
The speeches produced by the participants were elicited using a narrating picture task. A
narrating picture task has been widely used in L2 research because it is a valid pedagogic task
for educational setting such as teaching, learning, and assessment purposes (Tavakoli, 2011).
Moreover, it is a monologic task which allows the speakers to produce speech of stream
without interruption from the others.
The picture stories that were used in the study were taken from Tavakoli & Foster
(2011). The instruments have been used to analyse the output of 40 L1 speakers of English
and 100 L2 learners based in London; 40 L2 learners are from various L1 backgrounds based
in London, while 60 L2 learners are from a specific L1 background based in Teheran.
groups performance in narrating tasks. It indicates that the instruments have no effect towards
specific L1 background and various L1 backgrounds.
The picture stories consist of four different stories which are Picnic and Football
(Heaton, 1966), Journey (Jones, 1980) and Walkman (Swan & Walter, 1990). Each story
comprises of six pictures and has different characteristics related to its structure and
complexity. The structure refers to tight structure and loose structure, while the complexity
refers to the absence of background information in the story. However, the focus of the study
is towards narrative structure.
Table 3.1 The characteristic of instruments
The Journey has loose structure and only foregrounded events in the story. Loose
structure refers to the sequence of event that is not really clear and somehow arbitrary
(Tavakoli, 2009). However, the absence of background event in the story asks less
explanation and thus the speakers can just describe the main event of one picture and move
on to the next (Bardovi-Harlig, 1992). Speakers that perform Journey elicit a relatively low
accuracy and low syntactic complexity (Tavakoli & Foster, 2011). On the other hand, the
structure of Walkman is similar to Journey but it has background information in each picture
in the story. It stimulates the speakers to produce more subordinate conjunction in order to
connect the background information to the foreground information (Harris & Bates, 2002).
Thus, speakers that perform Walkman elicit a relatively low accuracy but high syntactic
complexity and fluency (Tavakoli & Foster, 2011).
The two other picture stories, Picnic and Football, both have a tight structure. Tight
structure refers to the fixed sequence of events that is clear from the beginning to the end and
thus speakers shift their attention into accuracy and fluency (Tavakoli, 2009). The difference
between the two stories is in the absence of background; where Picnic is presenting both
foreground and background information and Football is only presenting foreground
information. As explained above, the presence of background information stimulates the
speakers to produce more subordinate conjunction to connect it to the foreground event. Narrative Complexity Narrative Structure
Loose Tight
Foreground information Journey Football
Foreground and Background
Information
Thus, speakers that perform Picnic elicit a relatively higher accuracy and syntactic
complexity; meanwhile speakers that perform Football elicit a relatively higher accuracy but
low syntactic complexity (Tavakoli & Foster, 2011).
The performance of L2 learners in narrating tasks was recorded by recording software
in Samsung Galaxy A8. It creates a clear recording sound with mp4 format. The sound file
was then transcribed using PRAAT software. In order to be analysed by PRAAT software,
the sound file should be converted into wav format. PRAAT is a computer software
developed by Paul Boersma and David Weening from the Institute of Phonetic Sciences,
University of Amsterdam. PRAAT has many features such as speech analysis, speech
synthesis, labelling and segmentation, and speech manipulation. It shows the spectrogram,
spectral slices, pitch, formant, and intensity of the sound. The study used annotation program
of PRAAT to transcribe the speech produced by the participants. The annotation program
identifies the silence of the speech automatically and made the transcription processes easier.
The data were then analysed by using SPSS software. SPSS is the abbreviation for
Statistical Package for the Social Science. It is a computer program developed by IBM
Corporation. SPSS has many features including data transformations, data examination,
descriptive statistics, contingency tables, reliability tests, correlation, t-test, ANOVA,
MANOVA, general linear model, regression, and many other tests provided. From various
features above, the study used descriptive statistics and t-test features.
3.3.2 Procedure
The data were collected in the following procedures. First, the participants were asked for
their willingness to be involved in the study. Then, the researcher made a selection based on
the participants PTSOL score. Fortunately, during the process of data collection, all the
participants that were willing to be involved in the study already had a minimum 525 of
PTSOL score. For the purpose of the study, the participants were not given the focus of the
study (mid-pause) and thus they were not aware of the pause they made during the
performance. Then, the participants were asked to have a look at the four picture stories and
decided when they would like to do the performance. Most of them agreed to do it right when
they were given the instrument. Then, the researcher asked the participants to plan and record
their speech in the Self Access, class room, or other quiet place to reduce background noise.
After that, the participants were asked to select any picture story that they would like to
they were going to say about each picture. They were allowed to discuss the picture with the
researcher and to consult a dictionary. However, they were not allowed to write what they
were going to say. They were also told that the tasks were not used to evaluate their English
proficiency and the transcript of their narrations would be simply described with no
judgement of good or bad narration. The participants also had no time limit when narrating
the story. Most of them narrated the story for 1 minute to 4 minute. Their performances were
recorded by the researcher using the recorder software on Samsung Galaxy A8. After that,
they were asked the similar thing for other three picture stories. Each participant had about a
half hour appointment with the researcher during the data collections. The data were collected
from 9 June 2016 to 20 July 2016.
There were 160 sound files taken from 40 participants. The sound files were then
converted into wav file and analysed in the PRAAT software. First, the silence above 250 ms
(De Jong & Bosker, 2013) was identified automatically by PRAAT. Then, the speech was
segmented into clause, following Foster et al (2000). After that, the pause occurred in the
middle of clauses were counted. Then, the number of pauses occurring in each speaker was
divided into the duration of their speech (De Jong, 2013). After that, the data were divided
into Intermediate and Higher Intermediate group based on participants’ PTESOL score. Last,
the data of mid-pause in three groups were presented in the Microsoft Excel in order to be
inputted to SPSS program.
3.4 Data Analysis
The data analysis is described in two separate sections. The first section explains the
transcription processes of all four tasks, including the segmentation of speech into clauses.
Meanwhile, the second section explains the analysis of mid-pause. In this study, there are two
parts of data analysis which are descriptive analysis (the general tendencies and the spread of
scores) and inferential statistics (paired and independent t-test). The detailed explanation is
presented below.
3.4.1 Transcription
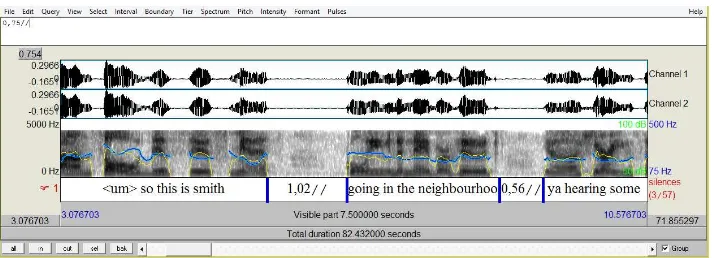
In the transcription process, the researcher used PRAAT annotation program. The software
enabled us to automatically identify the silence and the sounding. The silences identified
Figure 3.1 PRAAT transcription
There are several ways to segment speech data into unit of analysis that can be measured quantitatively. Analysis of young children’s and aphasics’s first language data was assessed in two ways. First, there are the Mean Length of Utterance (Brown, 1973) and the
Mean number of Sentences per Turn of LARSP procedure (Crystal et al, 1976) to investigate speaker’s productivity. Then, there are LARSP structural analysis, the Index of Productive Syntax (Scarborough, 1989) and the Type-Token ration (Wagner, 1985) to investigate speaker’s complexity. Unfortunately, those measurements are difficult to be applied to L2 speaker’s performance (Foster et al, 2000). Then, the focus shifts into planning process, which is the unit or chunk of spoken language within lengthy turns (ibid.). This involves
macro-planning and micro-planning process (Butterworth, 1980; Garman, 1990).
Macro-planning refers to the long stretches of speech while micro-Macro-planning refers to the shorter units
such as clause or sentence. Proficient speakers have the ability to deliver complex message in
shorter time span by dealing with more complex micro-units. Speakers with this ability are
considered to be aware of syntactic requirements and constraints of speech constructions.
This makes micro-planning as a base for measuring fluency, accuracy, and complexity on speakers’ performances.
The micro-planning of L2 learners is identified using several approaches related to
semantic units, intonational units, and syntactic units. However, the identification of
micro-planning through semantic and intonational units alone is problematic. Semantic units lack
reliability because the extent of an idea is never easy for the analyst to work with (Foster et
al, 2000). Meanwhile, intonational units cannot be used for segmenting L2 speech and reveal
not much about planning abilities and proficiency. Unlike that of previous units, syntactic
units are a strong indicator of planning since pauses mostly occur at syntactic boundary.
Identification of syntactic units assisted by semantic and intonational units is a perfect
Foster et al (2000) proposed several types of clause in segmenting oral speech data.
The first is an independent clause which consists of a clause including a finite verb. In the
case of a coordinated verb, even when the subject is omitted in the second verb phrase, it is
still considered as a new clause because it shows a fresh start for the speakers. The second is
an independent sub-clausal unit, which consists of one or more phrases elaborated to a full
clause (elliptical sentence) or a minor utterance (e.g. thank you, yes). This type of clause is
usually occurred in interactional speech. The third is a subordinate clause which consists of a
finite or non-finite verb and at least one other clause element such as subject, object,
complement, or adverbial. Since the study used a monologic speech, only the first and the
third types were identified in the transcripts.
In the transcript, clause boundaries were presented by double slash (//) while any
pause occurred between clause boundaries were presented by a hashtag (#). It also included
pause between words repeated and false start (Goldman-Eisler, 1968). In contrast, pauses that
occurred at the beginning and the end of parenthetical remarks were excluded (Xhafaj, 2006).
Pauses in the utterances were presented by duration of millisecond while filled pauses were
presented by <aa>, <um>, and <eh>. Words that were partially uttered were presented by
hyphen, for example, bas- for basket and the sce- for the scenery. Words that were
unintelligible were represented by question mark in parentheses (?). Then other interruptions
found in the data were presented by parentheses, for example, (clear throat) and (laugh).
Repetition, reformulation, lengthening, and false start were excluded from the data.
3.4.2 Analysis of mid-pause
There were several steps taken in analysing the data. Firstly, a descriptive analysis was
conducted (Creswell, 2014). Descriptive analysis was conducted to describe the trends of the
data, including general tendencies (mean, mode, median), the spread of scores (variance,
standard deviation, and range), and a relation of one score towards all others (z scores,
percentile rank). All groups, including All Participants, Intermediate, and Higher
Intermediate were described separately. However, the data has to be distributed normally to
be analysed further by inferential statistics. In order to see the normality of the data
distribution, Kolmogorov-Smirnov test was conducted.
Secondly, an inferential statistics was conducted (Creswell, 2014). Inferential
statistics was conducted to see the probability of the influence of narrative structure towards
& Moursund, 1999). In all groups, including All Participants, Intermediate group, and Higher
Intermediate group, the mid-pause produced in narrative with loose structure was compared
to narrative with tight structure. The mean comparisons were done separately. In this section,
Picnic task and Football task (tight) were compared to Walkman task and Journey task
(loose). Since the background variable was present in Picnic and Walkman, the investigation
then separated according to the presence and the absence of the background variable. In a
more detailed, Picnic was compared to Walkman because the presence of background
information in both stories, while Football was compared to Journey because the absence of
background information in both stories. The investigation of L2 speech performance in
different narrative structure was presented in the tables.
Narrative Complexity Task Narrative structure t p
Foreground and
Background
Picnic Tight
Walkman Loose
Foreground Football Tight
Journey Loose
Table 3.2 All Participants (n=40)
Table 3.3 Intermediate group (<542) (n=23)
Table 3.4 Higher Intermediate group (>542) (n=17)
Narrative Mean SD t p
(+) Background Picnic (tight)
Walkman (loose)
(-) Background Football (tight)
Journey (loose)
Narrative Mean SD t p
(+) Background Picnic (tight)
Walkman (Loose)
(-) Background Football (tight)
The comparison of the performance of L2 learners with different level of English
proficiency was also conducted. To compare the mean score between Intermediate and
Higher Intermediate group, independent t-test was conducted (Kranzler & Moursund, 1999).
The comparison was aimed to see how significant their differences in the performance of all
tasks.
Intermediate Higher Intermediate p
Picnic
Walkman
Football
Journey
Table 3.5 Mean comparison of the two groups
After the data was measured statistically, the findings were explained and interpreted
in the next chapter. The interpretation of the findings was based on cognitive perspective as