Volume 25, Number 3, 2010, 338 – 352
OWNERSHIP TYPE AND COMPANY PERFORMANCE:
EMPIRICAL STUDIES IN THE INDONESIAN
STOCK EXCHANGE
Fransiska Soejono
STIE MUSI Palembang ([email protected])
ABSTRACT
This study is aimed to test the difference in performance among companies with various types of ownership (foreign, state, and private) on a sample of 206 companies listed in ISE (Indonesian Stock Exchange) between 1999-2006 resulting in 795 company-year observations. The ANCOVA model and multiple comparison methods are used to test the hypothesis that private-owned companies have better performance than state-owned enterprises and foreign-owned companies have better performance than private-owned companies. Contrary with the hypothesis, the result shows that state-owned enterprises have better performance than private-owned companies. The possible explanation for this is because state-owned enterprises have more experience than private-owned companies (based on LogAge). State-owned firms may get some special facilities (including the easiness to get debt funding) from government. The result also shows that foreign-owned companies have better performance than private-owned companies which support the hypothesis. Foreign-owned companies have more experience in managing enterprises than private-owned companies. Furthermore, foreign-owned companies in some industries tend to be more active in doing investment than private-owned companies. There are some implications of these results. First, different ownership type gives different effect to the
company’s performance. Second, government can consider foreign ownership in its privatization policy.
Keywords: Ownership type, Performance, Experience, Investment.
INTRODUCTION
Studies concerning ownership structure and its influence towards company perfor-mance remains to draw broad interests, consi-dering that some opinions suggest that company performance are dependent upon who owns the company (Hadad et al., 2003). Company ownership structures that are concentrated whether concentrated towards the government, private, or foreign parties allows the different influences towards com-pany performance. The different types of
Indonesian Banking. Ngoc & Ramstetter (2004) compared foreign multinational corpo-ration (MNC) economic performance with local (government and non-government) com-panies in Vietnam. Earlier studies concerning ownership type towards company perfor-mance in Indonesia remain limited.
Policies of State Owned Enterprise (SOE) privatization are frequently used as a strategy to improve SOE performance. Following the governments actualization of privatization of 3 from 14 SOE’s in 2007, the government planned a privatization target of 28 SOEs in 2008 (Meitisari, 2007). Almost all the pro-grams of privatization that have been performed, reserves a right for majority con-trol from the government. Government ownership remains above 51%, in exception of Indosat that had released more than 85% of government ownership. The government’s return to SOE privatization policies in 2008 indicates the poor performance of SOEs. According to Shleifer & Vishny (1997), privatization emphasizes on profit making and efficiency. Studies by Boubakri & Cosset (1998), D’Souza & Megginson (1999), Boubakri et al. (2005b), and Loc, Lanjouw & Lensink (2004) in Irwanto (2006) demonstrate that company performance had improved following privatization. Matters of corporate governance are frequently used to explain the poor performance of government companies including the separation of the public (ownership or tax payers) and the bureaucrats (Boubakri et al., 2005a). The bureaucrats, particularly for government companies, place primary focus on pursuing political goals that are frequently contrary to the goals of maximizing profit (Shleifer & Vishny, 1997). The current study does not focus on the privatization that presumes this moment in Indonesia. However, places larger focus on testing government ownership that has, to the present, been judged to perform poorly.
Although some SOEs have displayed fine performance, specifically those which have
gone public, however this does not imply that their performance surpasses the performance of private or foreign companies. Studies from Shleifer & Vishny (1997) provide empirical evidence that SOE’s are inefficient compared to private companies. Frydman et al. (1997) discovered that private ownership dramati-cally improves performance and company revenue of Czech Republic, Hungarian & Polish companies. Nasution (2007a & 2007b) stated that the experience in several countries demonstrate that private ownership is the best choice. Government companies are not controlled by the public and are rather controlled by bureaucrats that prioritize their political interests over the welfare of the people (Marciano, 2008).
to cover National Budget deficits compared to private investors. Based on the study of Husnan (2001), multinational corporations have better monitoring and control towards management and are more transparent com-pared to non-multinational corporations, therefore management will able to accommo-date the actual interests of company owners. The study of Ngoc & Ramstetter (2004) demonstrates that multinational corporate performance is better compared to private and government owned companies because they posses capital, work productively, have higher wage levels and larger scale trade. Marciano (2008), in his study, stated that foreign banks acquire modern information and technology and advanced human capital; serve customers with efficient costs; exhibit quality in price and product variety; acquires the abilities to measure and manage risk as well as to perform sufficient monitoring; better effi-ciency and finally the performance of foreign companies are better compared to domestic owned banks.
The domination of government ownership over SOEs that go public and the plans of privatization as a policy taken by the Indone-sian government becomes one of the reasons this study is conducted. Because of the differences of company ownership type, whether from the government, private, foreign, the current study becomes extremely important to observe whether different performances are evident for companies that are owned by different shareholders.
THEORETICAL BASES AND HYPOTHESES
Agency Theory
Agency relations refer to a contract, in this case, one party, the principal, who hires another party, the agent, to execute the company’s management on behalf of the principal. The separation of ownership and control causes the different interests between the shareholders (principal) and the
manage-ment (agent). Shareholders have the primary objective to maximize the company’s value to continue increasing its wealth. The separation of ownership functions and control possibly allows management to act opportunistically and sacrificing the interests of shareholders. Such actions may occur since management holds the function of decision making and controls information.
Jensen & Meckling (1976) demonstrated that managers have the tendency to act with perquisites and opportunistic actions, for example, the forms of executive luxurious benefits which are covered by company revenues. Such events lead to agency problems. Agency problems are caused by asymmetric information between the owner and the manager, when one of the parties holds access to information, while the other does not. Moral hazard may also occur as a result of the agency problems triggered by two issues, namely, different goals or interests between the principal and the agent, and because the activities performed by the agent are difficult to identify and diversify by the principal. Moral hazard hampers overall pany operation efficiency. Government com-panies have large tendencies to experience perquisites and moral hazard compared to non government ownership (Marciano, 2008).
1997). The mechanism of corporate gover-nance cannot be separated from the efforts to minimize agency conflicts between the principal and the agent.
Ownership Structure
Listed companies in Indonesia have an ownership composition structure that is rather different compared to those of Europe or United States. In the European and American capital markets, separation of ownership and monitoring has already been conducted by an independent body which holds large power. The ownership structure is distributed (dis-persed ownership) therefore allowing agency conflicts between the manager and the shareholders (owners). Such issues are most apparent among American companies that are listed in the NYSE (Husnan, 2001). In contrast to Indonesia, most of the listed companies have shareholders in the form of business institutions for example Limited Company that sometimes becomes a repre-sentation of the company’s founder. The characteristics of Indonesian ownership struc-ture are much more concentrated (closely held) therefore the founder can also play the role as the direction board or commissioner. It is not surprising that lots of families that have large shares, assume key positions in the company. It could also be said, that in general, Indonesian companies are owner-controlled firms where the conflict that occurs, is not of the manager and the shareholder but between majority shareholders (controlling share-holders) and minority shareholders. Such characteristics are largely evident in listed companies in the Indonesian Stock Exchange and in Korea (Husnan, 2001).
The ownership structure reflects the decisions that are made by shareholders in the present as well as potential parties intending to become shareholders. Within concentrated ownership, the majority shareholder has the incentive to control and monitor the opera-tions of the company. The costs to perform
monitoring are smaller compared to the benefits that are gained in form of the im-proved performance/company value because the company has been managed well. Major shareholders also have the power to pressure management to improve the company’s performance. This is distinguished to dis-persed ownership, where the problem of a “free rider” is present. Within dispersed ownership, the costs for monitoring is larger compared to the benefits gained. The smaller residual claims cause shareholders of the dispersed ownership to be reluctant in performing monitoring actions. This leads to the collapse of the monitoring mechanism and therefore the problem of the free rider emerges.
also explained that concentrated ownership is an effective internal mechanism of corporate governance.
Types of Ownership
Based on the literature review made by Dharwadkar et al. (2000), six basic types of ownership exist which operate independently or occur in combination, namely: foreign investment (multinational corporations), local institution investors (banks), local individual investors (society members or citizens), managers (top management), workers (non top management employees), and the state/ government. The six types are categorized as either outsiders or insiders. Outsiders consist of foreign players, local institutional investors and or local individual investors, while insiders refer to managers, workers and or the state.
Hanousek et al. (2007) did not only place emphasis on broad ownership categories but also judged whether the different ownership types reflect ownership business activities that results in greater understanding towards own-ership influence towards performance. Several types of ownership, either domestic or foreign, have different implications towards the company goals, constraint and gover-nance. According to Hanousek et al. (2007), six domestic ownership types exist, while two foreign ownership types exist. The six types of domestic ownership include the state, industrial companies (non-financial), banks, investment funds, individual firms and portfo-lio. While the two types of foreign ownership include industrial companies (non financial) and all other forms of foreign ownership. Hanousek et al. (2007) also extended the ownership category type to three ownership groups, namely domestic, foreign and govern-ment. The category types used in the study is based on Hanousek et al. (2007) and Berger et al. (2005) namely ownership by the govern-ment, domestic and foreign.
Ownership and Performance
Joh (2003) discovered that companies with low ownership concentration experience low profitability, by controlling company and industrial characteristics. Empirical evidences in developed countries demonstrate that although low concentrated ownership applies, however increased market value of the company may still be effectively achieved (Barclay & Holderness, 1991; Holderness & Sheehan, 1988; Mikkelson & Rubback, 1991). Therefore, although indicating low concen-trated ownership, the company continues to be effective in the context of strong governance. In fact, according to Dharwadkar (2000), ownership concentration may operate effec-tively only in the presence of dominant owners (larger than 50%), with regard to voting mechanisms. This is because, first, when the number of shareholders increase, collective actions becomes increasingly ex-pensive due to the higher costs of coordination (McDonald, 1993); second, the low avai-lability of information, norms are not exposed, due to the absence of a medium to access information which creates difficulties in monitoring minority shareholders (Khanna & Palepu, 1999).
ownership type and ownership concentration towards performance remains limited compared to previous studies. The argument that is proposed is that in the first 4 years following privatization (1996-1999), the influence of performance from several ownership types is limited and the private ownership type does not produce a different influence with majority ownership or the Single Largest Owner (SLO), referring to the government. The study of Hanousek et al. (2007) also demonstrated the positive influence of foreign ownership detected by foreign majority ownership and foreign industrial companies. Husnan (2001) studied comparisons of company performance with shareholders that control multinational corpo-rations and non multinational corpocorpo-rations. The results of the study indicated a difference in corporate governance (which is a proxy of financial decisions) and company perfor-mance. Non multinational corporations per-form funding without much attention drawn towards the principles of good governance principles.
Research Hypotheses
Hanousek et al. (2007) argued that the three ownership categories, namely govern-ment owned, private owned, and foreign owned are believed to result in different influences towards performance. Ngoc & Ramstetter (2004) discovered differences of performance between multinational corpo-rations and non multinational corpocorpo-rations (government and non-government). Differ-ences in the performance may be caused by the difference of corporate governance, cost efficiency, experience, work culture, and etc. Based on the elaborations above, the follow-ing hypothesis is made:
H1: There are differences of performance between government, private and foreign ownership types.
than 2000 SOEs and private Russian compa-nies. Experience in several countries demon-strate that private ownership frequently shows to operate more efficiently compared to state companies and, are also the best choices (Sitompul, 2004; and Nasution, 2007a & 2007b). Based on the elaborations above, therefore the type of ownership based on government or private ownership towards performance will bet tested in Indonesian companies. Based of the elaboration the following hypothesis is made:
H2a: Company performance with the private ownership (domestic) type is better compared to the company performance of the government ownership type.
Bonin, et. al. (2005a & 2005b) demonstrated that bank ownership by foreign parties is most efficient. Purwoko (2002), in his article concluded that SOE privatization using private placement by foreign investors with investments above 50% will provide the most optimal benefits. Fries & Taci (2005) demonstrated that bank privatization by foreign ownership as its majority is the most efficient. Companies with foreign ownership are more capable of performing monitoring and control towards management and are more transparent compared to private owned companies therefore it is expected that the actions of management will be in line with the interests of the company shareholders. A study by Husnan (2001) provides evidence that multinational corporations display better monitoring and control towards management and are more transparent compared to non-multinational corporations. This implies that dominant foreign ownership gives better performance compared to private owned companies. A study from Ngoc & Ramstetter (2004) revealed that in general, foreign companies (foreign MNCs) have higher worker productivity, capital intensity, wage levels, investment tendencies, and trade compared to non-MNCs. Based on the
elaborations above, the following hypothesis is made:
H2b: Company performance with the foreign ownership type is better compared to private owned companies (domestic).
RESEARCH METHODS
Research Data
The population of the study comprise of all companies enlisted in the Indonesian Stock Exchange from 1999 to 2006. The sample is taken by means of purposive sampling with the judgment sampling type and using the following criteria: Companies are enlisted in the Jakarta Stock Exchange (presently referred to as Indonesian Stock Exchange), companies have data of shares ownership above 50%, the company status is clearly established, namely Foreign Investment, Domestic Investment, and State Owned Enterprise, Non Multina-tional Corporations. The type of data used in the study is secondary data originating from ICMD (Indonesian Capital Market Directory) and the company annual report from 1999-2006 obtained from ISE. The final observation includes 795 observations comprising of 206 companies.
Definition and Variable Measurement
Price/Book Value ratio refers to the equity market value towards the equity book value, namely the measurement of shareholder equity stated in the balance. Equity market value comprises of potential future growth, therefore the PBV ratio is expected to be higher for companies with higher opportuni-ties of growth (Ramezani, et. al., 2002). The following presents the formula for the calculation PBV: PBV = Market Value of Equity/Book Value of Equity.
PER refers to the indicator which is widely used to observe potential investment of a company, calculated from the comparison of market price per sheet with net income per sheet of shares. The formula for Price Earning Ratio (PER) is as follows: PER = Market Value per share/Net Income per share. The independent variables that are used namely type of ownership, company size, years, and industry. The study differentiates 3 groups of ownership, namely government ownership, private ownership, and foreign ownership based on the study of Hanousek, et. al. (2007) and Berger, et. al. (2005). The study extremely determines the majority of shares with a proportion above 50%. According to Dharwadkar (2000) ownership concentration can operate effectively only in the case of dominant owners (larger than 50%), with regard to voting mechanisms.
The larger the size (assets) of the company, the larger the opportunity for the company to achieve expected performance levels. Therefore, the better the company is in managing its assets, the better the company’s performance. Proxy measures of the company used by Demsetz & Villalonga (2001), Ramezani, et. al. (2002), and Welch (2003) include logarithm values from total asset. Logarithm values from total asset are used so that the total assets, as a proxy for the company’s size, appear smooth.
Based on the study of Ramezani, et. al. (2002), change of the dummy years
demon-strate the adjustment of values all year long, therefore it enables the identification of different patterns of reduction/increase of performance from year to year. Based on the arguments of Ghozali (2006), the influence of time can be inserted with the assumption that performance functions shift over time due to factors of technology advancement, govern-ment regulations, tax policies, and external influence for example war or other conflicts.
Demsetz (1983) explained that company performance is determined by environmental constraints. Ownership concentration depends on the level of certainty in the company environment. The current study does not merely test the influences of various company ownership types towards performance but also brings into consideration the type of industry as a controlling variable. Company perform-ance is influenced by the level of competition of each industry which is different for each different type of industry (Hanousek, et. al., 2007). Ownership and the utilization of resources which is different among different industries cause differences in performance. According to Demsetz & Lehn (1985) the dummy variable industry is used to control the possibilities of spurious correlation between ownership structures with performance due to the industry effect. The industry variable is used to accommodate the presence of different competition levels between industries as well as the distinct characteristics of each industry.
Data Analysis Method :
Hypothesis tests are performed using the Ancova (Analysis of Covariance) model. The equation model used in the study is as follows:
Performance = + Type Own + Firm Size + Year + Industry + ε
Description:
= regression intercept, that measures the mean from ROE or PER or PBV for all independent variables that are used.
Type Own = type of ownership, using the category P = government, implying ma-jority ownership by the government; S = Private, implying majority ownership by private parties; and A = Foreign, implying majority ownership by foreign parties.
Firm Size = the control variable for company size, that is a proxy for the logarithm of company assets.
Year = years, refer to the control variable for the years that demonstrate influence of years towards performance, using the category 1 = 1999, 2 = 2000, 3 = 2001, 4 = 2002, 5 = 2003, 6 = 2004, 7 = 2005, and 8 = 2006.
Industry = industry, serves as the control variable for industries that have an influ-ence towards company performance, using the category 1=Agriculture, For-estry, & Fishing; 2=Animal Feed & Husbandry; 3=Mining & Mining Service; 4=Constructions; 5=Food & Beverages; 6=Tobacco Manufactures; 7=Textile mill products; 8=Apparel & Other Textile Product; 9=Lumber & Wood Products; 10=Paper & Allied Products; 11=Chemi-cal & Allied Product; 12=Adhesive; 13=Plastic & Glass Products; 14=Ce-ment; 15=Metal & Allied Product; 16=Fabricated Metal Products; 17=Ca-bles; 18=Electronic & Office equipment; 19=Automotive & Allied Product; 20=Pharmaceuticals; 21=Consumer Goods; 22=Transportation Services; 23=Telecommunication; 24=Whole Sale & Retail Trade; 25=Banking; 26=Credit Agencies other than Banks; 27=Securities; 28=Insurance; 29=Real Estate & Property; 30=Hotel & Travel Services; 31=Machinery; 32=Others.
ε = regression error.
The first hypothesis is not rejected when the F is statistically significant (significance probability < α). The second hypothesis is tested using the multiple comparison analysis. Hypothesis 2a is not rejected when the value of mean difference for private-government indicates a positive and significant value, while hypothesis 2b is not rejected when the value of mean difference for foreign-private indicates a positive and significant value (significance probability < α).
EMPIRICAL TESTS AND RESEARCH RESULTS
Hypothesis Test 1
The results of the first hypothesis test use logPER, logPBV, and logROE as the proxy for performance and are presented in the following table 1.
The table presents a difference of per-formance between foreign, private, and government ownership, implying that the first hypothesis is supported. This is evident from the F-test value as large as 2,52 for the performance proxy logPER, 3,44 for the performance proxy logPBV, and 10,03 for the performance proxy logROE, which is significant with the as large as 10%, 5%, and 1% respectively. Company performance is influenced by firm size for the three perform-ance proxies. Table 1 also demonstrates the difference of company performance between years and between industries based on the significant F-test value with a significance level α of 1% for all performance proxies used in the study.
Hypothesis Test 2
Hypothesis test 2 is performed by com-paring the average performance of ownership type using multiple comparisons. The com-parisons are presented in the following (table 2).
Hypothesis 2a which states that company performance for private owned companies is better compared to government owned compa-nies is not supported. Conversely, company performance for government owned compa-nies is better compared to the private owned companies, which is apparent from the mean difference value as large as -0,17 for perform-ance proxy logPBV and -0,19 for logROE and both are significant with α=1%. Meanwhile, hypothesis 2b is supported, and is apparent in the mean difference value of foreign-private which is positive and significant with α=1%, for both proxy performance logPBV and logROE.
LogPER, logPBV, and logROE are used in the study because its use in the model produces residual distribution normality. Explanations of the results indicating that performance of government owned companies are better than private owned companies, and
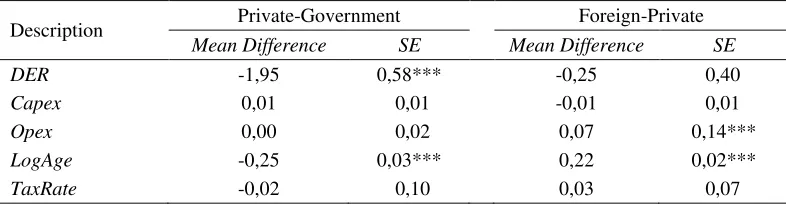
that foreign owned companies perform better than private companies, relates to the use of debt (seen from the Debt to Equity Ratio of the company, DER), company investment activity (seen based on Capital Expenditure, Capex), operational cost efficiency (seen based on Operating Expense, Opex), experi-ence (seen based on age of company, LogAge), and incentive from the government based on effective tax rate (seen based on TaxRate). Table 3 presents the results of the multiple comparison tests based on the vari-ables DER, Capex, Opex, LogAge, dan TaxRate:
Table 3 demonstrates higher debt for government owned companies compared to private owned companies, based on the DER mean difference values for private-govern-ment as large as -1,95 and significant with α = 1%. This can be interpreted by suggesting that the government owned companies tend to gain Table 1. Performance Differences
Hypothesis tests use the covariance analysis. The equation which is used to test the hypothesis is as follows:
Performance = + Type Own + Firm Size + Year + Industry ε
Description F-test
LogPER LogPBV LogROE
Type Own 2,52* 3,44** 10,03***
Firm Size 5,84** 11,43*** 24,00*** Year 10,41*** 8,84*** 4,70*** Industry 3,45*** 4,30*** 3,80***
***, **, * indicates the significance levels of 1%, 5%, 10%.
Source: Processed Data.
Table 2. Performance Differences Based on Ownership Type
Ownership Type
LogPER LogPBV LogROE
Mean difference
Standard error
Mean difference
Standard error
Mean difference
Standard error Private-Government 0,04 0,51 -0,17 0,05*** -0,19 0,05***
Foreign-Private -0,05 0,04 0,18 0,03*** 0,22 0,04***
*** indicates significance at the 1% level.
ease in using their debt, particularly related to cost of debt that must be issued by the company. The mean difference value of logAge for privategovernment is as large as -0,25 and significant at α=1%, which demon-strates that government owned companies have larger experience. The mean difference value for LogAge demonstrates the tendencies for government owned companies to be reluctant to shift or be replaced by other forms of ownership. Overall, government owned companies exhibit better performance com-pared to private owned companies in the aspects of ease of using debt, and experience.
Companies with foreign ownership types have an average logAge which is larger compared to the private owned companies, implying that foreign owned companies have more experience compared to the private owned companies. Therefore, the company performance of foreign owned companies is better compared to private companies, not because of operational cost efficiency, invest-ment activity or governinvest-ment incentives in form of tax rate, but because foreign owned companies are more experienced compared to the private owned companies.
Each industry possesses their own char-acteristic in the form of different accounting reports, and the results of tests based on
industry demonstrates that companies with the government owned companies operating in the field of constructions tend to gain ease in using debt, namely paying for cost of debt which is lower compared to their private counterparts. In addition, government owned companies working in the mining and mining service, constructions, cement and telecom-munication are more experienced compared to their private counterparts.
Foreign owned companies, in almost all fields (animal feed and husbandry, mining and mining service, food and beverages, tobacco manufactures, apparel and other textile pro-duct, cement, cables, automotive and allied products, consumer goods, and whole sale and retail trade), have more experience compared to the private owned companies. Although based on the average industries overall, no significant differences were found in invest-ment activity (capex) between foreign-private, however some industries, namely industries operating in constructions, food and bever-ages, tobacco manufactures, apparel and other textile product, metal and allied product, pharmaceutical, consumer goods, credit agen-cies other than banking, and insurance, foreign owned companies have significantly larger capex compared to private owned companies. This implies that foreign owned Table 3. Differences of DER, Capex, Opex, LogAge, and TaxRate Based on Ownership Type
Description Private-Government Foreign-Private
Mean Difference SE Mean Difference SE
DER -1,95 0,58*** -0,25 0,40
Capex 0,01 0,01 -0,01 0,01
Opex 0,00 0,02 0,07 0,14***
LogAge -0,25 0,03*** 0,22 0,02***
TaxRate -0,02 0,10 0,03 0,07
Note: *** indicates significance at 1%. SE = standard error. DER = Total Debt /Total Equity (Ramezani et
al., 2002 and Husnan, 2001). Capex = (Total fixed assetst–total fixed assetst-1)/total asset(Griner
& Gordon, 1995). Opex = Total operational costs/total asset (Fries & Taci, 2005). LogAge = Age
of company, based on the year of establishment (Villalonga & Amit, 2006). TaxRate = ratio
pre-tax income= tax paid/profit prior to tax payment (Moh’d et al., 1998).
companies with regard to industry are more active in investing compared to the private owned companies.
The overall comparison demonstrates the performance differences between ownership types are not merely caused by experience or use of debt but, as is the case for specific industries, but also because of differences in investment activity, operational cost effi-ciency and government incentive in form of tax rate.
IMPLICATIONS AND LIMITATIONS
The study contributes to the understand-ing of performance differences among ownership types. The results of the study demonstrate that foreign and government owned companies perform better compared to private owned companies. The results of the study are consistent with the findings of Fries & Taci (2005), Ngoc & Ramstetter (2004), Berger, et. al. (2006), and Bonin, et. al. (2005a & 2005b), that demonstrate different ownership types result in different influences towards company performance. The results of the study is also consistent with the argument of Hadad, et. al. (2003) that a company’s performance is influenced by who owns the company.
The study demonstrates that foreign ownership type performs better compared to the private owned companies. Based on the results of the analysis, foreign owned compa-nies perform better compared to private owned companies because they are more experienced in managing the company. Studies from Boubakri & Cosset (1998), D’Souza & Megginson (1999), Boubakri, et. al. (2005b), and Loc, et. al. (2004) , cited in Irwanto (2006) demonstrate that company performance improves in the event of privatization. In 2008, the government performed privatization policies towards 13 companies. Therefore the government can consider foreign owned companies in future implementation of privatization.
The current study demonstrates that government owned companies perform better than private owned companies. The findings are inconsistent with the study’s hypothesis. Therefore, performance differences between government owned and private owned compa-nies need to be further investigated using samples with larger representation from gov-ernment owned companies for example extending the period of the study or consider-ing companies that do not go public. The performance proxy which is used remains limited, therefore further studies could use other performance proxies with considering companies from various fields of industries.
REFERENCES
Barclay, M. J., and C.G. Holderness, 1991.” Negotiated block trades and corporate control”. Journal of Finance, 46, 861-878.
Berger, A.N., G.R.G. Clarke, R. Cull, L. Klapper, and G.F. Udell, 2005. “ Corpo-rate Governance and Bank Performance: A Joint Analysis of The Static, Selection, and Dynamic Effects of Domestic, Foreign, and State Ownership”. Journal of Banking and Finance, 29, 2179-2221. Berger, A.N., L.F. Klapper, M.S.M. Peria, and
R. Zaidi, Juli 2006. Bank Ownership Type and Banking Relationship”. Available at http://www.ifk-cfs.de/ fileadmin/downloads/
events/conferences/2006-Public_Martinez-Peria.pdf, accessed March 22, 2007.
Boubakri, N., and J. Cosset, 1998. “The Financial and Operating Performance of Newly Privatized Firms: Evidence from Developing Countries”. Journal of Finance, 53, 1081-1110.
Structure and Investor Protection”. Jour-nal of Financial Economics, 76, 369-399. Boubakri, N., J. Cosset, K. Fischer, and O.
Guedhami, 2005b. “Privatization and Bank Performance In Developing Coun-tries”. Journal of Banking and Finance, 29, 2015-2041.
Berle, A.A., and C.G. Means, 1932. The Modern Corporation and Private Prop-erty. New York: Commerce Clearing House.
Boeker, W, 1992. “Power and Managerial Dismissal: Scapegoating at The Top”. Administrative Science Quaterly, 37, 400-421.
Bonin, J. P., I. Hasan, and P. Wachtel, 2005a. “Bank performance, efficiency and ownership in transition countries”. Jour-nal of Banking and Finance, 29, 31–53. Bonin, J. P., I. Hasan, and P. Wachtel, 2005b.
“Privatization matters: Bank efficiency in transition countries”. Journal of Banking and Finance, 29, 2155–2178.
Cull, R., and L.C., Xu, 2005. “Institutions, ownership, and finance: the determinants of profit reinvestment among Chinese firms”. Journal of Financial Economics, 77, 117–146.
Dharwadkar, Ravi, 2000. “Privatization In emerging Economies: An Agency Theory Perspective”. Academy of Management Review, 25 (3), 650-669.
Demsetz, H., 1983. “The Structure of Owner-ship and The Theory of The Firm”. Journal of Law and Economics, 26, 375-390.
Demsetz, H. and K. Lehn, 1985. ”The Structure of Corporate Ownership: Causes and Consequences”. Journal of Political Economy, 93, 1155-1177.
Demsetz, H. and B. Villalonga, 2001. “ Own-ership Structure and Corporate Perform-ance”. Journal of Corporate Finance, 7, 209-233.
D’Souza, J. and W. Megginson, 1999. “The Financial and Operating Performance of Privatized Firms During The 1990s”. Journal of Finance, 54, 1397-1438. Fries, S. and A. Taci, 2005. “Cost efficiency
of banks in transition: Evidence from 289 banks in 15 post-Communist countries”, Journal of Banking and Finance, 29, 55– 81.
Frydman, R., C. Gray, M. Hessel, and A. Rapaczynski, June 1997. “Private Owner-ship and Corporate Performance: Some Lessons From Transition Economies”. Policy Research Working Paper Series, 1830.
Ghozali, H.I, 2006. Analisis Multivariate Lanjutan dengan Program SPSS [Ad-vance Multivariate Analysis with SPSS Program]. Edisi 1. Semarang: Universitas Diponegoro.
Griner, E.H. and L.A. Gordon, 1995. “Internal Cash Flow, Insider Ownership, and Capital Expenditures: A Test of Pecking Order and Managerial Hypotheses”. Journal of Business Finance and Accounting, 22 (2), 179-199.
Hadad, M.D., A. Sugiarto, W. Purwanti, M.J. Hermanto, and B. Arianto, 2003. “Kajian Mengenai Struktur Kepemilikan Bank Di Indonesia [A Study concerning Owner-ship Structure of Indonesian Banks]”. Available at http://www.bi.go.id/NR/ rdonlyres/0A5EA2D0-5D87-488E-A263-44988C6EE1A0/7825, accessed March 22, 2007.
Hanafi, M.M, 2004, Manajemen Keuangan [Financial Management]. Edisi 2004/ 2005. Yogyakarta: BPFE.
Hanousek, J., E. Kocenda, and J. Svejnar, 2007. “Origin and Concentration. Corpo-rate Ownership, Control and Performance in Firms After Privatization”. Economics of Transition, 15 (1), 1-31.
Corporate Productivity”. Academy of Management Journal, 32, 25-46.
Holderness, C. G., and D.P. Sheehan, 1988. “The role of majority shareholders in publicly held corporations: An explora-tory analysis”. Journal of Financial Economic, 20, 317-346.
Husnan, Suad, 2001. “Corporate Governance dan Keputusan Pendanaan: Perbandingan Kinerja Perusahaan dengan Pemegang Saham Pengendali Perusahaan Multina-sional dan Bukan MultinaMultina-sional [Corpo-rate Governance and Financing Decisions: Performance Comparison between Multi-national Corporates and Non-Multina-tional Corporate]”. Jurnal Riset Akun-tansi, Manajemen, Ekonomi, 1 (1), 1-12. Irwanto, Ferry, 2006. State Owned
Enter-prises Performance after Privatization: Evidence of Republic of Indonesia. Thesis in Master Program Groningen University. Available at Kompas Newspaper. Re-trieved on Februari 1, 2006, 33-34. Jensen, M.C. and W.H. Meckling, 1976.
“Theory of The Firm: Managerial Behav-ior, Agency Costs and Ownership Struc-ture”. Journal of Financial Economics, 3, 305-360.
Joh, S. W, 2003. “Corporate governance and firm profitability: Evidence from Korea before the economic crisis”. Journal of Financial Economics, 68, 287–322. Khanna, T., and K. Palepu, 1999. Emerging
market business groups, foreign investors, and Corporate governance. Washington, DC: National Bureau of Economic Research.
Marciano, D., 2008. “Pengaruh Asimetri Informasi, Moral Hazard dan Struktur Pendanaan dalam Penentuan Harga Pinjaman Korporasi dalam Bentuk US Dollar: Studi Empiris di Indonesia Periode 1990-1997 [The Influence of Asymmetric Information, Moral Hazard, and Financing Structure in Determining Corporation Loans in US Dollar: An
Empirical Study in Indonesia 1990-1997)”. Dissertation in Doctoral Program Gajah Mada University, not to be published.
McDonald, K. R., 1993. “Why privatization is not enough”. Harvard Business Review, 71 (3), 49-59.
Meitisari, P., 10 Desember 2007. Ke Mana Arah Privatisasi BUMN Tahun 2008? (Where are the privatizations of Govern-ment’s Firm towards in 2008)”. Available at http://pusri.wordpress.com/2007/12/10/ ke-mana-arah-privatisasi-bumn-tahun-2008, accessed December 10, 2007. Mikkelson, W.H., and R.S. Ruback, 1991.
“Targeted repurchases and common stock returns”. Rand Journal of Economics, 22, 544-561.
Moh’d, M.A., L.G. Perry, and N. Rimbey, 1998. “The Impact of Ownership Struc-ture On Corporate Debt Policy: a Time-Series Cross-Sectional Analysis”. The Financial Review, 3, 85-98.
Nasution, B, 2007a. Privatisasi BUMN Perkebunan dalam perpektif hukum [Privatization of Plantation State-Owned Enterprises from a Legal Perspective]. Available at ttp://bismarnasty.files. wordpress.com/2007/06/privatisasi-pps.pdf, accessed Mei 28, 2007.
Nasution, B, Jumat, 20 April 2007b. Privatisasi: Menjual atau Menyehatkan BUMN [Privatization: To Sell or To Revitalize the State-Owned Enterprises]. Available at http://bismarnasty.files. wordpress.com/2007/05/privatisasi_jurnal -nasional_2007.pdf, accessed Mei 28, 2007.
Ngoc, P.M., and E.D. Ramstetter, 2004. “Foreign Multinationals and Local Firms in Vietnam’s Economic Transition”. Asian Economic Journal, 18 (4), 371-404. Patriadi, P., 2003. “Studi Banding Kebijakan
Several Countries]”. Kajian Ekonomi dan Keuangan, 7 (4), 55-102.
Purwoko, 2002. “Model Privatisasi BUMN yang Mendatangkan Manfaat Bagi Pemerintah dan Masyarakat Indonesia [The Model of State-Owned Enterprise Privatization which wreaked benefit to the Government]”. Kajian Ekonomi dan Keuangan, 6 (1), 1-21.
Primiana, I., 2003. Privatisasi BUMN Perlu Nasionalisme [Privatization of State-Owned Enterprise Requires Nationalism]. Available at http://www.pikiran–rakyat. com/cetak/0503/10/06x9.htm, accessed June 22, 2007.
Ramezani, C.A., L. Soenen, and A. Jung, 2002. “Growth, Corporate Profitability, and Value Creation”. Financial Analyst Journal, 58 (6), 56-67.
Shleifer, A. and R.W. Vishny, 1997. “A Survey of Corporate Governance”. The Journal of Finance, LII (2), 737-783. Villalonga, B., and R. Amit, 2006. “How Do
Family Ownership, Control and Manage-ment Affect Firm Value”. Journal of Financial Economics, 80, 385-417. Welch, E., 2003. “The Relationship Between
Ownership Structure and Corporate Per-formance in Listed Australian Compa-nies”. Australian Journal of Management, 28, 287-305.