Proposed Site-Specific Response Spectra for Surabaya-Madura
Bridge
Masyhur Irsyam1,2 , Donny T. Dangkua1, Hendriyawan1, R. Bambang Boediono1,
Dyah Kusumastuti1, Engkon K. Kertapati3
Abstract: This paper presents a site-specific seismic hazard study to determine the recommended seismic design criteria for Suramadu Bridge. The study is performed using probabilistic seismic hazard approach to determine maximum acceleration and response spectra at bedrock and followed by local site effect analysis to determine maximum acceleration and response spectra at ground surface. The probabilistic seismic hazard analysis (PSHA) is carried out using 3-dimension (3-D) seismic source models (fault source model). Two hazard levels are analysed to represent 150 and 3,300 years return period of ground motion around site location. The local site effect analysis is performed using 1-dimension (1-D) shear wave propagation theory to obtain peak ground acceleration and response spectra at ground surface. Finally, the site-specific surface response spectra with 5 percent damping are developed based on the mean plus one standard deviation concept from the result of local site effect analysis.
Keywords: seismic hazard analysis, 3-D seismic source model, de-aggregation, local site effect analysis, design response spectra
Introduction
Surabaya-Madura (Suramadu) Bridge is planned to be built on the northern part of East Java Province in Indonesia, spanning the Madura Channel, connecting Surabaya with Madura Island (Figure 1). In order to ensure the safety of bridge structure considering the seismological, geotechnical, and structural aspects, a site-specific seismic hazard analysis is required.
Past earthquakes have shown that damages induced in bridges can take many forms, depending on the ground motion, site conditions, structural confi-guration, and specific details of the bridge. Recent earthquakes, particularly the 1989 Loma Prieta and the 1994 Northridge earthquakes in California, the 1995 Hyogo-Ken Nanbu earthquake in Japan, the 1999 Jiji earthquake in Taiwan, and the 1999 Kocaeli earthquake in Turkey, have caused collapse of, or severe damage to, a considerable number of major bridges [1, 2]. Therefore, a thorough examina-tion of the structure and its environment should be conducted in seismic design of bridge to determine the criteria selection including the seismic use group and importance factor, intended service/damage level, and performance objectives.
1 Faculty of Civil Engineering and Enviromental, Institut Teknologi Bandung, Indonesia
2 Corresponding author, Owner Expert at Suramadu Bridge Project
E-mail: [email protected]
3 Geological Research and Development Center, Indonesia
Note: Discussion is expected before November, 1st 2008, and will be published in the “Civil Engineering Dimension” volume 11, number 1, March 2009.
Received 25 January 2008; revised 26 January 2008; accepted 5 June 2008.
This paper presents a site-specific seismic hazard analysis for Suramadu Bridge. Two levels of ground motion hazard that represent 150 yr and 3300 yr return period of ground motion were analyzed in this paper using total probability theorem. Artificial time histories for site location were also developed using spectral matching analysis. Finally, ground response analysis was performed using 1-D shear wave propagation analysis to develop the design response spectra.
Overview of Seismotectonic Conditions
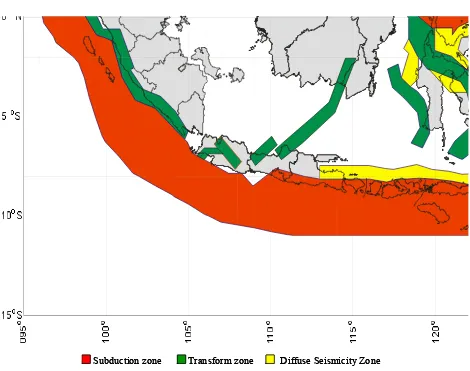
The seismic sources influencing Suramadu Bridge can be divided into subduction zone, transform zone, and diffuse seismicity zone. Subduction zone events occurred when an oceanic plate is being subducted under an island arc or continent. Thrust fault earthquakes along the interface, normal faulting events along the outer arc high and in the trench, and reverse and strike-slip faulting events in the upper plate fall within this classification as long as they are close to a convergent margin of the subduction zone.
The strike-slip events along the clearly defined faults in the frontal arc area such as Sumatera, Sorong and Mamberamo Fault are classified as transform fault zone events such as Palu-Koro and Matano Faults, Lengguru and Tarera Aiduna Faults.
Fig. 1. Suramadu Bridge
Subduction zone Transform zone Diffuse Seismicity Zone
Subduction zone Transform zone Diffuse Seismicity Zone
Data Collection and Processing
Seismic hazard assessment requires a history as complete as possible of earthquakes in or near the region of interest. The earthquake catalog used in this study is based on compilation of several catalogs from local and international institutions, such as International Seismological Center (ISC), National U.S. Geological Survey (USGS), Bureau of Meteorology and Geophysics (BMG), Indonesia and several individual catalogs.
The combined catalog covers an area from 90oE to
125oE longitude and 10oS to 10oN latitude. From the
catalog dating from 13 May 1897 to 31 December 2004, there are a total of 14119 earthquake events. The minimum magnitude is 5.0 and the maximum focal depth is 200 km.
Typical characteristic of earthquake catalogs are as follows: (1) the magnitude scales used in the catalogs are not uniform. This is due to the fact that the earthquake events were recorded using more than one type of instrument; (2) the earthquake catalogs contained both the main shock events and the accessory shock events (foreshock and aftershock events). Therefore, the data are not valid to be used
when the temporal occurrence of earthquakes are analyzed using Poisson model; and (3) the small events are usually incomplete in earthquake catalogs. This is due to the limited sensitivity and coverage of the earth by seismographic networks.
The first problem is solved by choosing a consistent magnitude for seismic hazard assessment (SHA), and then the other magnitude scales are converted to the chosen magnitude scale by using empirical correlation [4,5,6]. In this research, a moment magnitude, Mw, is chosen as a measurement to
quantify the size of earthquake. Other types of magnitude in the catalogs were then converted to Mw
by using empirical correlations.
The second problem is solved by declustering the catalog using time and distance windows criteria [7]. The criteria proposed by Gardner and Knopoff [7] were used in this research because this criteria has considered the time and distance windows for magnitude above 8.0. The algorithm eliminated 6028 records from the catalog, and the result is shown in Figure 3.
The third problem is solved by performing catalog completeness analysis. In this study, historical
earthquake data occurred between 1900 and 2004 have been analyzed for completeness using Stepp method [8]. Based on the catalog completeness analysis the earthquakes within interval 5.0<Mw<6.0 and 6.0<Mw<7.0 are completely recor-ded only for the last 27 and 31 years period of observation, respectively. While the earthquake catalog for the magnitude of 7.0<Mw<8.0 and Mw>8.0 are considered complete for the whole time length of the catalog.
Seismotectonic Model
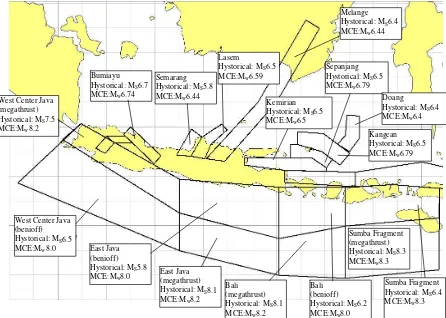
There are three potential seismogenic sources addressed in this study, (1) Sunda Arc subduction fault (2) reverse thrusting fault and (3) shallow crustal fault. According to these seismotectonic features, seismic sources zone around site region are divided into several seismic zones. The location of those zones can be seen in Figure 4.
Based on the dip angle and location of the focal depth, subduction zones was divided into interplate (megathrust) and intraslab (benioff) zones. In this study, only seismic source zones within a radius of 500 km from the site were considered. Those outside this radius were assumed to have insignificant influence for the peak ground acceleration.
Seismic Hazard Parameters
b-value and Annual Rate
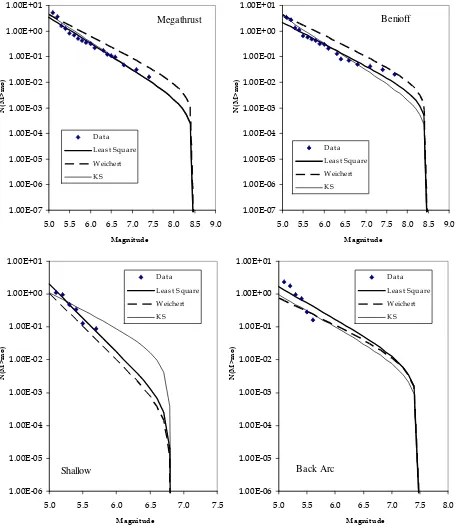
Temporal distribution of earthquakes is commonly assumed to follow frequency-magnitude relationship proposed by Gutenberg-Richter (G-R) [9]. Several researchers have proposed alternative methods to obtain more reliable frequency magnitude relation-ship [10, 11, 12, 13, 14]. In this study, the seismicity rates of each source zones were calculated using the method proposed by Weichert [12], Kijko and Sellevoll [13, 14]. These methods considered the relationship between earthquake data and interval time when the catalogs are homogeneous (comple-teness time). The seismicity parameters for each source zone used in this analysis are shown in Figure 5.
Maximum Magnitude and Slip Rate
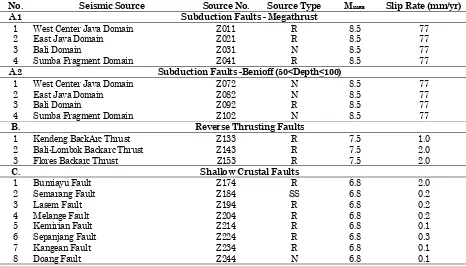
The maximum magnitude and slip rate are esti-mated based on the evaluation of available data and tectonic of the region. The procedure identifies a reasonable maximum magnitude for the given potential seismic source, and its most reasonable slip rate in the current tectonic environment. The values for maximum magnitude and slip rate of earthquake sources influencing the proposed site are listed in Table 1. Hystorical: MS8.1 MCE:Mw8.2
Bali (megathrust) Hystorical: MS8.1 MCE:Mw8.2
Sumba Fragment (megathrust) Hystorical: MS8.3 MCE:Mw8.3 West Center Java
(benioff) Hystorical: MS6.4 MCE:Mw8.3 Bumiayu
Hystorical: MS6.7 MCE:Mw6.74
Semarang Hystorical: MS5.8 MCE:Mw6.44
Lasem
Hystorical: MS6.5 MCE:Mw6.59
Attenuation Relationship
One of the critical factors in seismic analysis is to obtain or to select appropriate attenuation relation-ship. This formula, also known as ground motion relation, is a simple mathematical model that relates a ground motion parameter (i.e. spectral accelera-tion, velocity and displacement) to earthquake source parameter (i.e. magnitude, source to site distance, mechanism) and local site condition [15].
There has been a number of attenuation relations derived in the last two decades since the record of ground motions becomes more available. In general, they are categorized according to tectonic environ-ment (i.e. subduction zone and shallow crustal earthquakes) and site conditions. In this study, the attenuation relationships for subduction zone at rock sites developed by Youngs [16] and that for shallow crustal developed by Boore, Joyner, Fumal [17] and Sadigh [18] for extension tectonic region were 1.00E-07
selected to estimate peak ground acceleration and response spectra at bedrock. The selection was based on previous study by Irsyam [19] for the develop-ment of the Indonesia seismic zone map, which indicated that these attenuation functions have a low variability compared to others.
Seismic Hazard Analysis
Epistemic uncertainty is included in the probabilistic seismic hazard assessment (PSHA) by explicitly including alternative hypotheses and models. The logic tree allows a formal characterization of uncer-tainty in the analysis by explicitly including alterna-tive interpretations, models, and parameters that are weighted in the analysis according to their probability of being correct. Logic trees [20, 21, 22] are used in this study in order to allow uncertainty in selection of models for attenuation, recurrence rate, and maximum magnitude to be considered. The logic tree model is illustrated in Figure 6.
The PSHA was performed using the total probability theorem developed by McGuire [23]. This theorem is based on the probability concept developed by Cornell [24], which assumed the earthquake magni-tude M and the hypocenter distance R as a conti-nuous independent random variable.
The analysis was conducted by using software EZ-FRISK [24] that has capability of 3-Dimension modeling for earthquake source. Using 3-Dimension model, it is expected that the results of hazard analysis became more accurate. The sequence of seismic hazard calculations for 3-D fault sources model can then be represented by a modified form of previous equation as follows:
[
]
Seismic Hazard Exposure
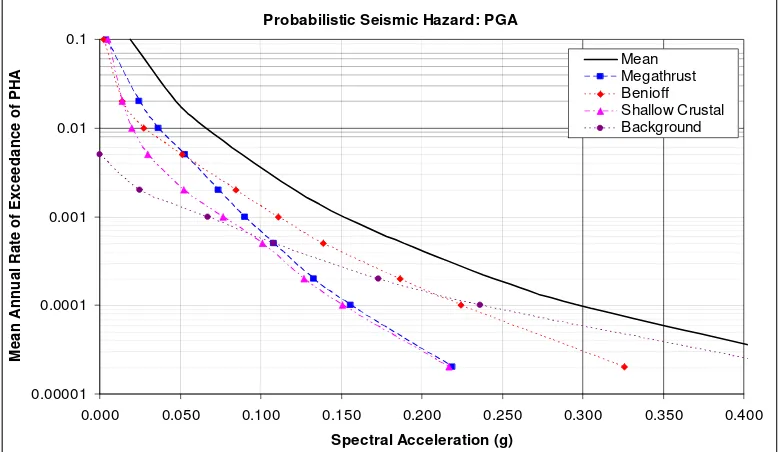
The result of PGA for difference return period for Suramadu Bridge location is shown in Figure 7. Seismic hazard for Suramadu Bridge location inclu-ding the relative contributions from each source for PGA is shown in Figure 8.
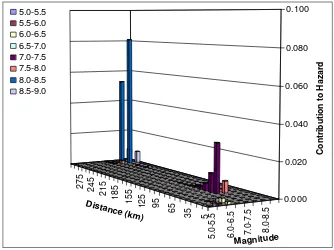
For physical interpretation of the results from PSHA and to take certain engineering decisions, de-aggre-gation analysis was performed in this study. The results of de-aggregation were used to identify the mean magnitude and distance of earthquakes that control the ground motions at a particular response spectral frequency. Figure 9 shows an example of the result of de-aggregation hazard for Suramadu Bridge.
Table 1. Estimated maximum magnitude and slip rate for earthquake sources influencing the site location
No. Seismic Source Source No. Source Type Mmax Slip Rate (mm/yr)
A.1 Subduction Faults - Megathrust
1 West Center Java Domain Z011 R 8.5 77
2 East Java Domain Z021 R 8.5 77
3 Bali Domain Z031 N 8.5 77
4 Sumba Fragment Domain Z041 R 8.5 77
A.2 Subduction Faults -Benioff (50<Depth<100)
1 West Center Java Domain Z072 N 8.5 77
2 East Java Domain Z082 N 8.5 77
3 Bali Domain Z092 R 8.5 77
4 Sumba Fragment Domain Z102 N 8.5 77
B. Reverse Thrusting Faults
1 Kendeng BackArc Thrust Z133 R 7.5 1.0
2 Bali-Lombok Backarc Thrust Z143 R 7.5 2.0
3 Flores Backarc Thrust Z153 R 7.5 2.0
C. Shallow Crustal Faults
Fig. 7. Logic tree used in this study
0.152
0.189
0.245
0.019 0.047
0.077
0.233
0.000 0.050 0.100 0.150 0.200 0.250 0.300
0 500 1000 1500 2000 2500 3000 3500 4000 4500 5000
Return Period (year)
P
e
ak
G
round Accel
e
ra
ti
on (
g
)
Fig. 7. Seismic hazard exposure at Suramadu Bridge for various return periods
Probabilistic Seismic Hazard: PGA
0.00001 0.0001 0.001 0.01 0.1
0.000 0.050 0.100 0.150 0.200 0.250 0.300 0.350 0.400
Spectral Acceleration (g)
M
e
a
n
A
n
n
u
a
l R
a
te
of
Excee
da
nce
o
f
P
H
A
Mean Megathrust Benioff Shallow Crustal Background
Time Histories
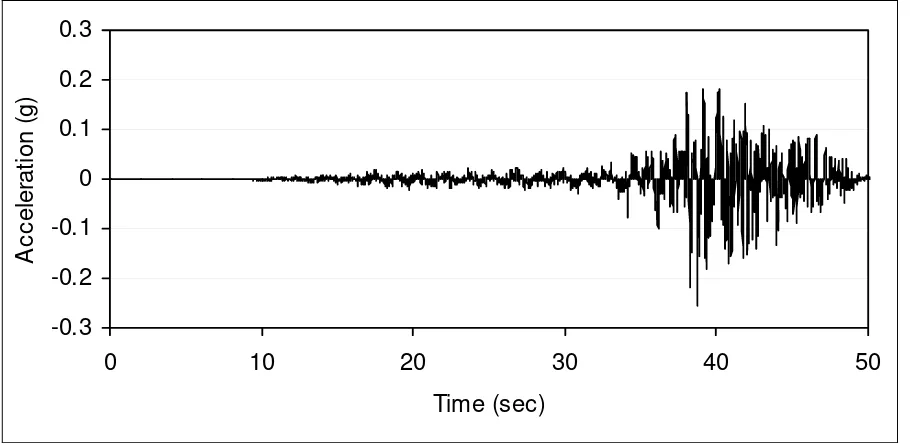
Acceleration time-histories are required in the analysis of shear wave propagation in soil deposits. Selection of time-histories appropriate for specific geological and seismological conditions plays an important role for obtaining accurate results. Since there are no strong motions detected near the site, the ground motion was selected based on the controlling earthquake with specific magnitude and distance for each source and various return periods from the de-aggregation result. For each source mechanism, response spectra were generated using appropriate attenuation functions. These response spectra were scaled to the T=2.0 second value as shown in Figure 10. Scaled time histories were then generated using spectral matching analysis. An example of time histories for subduction event is shown in Figure 11.
Local Site Effect
The local soil effect analysis in this study was carried out using 1-D shear wave propagation theory to obtain the estimate of ground motion parameter, i.e. surface spectral acceleration and time histories. The Geotechnical software, NERA [26], was employed for this procedure.
In this study, the soil dynamic property for the site location was based on the result of shear wave velocity measurement which can be found in the report of Seismic Ground Motion Parameters at Suramadu Bridge Site Indonesia conducted by Institute of Geophysics, China Earthquake
Adminis-tration [27]. The shear wave velocity data is avai-lable until 90 m depth. For this analysis, it was assumed that the bedrock at the site location is at 250m depth, since from the 90 m deep bored-hole results there was no bedrock found yet. The shear wave velocity profile for the depth below 90 m to 250 m was estimated. Shear wave velocity profile used in this analysis is shown in Table 2
The result of local site effect analysis using 1-D shear wave propagation analysis from bedrock to ground surface is shown in Figure 12. The computed surface spectral accelerations were obtained using scaled bedrock time histories. Based on these spectral accelerations, the average and average plus one standard deviation response spectral acceleration were calculated.
Development of Site-Specific Design Response Spectra
The recommended design spectra for this study are presented in Figure 13 for return period of 150 years and 3300 years. The recommended response spectra were determined based on mean plus one standard deviation. In this project, the elastic surface response spectra for 50% and 3% probability of exceedance (PE) in design time period of 100 years (correspon-ding to return period of approximately 150 and 3,300 years, respectively) were used to develop the expec-ted earthquake (EE) and the maximum considered earthquake (MCE) spectra, respectively. This MCE response spectrum was taken as the design spectra for designing an inelastic structural response, whereas the elastic design spectra were obtained using EE response spectra.
5
0.000 0.200 0.400 0.600 0.800 1.000 1.200 1.400 1.600 1.800 2.000
0.010 0.100 1.000 10.000
Period (Second)
S
p
ect
ra
l A
ccel
er
at
io
n (
g
)
Megathrust Benioff Shallow Crustal All Sources Background
Fig. 10. Scaled spectra to T=2.0 second for Suramadu Bridge with 3300 year return period of hazard
-0.3
-0.2
-0.1
0
0.1
0.2
0.3
0
10
20
30
40
50
Time (sec)
A
c
c
e
le
ra
ti
o
n
(g
)
Table 2. Shear wave velocity at Suramadu Bridge [27]
Layer Order Description of Soil Depth (m) Thickness (m) VS (m/s)
1 Clay 0.0-4.0 4.0 130
2 Sandy Clay 4.0-9.6 5.6 180
3 Silty Clay 9.6-11.5 1.9 200
4 Clayey Silt 11.5-16.00 4.5 360
5 Sandy Silt 16.0-23.1 7.1 330
6 Clayey Silt 23.1-34.6 11.5 345
7 Silty Clay 34.6-48.0 13.4 375
8 Clayey Silt 48.0-54.0 6.0 350
9 Clayey Silt 54.0-58.0 4.0 320
10 Clayey Silt 58.0-61.0 3.0 310
11 Clayey Silt 61.0-65.0 4.0 350
12 Clayey Silt 65.0-68.0 3.0 290
13 Clayey Silt 68.0-78.0 10.0 310
14 Clayey Silt 78.0-84.0 6.0 300
15 Clayey Silt 84.0-90.0 6.0 390
0.00 0.10 0.20 0.30 0.40 0.50 0.60 0.70 0.80 0.90 1.00
0.00 0.50 1.00 1.50 2.00 2.50 3.00 3.50 4.00
Period (sec)
Sp
ect
ra
l A
ccel
er
at
io
n
(
g
)
Fig. 12. Computed surface spectral acceleration for Suramadu Bridge with 3300 years return period of hazard
0.0 0.1 0.2 0.3 0.4 0.5 0.6 0.7 0.8 0.9
0.0 0.5 1.0 1.5 2.0 2.5 3.0 3.5 4.0
Period (sec)
Sa
(
g
)
H 150 (EE) H 3300 (MCE)
Fig. 12. Recommended design response spectra for Suramadu Bridge
Average + 1SD
Conclusions
The site-specific seismic hazard assessment for Suramadu Bridge has been described in this paper. The analysis used was a probabilistic approach for return periods of 150 yr and 3300 yr of earthquake hazard. The controlling earthquakes were derived by employing deaggregation process. Finally, the design response spectra at ground surface for 5 percent damping were developed. The design spectra obtained from this study could be used for further design procedures.
References
1. Moehle, J.P. and Eberhard, M. O., Earthquake
Damage to Bridges, in Bridge Engineering
Handbook, Chen, W.F. and Duan, L., Eds., CRC
Press, Boca Raton, FL, chap. 34, 2000.
2. Yashinsky, M., Earthquake Damage to Struc-tures, in Structural Engineering Handbook
CRCnetBase 2000, Chen, W.F. and Duan, L.,
Eds., CRC Press, Boca Raton, FL, chap. 29a. 2000.
3. Firmansjah, J. and Irsyam, M., Development of Seismic Hazard Map for Indonesia, Prosiding Konferensi Nasional Rekayasa Kegempaan di
Indonesia, Institut Teknologi Bandung,
Indo-nesia, 1999, pp, I-29-I-41.
4. Geller, R.J., Scaling Relations for Earthquake Source Parameters and Magnitudes, Bulletin of
the Seismological Society of America, Vol. 66,
1976, pp, 1501–1523.
5. Rong, Y, Evaluation of Earthquake Potential in
China, University of California Los Angeles,
PhD. Thesis, 2002.
6. McGuire, R.K., Seismic Hazard and Risk
Analysis, Oakland, California, EERI, 2004.
7. Gardner, J.K., and Knopoff, L., Is the Sequence of Earthquakes in Southern California, with Aftershocks removed, Poissonian?, Bulletin of
the Seismological Society of America, Vol. 64,
No. 5, 1974, pp, 1363-1367.
8. Stepp, J.C., Analysis of the Completeness of the Earthquake Hazard Sample in the Puget Sound
Area, NOAA Technical Report, ERL 267-ESL
30, May 1973, Boulder, CO, pp, 16-28. 1973.
9. Gutenberg, B., Richter, C. F., Seismicity of the
Earth, Princeton University Press, Princeton,
New Jersey, 1954.
10. Dong, W. M., Bao, A. B., and Shah, H. C, Use of Maximum Entropy Principle in Earthquake Recurrence Relationship, Bulletin of the
Seimological Society of America, Vol. 74, No. 2,
1984, pp, 725-737.
11. Bender, B., Incorporating Acceleration Varia-bility into Seismic Hazard Analysis, Bulletin of
the Seismological Society of America, Vol. 74,
No. 4, 1984, pp, 1451-1462.
12. Weichert, D.H., Estimation of the Earthquake Recurrence Parameters for Unequal Observa-tion Periods for Different Magnitudes, Bulletin
of the Seismological Society of America, Vol. 70,
No.4, 1980.
13. Kijko, A. and Sellevol, M.A., Estimation of Earthquake Hazard Parameters from Incom-plete Data Files Part I. Utilization of Extreme and Complete Catalog with Different Threshold Magnitudes, Bulletin of the Seismological
Socie-ty of America, Vol. 79, No. 3, 1989, pp, 645-654.
14. Kijko, A., Sellevol, M.A., Estimation of Earth-quake Hazard Parameters from Incomplete Data Files Part II. Incorporation of Magnitude Heterogeneity, Bulletin of the Seismological
Society of America, Vol. 82, No. 1, 1992.
15. Campbell, K.W., Prediction of strong ground Motion using the Hybrid Empirical Method and its use in the Development of Ground-Motion (Attenuation) Relations in Eastern North Ame-rica, Bulletin of the Seismological Society of
America, Vol. 93, 2003, pp, 1012–1033.
16. Youngs, R.R., Chiou, S.J., Silva, W.J., Hum-phrey, J.R. Strong Ground Motion Attenuation Relationships for Subduction Zone Earthquake,
Seismological Research Letters, Vol. 68, No. 1,
1997.
17. Boore, D.M., Joyner, W.B., and Fumal, T.E., Equation for Estimating Horizontal Response Spectra and Peak Acceleration from Western North America Earthquakes: A Summary of Recent Work, Seismological Research Letters, Vol. 68, No. 1, 1997.
18. Sadigh, K., et al. Attenuation Relationships for Shallow Crustal Earthquakes Based on Cali-fornia Strong Motion Data, Seismological
Research Letters, Vol. 68, No. 1, 1997.
19. Irsyam, M. Development of Earthquake Micro-zonation and Site Specific Response Spectra to Obtain More Accurate Seismic Base Shear
Coefficient. Final Report for University
Rese-arch for Graduate Education (URGE) Project. Department of Civil Engineering, Institute of Technology Bandung, 2001.
20. Power, M. S., Coppersmith, K. J., Youngs, R. R., Schwartz, D. P., Swan, R. H., Seismic Exposure Analysis for the WNP-2 and WNP-1/4 Site:
Appendix 2.5K to Amendment No. 18, Final
21. Kulkarni, R.B., Youngs, R.R., Coppersmith, K.J. Assessment of Confidence Intervals for Results of Seismic Hazard Analysis, Proceeding, 8th World Conference on Earthquake Engineer-ing, San Francisco, 1984, pp, 90-98.
22. Coppersmith, K. J., Youngs, R. R. Capturing Uncertainty in Probabilistic Seismic Hazard Assessment with Intraplate Tectonic Environ-ments, Proceedings, 3rd U. S. National
Confe-rence on Earthquake Engineering, Charleston,
South Carolina, Vol. 1, 1986, pp, 301-312.
23. McGuire, R.K., FORTRAN Computer Program
for Seismic Risk Analysis, US Geological Survey
Open File Report: 67-76, 1976.
24. Cornell, C.A. Engineering Seismic Risk Analy-sis, Bulletin of the Seismological Society of
America, Vol. 58, 1968, pp, 1583-1606.
25. Risk Engineering Inc. EZ-FRISK version 7.20 Software for Earthquake Ground Motion
Esti-mation. User’s Manual, 2006.
26. Bardet, J.P., Tobita, T., A Computer Program for Non-linear Earthquake Response Analyses of
Layered Soil Deposits, Department of Civil
Engineering, University of Southern California, 2001.
27. Institute of Geophysics, China Earthquake Administration, Seismic Ground Motion Para-meters at Suramadu Bridge Site, Indonesia,
![Table 2. Shear wave velocity at Suramadu Bridge [27]](https://thumb-ap.123doks.com/thumbv2/123dok/3672356.1469703/10.595.78.498.102.500/table-shear-wave-velocity-suramadu-bridge.webp)
