THE INFLUENCE OF SPECTRAL WAVELENGTH ON THE QUALITY OF
PANSHARPENED IMAGE SIMULATED USING HYPERSPECTRAL DATA
M. Matsuoka a *
a Natural Science Cluster, Kochi University, 200 Monobe-otsu, Nankoku, Kochi, 783-8502 Japan - [email protected]
Commission VII, WG VII/6
KEY WORDS: Pansharpening, Fusion, Hyper spectral, AVIRIS, Spectral response, Comparison
ABSTRACT:
Preservation of the spectral characteristics in multispectral images is important in the development of pansharpening methods because it affects the accuracy of subsequent applications, such as visual interpretation, land cover classification, and change detection. The combinations of the spectral properties (observation wavelength and width of spectral bands) of multispectral and panchromatic images affect both the spatial and spectral quality of pansharpened images. Therefore, the clarification of the relations between spectral bands and quality of pansharpened image is important for improving our understanding of pansharpening methods, and for developing better schemes for image fusion. This study investigated the influence of the spectral waveband of panchromatic images on the image quality of multispectral (MS) images using simulated images produced from hyperspectral data. Panchromatic images with different spectral band position and multispectral images with degraded spatial resolution were generated from airborne visible/infrared imaging spectrometer (AVIRIS) images and pansharpened using seven methods: additive wavelet intensity, additive wavelet principal component, generalized Laplacian pyramid with spectral distortion minimization, generalized intensity-hue-saturation (GIHS) transform, GIHS adaptive, Gram–Schmidt spectral sharpening, and block-based synthetic variable ratio. The pansharpened near-infrared band was visually and statistically compared with the non-degraded image. Wide variation in quality was identified visually within and between methods depending on the spectral wavelengths of the panchromatic images. Quantitative evaluations using three frequently used indices, the correlation coefficient, erreur relative globale adimensionnelle de synthèse (ERGAS), and the Q index, showed the individual behaviors of the pansharpening methods in terms of the spectral similarity in panchromatic and near-infrared, though all methods had similar qualities in the case with the lowest similarity. These findings are discussed in terms of the fundamentals and structures of the methods.
1. INTRODUCTION
Image fusion is one way to use remote sensing to improve our understanding of the Earth’s surface through the synthesis of huge volumes of satellite and geographical data. Pansharpening is an image-fusion technique that generates higher spatial resolution multispectral images by combining lower resolution multispectral images with higher resolution panchromatic images. Most pansharpening methods alter the spectral properties of multispectral images while improving the spatial resolution (Ehlers et al., 2010, Alparone et al., 2007). Therefore, the preservation of spectral characteristics is essential when evaluating the performance of the methods. As spectral deformation can result from the difference in the spectral wavelengths of panchromatic and multispectral images, it is necessary to investigate the influence of the spectral characteristics on the quality of pansharpened images to improve pansharpening methods.
Hyperspectral remote sensing or imaging spectroscopy can provide a smooth spectral curve of a target by using a set of higher spectral resolution detectors (Jensen, 2007). This spectral information is quite useful for detail analyses of land-surface features such as vegetation or mineral resources. Several airborne and spaceborne sensors have been operated or are planned (e.g., Matsunaga et al., 2011). Additionally, hyperspectral data are convenient for simulating multispectral data by using the weighted average of spectral bands. A wide variety of multispectral images with different spectral responses
gives effective information for algorithm development, data assimilation, and sensor design.
This study investigated the influence of the spectral waveband of panchromatic images on the spectral characteristics of pansharpened multispectral data using a simulated set of data that was produced from hyperspectral data. This study focused on the quality change of the near-infrared band of multispectral data due to the pansharpening using band-shifting panchromatic images.
2. DATA AND METHOD
2.1 Data
This study used hyperspectral data from the Airborne Visible/Infrared Imaging Spectrometer (AVIRIS). AVIRIS measures the solar reflected spectrum from 400 to 2500 nm
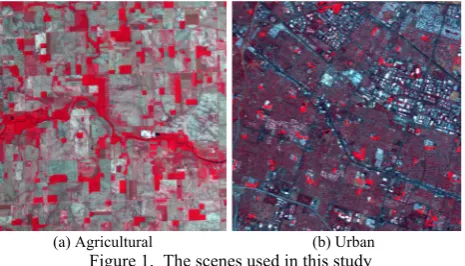
through 224 contiguous spectral channels at 10-nm intervals across the spectrum (Green et al., 1998). Two scenes of free standard data products were downloaded from the AVIRIS website: “Low Altitude” (f960705t01p02r02) and “Moffett Field” (f080611t01p00r07) (AVIRIS, 2011). Agricultural and urban areas were clipped from each product to an image size of 512 × 512 pixels (Figure 1). As both datasets record the spectral radiance in 16 bits, the data were converted to 8 bits in response to each data range. That is, the ranges of radiance from 0.840 to 6.786 (µW/cm2·nm·sr) in agricultural areas and from 1.846 to 14.388 in urban areas were scaled to a range from 1 to 255 of 8 bits data, respectively. This scaling was applied identically to all bands within the scene.
2.2 Analysis Flow
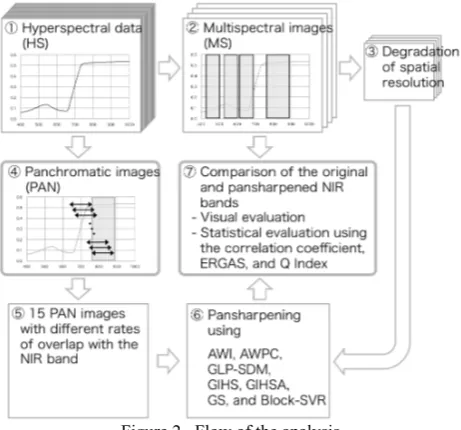
Multispectral (MS) and panchromatic (PAN) images generated from hyperspectral (HS) data were used for pansharpening. A MS image has a single set of bands with fixed spectral responses. By contrast, PAN images are generated with different spectral waveband to evaluate their influence on the spectral characteristics of MS images. The pansharpened near-infrared (NIR) band, which was generated from spatially degraded (lower resolution) MS image, was the compared with original (higher resolution) MS image. The analysis flow, shown in Figure 2, included the following steps.
Generation of multispectral image: Four bands of MS image were generated by spectral averaging of HS data. The wavelengths of the bands correspond to those of the Advanced Visible and Near Infrared Radiometer type 2 (AVNIR-2) onboard the Advanced Land Observing Satellite (ALOS) (EORC/JAXA, 2012). AVNIR-2 has four bands at red (420– 500 nm), green (520–600), blue (610–690), and NIR (760–890) wavelengths. Eight images from bands 7 to 14 of AVIRIS were simply averaged to produce band 1 of AVNIR-2. Bands 17 to 25, 27 to 36, and 44 to 57 of AVIRIS were averaged in order to produce bands 2, 3, and 4 of AVNIR-2, respectively.
Degradation of spatial resolution: Spatially degraded MS images were derived by averaging 4 × 4 pixels. As the original size was 512 × 512, the size of the degraded image was 128 ×
128 pixels. This degraded MS was used in order to generate pansharpened image that has same image size as the original (512 × 512).
Generation of panchromatic images: Fifteen PAN images with a variety of spectral band position were produced by averaging of shifting band set of AVIRIS. Band position was based on the NIR band of MS. Since NIR band is derived from the average of 14 bands from bands 44 to 57 of AVIRIS, 15 types of PAN image were produced with different degrees of overlap from 0% (0/14) to 100% (14/14) by shifting the band selection to shorter wavelengths. That is, the 0% overlap PAN image was produced using bands 28 to 43, and the 100% overlap was produced by averaging bands 44 to 57. In this process, bands 31 and 32 were excluded because these have large overlaps with bands 33 and 34, respectively.
Pansharpening: Seven pansharpening methods were performed using degraded MS images and each PAN image. The methods are explained in the next subsection.
Comparison of the pansharpened and original NIR bands: The spectral characteristics of pansharpened NIR bands, which are derived using each of 15 PAN images, were compared with the original (non-degraded) NIR band. A qualitative evaluation
was made by visual comparison, and a quantitative assessment was implemented using three statistical indices: the correlation coefficient, erreur relative globale adimensionnelle de synthèse (ERGAS), and Q index. The details of these indices are explained in subsection 2.4. The central 480 × 480 pixel region was used in this evaluation because some methods are not applied in the fringe of an image owing to block- or pixel-based regressions.
Figure 2. Flow of the analysis
2.3 Pansharpening Methods
Seven pixel-based pansharpening methods were used in this study: three multi-resolution analysis-based, three component-substitution, and one modulation-based fusion techniques (Zhang, 2010).
Additive Wavelet Intensity (AWI) (Núñez et al., 1999, González-Audícana et al., 2005): The basic idea of this method is to insert the spatial details of the PAN image into the intensity component of the multispectral image that gathers most of its spatial, instead of replacing this component with the whole PAN image as in the intensity-hue-saturation (IHS) transformation pansharpening method (González-Audícana et al., 2005). The processing steps used here are as follows: (1) The IHS transform is applied to the red-green-blue (RGB)
composition of the MS image that is resampled to the same spatial resolution as the PAN image by bilinear
interpolation.
(2) The PAN image is histogram matched to the intensity image.
(3) The ‘à trous’ discrete wavelet transform is applied to the histogram-matched PAN image to derive the first and second wavelet planes.
(4) These wavelet planes are added to the intensity image. (5) The inverse IHS transform is applied to derive the
AWI, except that it uses the first principal component derived by principal component analysis using four bands instead of the intensity component of the IHS transform.
Generalized Laplacian Pyramid with Spectral Distortion Minimization (GLP-SDM) (Aiazzi et al., 2002a, 2002b, 2005): The method combines the generalized Laplacian pyramid, one method of multi-resolution analysis, and the detail injection model of spectral distortion minimizing. Spatial detail is extracted from the difference between the original and smoothed PAN images and it is added to the expanded MS image using a weighting factor derived from the ratio of the PAN and MS images. For computational simplification, the simplest three-taps pyramid-generating low-pass filter (i.e., bilinear interpolation) and a cascade of two reduction steps were adopted.
Generalized Intensity-Hue-Saturation transform (GIHS) (Tu et al., 2004): GIHS is an expansion of fast IHS fusion methods to more than three channels of color images, and the intensity component is derived as the linear sum of each band with a set of weighting coefficients. The difference between the PAN and intensity component is added to each band of the MS image to improve the spatial resolution.
GIHS Adaptive (GIHSA) (Tu et al., 2004, Aiazzi et al., 2007): This method is almost the same as the GHIS, but weighting coefficients are determined by scenes based on a linear regression of the PAN image by the MS bands.
Gram–Schmidt Spectral Sharpening (GS) (Laben et al., 2000, Aiazzi et al., 2007): The method utilizes Gram–Schmidt
(2) The modified Gram–Schmidt transformation is performed on the resulting PAN image together with the MS image. The lower spatial resolution PAN image is used as the first band in the GS transformation.
(3) The statistics of the original PAN image are adjusted to match the statistics of the first transform band of the GS transformation.
(4) The statistically adjusted high resolution PAN image is substituted for the first transform band to produce a new set of bands.
(5) The inverse GS transformation is performed on the new set of bands to produce the pansharpened MS image.
Block-based Synthetic Variable Ratio (Block-SVR) (Zhang et al., 2010): This technique is based on multiple linear regression of a block (i.e., a square region of pixels) to fuse the images. Multiplying the ratio of the original and synthesized PAN images, which is derived by multiple regression of the PAN image by MS bands, gives the pansharpened MS bands. Whereas the original SVR performs multiple regressions on an image basis, i.e., all pixels of the image are used to derive a single set of coefficients, it is modified to block-based regression here. The processing steps are as follows:
(1) The low-resolution MS image is resampled (expanded) to the same size as the PAN image.
(2) Central and neighboring blocks (in total, N × N blocks) are fetched from the MS and PAN images in sequence. (3) Multiple linear parameters are calculated through multiple
linear regression of the pixels in the blocks.
(4) The pixels in the central block are pansharpened using the
In the qualitative evaluations, the pansharpened results were compared to the original NIR image visually and by using scatterplots of the digital numbers of the images. Statistical evaluations were performed using three frequently used statistics (e.g., Alparone et al., 2004; González-Audícana et al., 2004; Otazu et al., 2005; Cetin and Musaoglu, 2009): the correlation coefficient, ERGAS (relative global dimensional synthesis error) (Wald, 2000), and Q index (Wang and Bovik, 2002). ERGAS, given in equation 1, has lower values for better quality. Wald (2000) stated that a good quality is achieved when the index is less than 3.
,
(1)
where h = the spatial resolution of the PAN image l = the spatial resolution of the MS image N = the number of spectral bands (Bi) Mi = the mean of each spectral band
RMSE = root mean square error between each band of the original and pansharpened images
The Q index (equation 2) models the difference between two images as a combination of three different factors: loss of correlation, luminance distortion, and contrast distortion (Otazu et al., 2005). Q ranges from –1 to 1, and higher values indicate better quality. Q indices are generally calculated using a sliding window approach; a window size of 128 × 128 was applied here.
,
(a) AWI
(b) AWPC
(c) GLP-SDM
(d) GIHS
(e) GIHSA
(f) GS
(g) Block-SVR
Figure 3. Pansharpened band 4 in an agricultural area using 0% (left), 50% (center), and100 % (right) overlapping PAN images
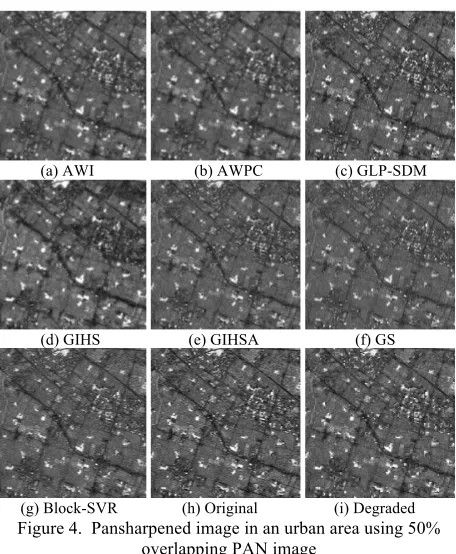
Pansharpened images of an urban area using 50% overlapped PAN images are shown in Figure 4, together with the original and spatially degraded NIR band (the brightness of the image is enhanced linearly to the same level because the original result was too dark to show). AWI and AWPC were less sharp, especially in the region of small buildings and narrow roads.
GIHS also resulted in insufficient improvement of the sharpness, and blurring was noted along the edges of dark roads and bright buildings. GLP-SDM and GIHSA produced results similar to the original in terms of both spatial detail and image brightness. GS showed similar spatial contrast, but relatively lower brightness.
(a) AWI (b) AWPC (c) GLP-SDM
(d) GIHS (e) GIHSA (f) GS
(g) Block-SVR (h) Original (i) Degraded Figure 4. Pansharpened image in an urban area using 50%
overlapping PAN image
Figure 5 shows scatterplots of the digital numbers of the pansharpened and original NIR band, along with different overlap rates of 0, 50, and 100%. AWPC and GIHS have larger variances, even in the case of 100% overlap, followed by AWI. The main reason for this variation is thought to be the propagation of spectral features from other bands because these methods implement linear transformation using all bands, and this injected dissimilar spectral characteristics into the NIR band. In the agricultural area using GIHS, the gradient of the plot is much larger than unity owing to the excessive enhancement and saturation of brightness. GLP-SDM and GS showed an extremely high correlation at 100% overlap, i.e., higher compatibility of images, although the gradient of GS is not unity (i.e., the one-to-one line).
3.2 Statistical Comparison
Figure 6 shows the changes in the correlation coefficient (CC), ERGAS, and Q index of the NIR band with the rate of overlap of the PAN and NIR images. GLP-SDM and GS reached CC = 1.0 at 100% overlap, followed by GIHSA and Block-SVR. AWI had the lowest CC (~0.8) with 100% overlap. GIHS showed a peak in the CC at around 30% overlap. All of the methods gave CC ≈ 0.8, even with 0% overlap. In this case, GS had a relatively higher CC.
methods had similar ERGAS values around 3 and 8 in agricultural and urban areas, respectively, with 0% overlap.
The Q index showed characteristics similar to the correlation coefficient. This is because Q is rewritten equivalently as a product of the correlation coefficient, a factor representing the bias in the mean of two images, and a factor accounting for changes in contrast between images (Alparone et al., 2004).
(a) AWI
(b) AWPC
(c) GLP-SDM
(d) GIHS
(e) GIHSA
(f) GS
(g) Block-SVR
Figure 5. Scatterplots of the original (horizontal) and pansharpened (vertical) NIR band in agricultural (left) and
urban (right) areas
The respective values of GLP-SDM and GIHSA were 1.00 and over 0.99 in both areas. In GLP-SDM, pansharpening is performed on a band-by-band basis, and the difference of contrast between the PAN image and degraded NIR image was eliminated in the process of down sampling and up sampling. One additional reason for this elimination is the three-taps pyramid-generating low-pass filter (bi-linear interpolation) used in this study. This resulted in the reproduction an NIR image that was almost the same as the PAN image. In GIHSA, the intensity component is calculated using multiple linear regression of PAN by MS; hence, the intensity was computed only from the NIR band, i.e., the regression coefficients of the other three bands were almost 0. In another method, both the NIR and other bands affect the pansharpening process. Therefore, the indices had relatively lower scores, even with 100% overlap.
(a) Correlation coefficient
(b) ERGAS
(c) Q index [128 × 128]
Figure 6. Correlation coefficient, ERGAS, and Q index of the NIR band for different rates of overlap of the PAN image
4. CONCLUSIONS
using simulated images derived from hyperspectral data. Visual assessment indicated that the quality of the pansharpened image was highly dependent not only on the pansharpening method but also on the spectral characteristics of the PAN image. Even using one method, quite different image qualities were generated according to the wavelength of the PAN image. The statistical evaluation showed that all of the methods had similar scores in the case of 0% overlap, i.e., lower similarity of the PAN and NIR bands of the MS image, but the variation in the scores increased with the spectral overlap. This was mainly the consequence of the difference in the mechanism of pansharpening adopted by each method. Further studies should examine other bands and other wavelengths of PAN and MS images. The results will help to characterize the pansharpening methods, develop or improve the methods, and design the spectral specifications of new sensors.
Acknowledgements
The author thanks NASA JPL for providing the AVIRIS data. This work was supported by KAKENHI (23380143, 22710011).
References
Aiazzi. B., Alparone, L., Baronti, S., and Garzelli, A., 2002a. Context-driven fusion of high spatial and spectral resolution images based on oversampled multiresolution analysis. IEEE Geoscience and Remote Sensing Letters, 40(10), pp. 2300-2312.
Aiazzi, B., Alparone, L., Baronti, S., Pippi, I., and Selva, M., 2002b. Generalized Laplacian Pyramid-Based Fusion of MS + P Image Data with Spectral Distortion Minimization, ISPRS Commission III, Symposium.
http://www.isprs.org/proceedings/XXXIV/part3/papers/paper08 3.pdf (24 Jun. 2011).
Aiazzi, B., Baronti, S., Garzelli, A., Santurri, L., and Selva, M., 2005. Spatial Enhancement of TIR ASTER data via VNIR images and Generalized Laplacian Decomposition. Proceedings of 4th EARSeL Workshop on Imaging Spectroscopy, pp. 489-500.
http://www.earsel.org/workshops/IS_Warsaw_2005/papers/Met hods_Data_Processing/52_Aiazzi_489_500.pdf (10 Jul. 2011).
Aiazzi, B., Baronti, S., and Selva, M., 2007. Improving Component Substitution Pansharpening Through Multivariate Regression of MS+Pan Data. IEEE Transactions on Geoscience and Remote Sensing, 45(10), pp. 3230-3239.
Alparone, L., Baronti, S., Garzelli, A., and Nencini, F., 2004. A global quality measurement of pan-sharpened multispectral imagery. IEEE Geoscience and Remote Sensing Letters, 1(4), pp. 313-317.
AVIRIS website, 2011. http://aviris.jpl.nasa.gov/index.html (15 Oct. 2011).
Cetin, M., and Musaoglu, N., 2009. Merging hyperspectral and panchromatic image data: qualitative and quantitative analysis. International Journal of Remote Sensing, 30(7), pp. 1779-1804.
EORC/JAXA (Earth Observation Research Center, Japan Aerospace Exploration Agency), 2012. Advanced Land Observing Satellite (ALOS) website.
http://www.eorc.jaxa.jp/ALOS/en/index.htm (3 Jan. 2012).
González-Audícana, M., Saleta, J. L., Catalán, R. G., and García, R., 2004. Fusion of multispectral and panchromatic images using improved IHS and PCA mergers based on wavelet
decomposition. IEEE Transactions on Geoscience and Remote Sensing, 42(6), pp. 1291-1299.
González-Audícana, M., Otazu, X., Fors, O., and Seco, A., 2005. Comparison between Mallat's and the ‘à trous’ discrete wavelet transform based algorithms for the fusion of multispectral and panchromatic images. International Journal of Remote Sensing, 26(3), pp. 595-614.
Green R. O., Eastwood, M. L., Sarture, C. M., Chrien, T. G., Aronson, M., Chipperndale, B. J., Faust, J. A., Pavri, B. E., Chovit, C. J., Solis, M., Olah, M. R., and Williams, O., 1998. Imaging spectroscopy and the Airborne Visible/Infrared Imaging Spectrometer (AVIRIS). Remote Sensing of Environment, 65, pp. 227-248.
Laben, C. A., Brower, B. V., 2000. Process for enhancing the spatial resolution of multispectral imagery using pan-sharpening. United States Patent No. 6011875.
Matsunaga, T., Yamamoto, S., Kashimura, O., Tachikawa, T., Ogawa, K., Iwasaki, A., Tsuchida S., and N. Ohgi, 2011. Operation plan study for Japanese future hyperspectral mission: HISUI. Proceedings in 34th International Symposium on Remote Sensing of Environment, Sydney, Australia.
http://www.isprs.org/proceedings/2011/ISRSE-34/211104015Final00771.pdf (3 Jan. 2012).
Núñez, J., Otazu, X., Fors, O., Prades, A., Palà, V., and Arbiol, R., 1999. Multiresolution-based image fusion with additive wavelet decomposition. IEEE Transactions on Geoscience and Remote Sensing, 37(3), pp. 1204-1211.
Otazu, X., González-Audícana, M., Fors, O., and Núñez, J., 2005. Introduction of sensor spectral response into image fusion methods. Application to wavelet-based methods. IEEE Transactions on Geoscience and Remote Sensing, 43(10), pp. 2376-2385.
Smith A. R., 1978. Color Gamut Transform Pairs. SIGGRAPH 78 Conference Proceedings, pp. 12-19.
http://alvyray.com/Papers/CG/color78.pdf (6 Jul. 2011).
Tu. T-M., Huang, P. S., Hung, C-L., and Chang, C-P., 2004. A fast intensity-hue-saturation fusion technique with spectral adjustment for IKONOS imagery. IEEE Geoscience and Remote Sensing Letters, 1(4), pp. 309-312.
Wald, L., 2000. Quality of high resolution synthesised images: is there a simple criterion? Proceedings of the third conference "Fusion of Earth data: merging point measures, raster maps and remotely sensed images", Sopia Antipolis, France, pp. 26-28. http://www.scep.ensmp.fr/Public/themes_de_recherche/teledete ction/title_tele_fusion/ergas_-_wald_2000 (20 Nov. 2011).
Wang, Z., and Bovik, A. C., 2002. A universal image quality index. IEEE Signal Processing Letters, 9, pp. 81-84.
Zhang, J., 2010. Multi-source remote sensing data fusion: status and trends. International Journal of Image and Data Fusion, 1(1), pp. 5-24.
Zhang, J., Yang, J., Zhao, Z., Li, H., and Zhang, Y., 2010. Block-regression based fusion of optical and SAR imagery for feature enhancement. International Journal of Remote Sensing, 31(9), pp. 2325-2345.