LANDSAT 8 MULTISPECTRAL AND PANSHARPENED IMAGERY PROCESSING ON
THE STUDY OF CIVIL ENGINEERING ISSUES
M. A. Lazaridou a, A. Ch. Karagianni a * a
Lab. Of Photogrammetry – Remote Sesning, Dept. of Civil Engineering, Aristotle University of Thessaloniki, Greece [email protected], [email protected]
Commission VIII, WG VIII/8
KEY WORDS: Landsat 8, pansharpened, image interpretation, supervised classification, land cover
ABSTRACT:
Scientific and professional interests of civil engineering mainly include structures, hydraulics, geotechnical engineering, environment, and transportation issues. Topics included in the context of the above may concern urban environment issues, urban planning, hydrological modelling, study of hazards and road construction. Land cover information contributes significantly on the study of the above subjects. Land cover information can be acquired effectively by visual image interpretation of satellite imagery or after applying enhancement routines and also by imagery classification. The Landsat Data Continuity Mission (LDCM – Landsat 8) is the latest satellite in Landsat series, launched in February 2013. Landsat 8 medium spatial resolution multispectral imagery presents particular interest in extracting land cover, because of the fine spectral resolution, the radiometric quantization of 12bits, the capability of merging the high resolution panchromatic band of 15 meters with multispectral imagery of 30 meters as well as the policy of free data. In this paper, Landsat 8 multispectral and panchromatic imageries are being used, concerning surroundings of a lake in north-western Greece. Land cover information is extracted, using suitable digital image processing software. The rich spectral context of the multispectral image is combined with the high spatial resolution of the panchromatic image, applying image fusion – pansharpening, facilitating in this way visual image interpretation to delineate land cover. Further processing concerns supervised image classification. The classification of pansharpened image preceded multispectral image classification. Corresponding comparative considerations are also presented.
* Corresponding author
1. INTRODUCTION
The Department of Civil Engineering in the Aristotle University of Thessaloniki includes four divisions that correspond to the scientific and professional interests of a civil engineer. These divisions are: Structural Engineering, Hydraulics and Environmental Engineering, Geotechnical Engineering, Transport Infrastructure Management and Regional Planning.
Issues included in the context of the above divisions may concern urban environment issues, urban planning, regional planning, hydrological modelling, study of hazards, transportation planning and road construction.
Land cover information contributes significantly to the study of the above issues. We can effectively acquire land cover information by remote sensing and particularly by visual image interpretation of satellite imagery or after applying enhancement routines and also by imagery classification.
Landsat 8 medium spatial resolution multispectral imagery presents particular interest in extracting land cover, because of the fine spectral resolution, the radiometric quantization of 12bits, the capability of merging the high resolution panchromatic band of 15 meters with multispectral imagery of 30 meters as well as the policy of free data. In this paper,
Landsat 8 multispectral and panchromatic imageries are being used, concerning surroundings of a lake in north-western Greece. The rich spectral context of the multispectral image is combined with the high spatial resolution of the panchromatic image, applying image fusion – pansharpening and particularly Ehlers fusion. Further processing concerns supervised image classification. Corresponding comparative considerations are also presented in the discussion.
2. STUDY AREA AND SATELLITE DATA
2.1 Study area
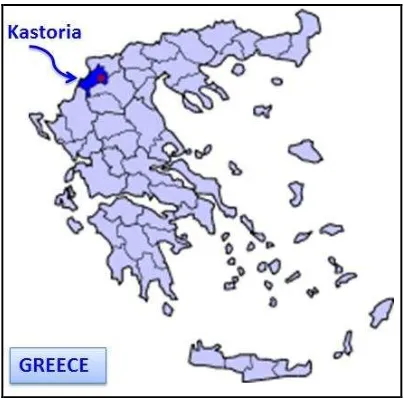
Study area is located in medium-high altitude (630m) in the north western part of Greece, region of Western Macedonia, Figure 1. It concerns the surroundings of the Lake Orestiada (or Lake of Kastoria) in north western Greece.
The lake has tectonic origin with carstic nature, an average depth of 4m and a maximum depth of 8m (Kousouris, 2014). It is an open urban lake that is discharged through a natural canal. Lake Orestiada is included in the Natura 2000 network.
Figure 1. Study area in the north western part of Greece
2.2 Satellite data
The used satellite data include Landsat 8 image data.
Landsat 8 was launched on February 11, 2013 and carries two instruments: The Operational Land Imager (OLI) sensor and the Thermal Infrared Sensor (TIRS). These sensors both provide improved signal-to-noise (SNR) radiometric performance quantized over a 12-bit dynamic range. (This translates into 4096 potential grey levels in an image compared with only 256 grey levels in previous 8-bit instruments). Improved signal to noise performance enable better characterization of land cover state and condition (http://landsat.usgs.gov/landsat8.php).
Landsat 8 satellite data consist of eleven spectral bands with a spatial resolution of 30 meters for Bands 1 to 7 and 9. The resolution for Band 8 (panchromatic) is 15 meters and for Bands 10, 11 is 100m.
The image data we used in this study was downloaded free of charge from U.S. Geological Survey 7, (path: 185, row: 32) http://earthexplorer.usgs.gov. They were acquired at 2014-03-14 with level processing 1T - Standard Terrain Correction (systematic radiometric and geometric accuracy) and projection information: UTM, zone 34, spheroid & datum WGS 84. The image is cloud-free and has excellent quality (image quality: 9).
3. DIGITAL IMAGE PROCESSING
Digital image processing was done with Erdas Imagine 2011 software (using its standard routines and the modeler module) and it concerned layerstacking of the downloaded data, subsetting the scene to the study area, Ehlers fusion and supervised image classification.
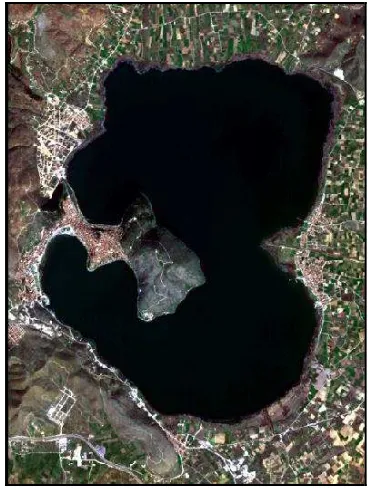
True colour composite image and panchromatic image of the study area are presented in Figure 2 and Figure 3, respectively.
The dominant features in the study site are: Lake Orestiada and the peninsula in its western part, where the city of Kastoria is located.
Figure 2. True colour composite of the study area
Figure 3. Panchromatic image of the study area
3.1 Ehlers fusion
Image fusion is the combination of two or more different images to form a new image by using a certain algorithm (Genderen and Pohl 1994). Image fusion methods can be differentiated into three levels: pixel level, feature level and klowledge or decision level (Ehlers et al, 2010). Pixel level fusion techniques are often used in remote sensing and particularly in image pansharpening (Zhang, 2004). These techniques may be based on arithmetic combinations (multiplicative, Brovey), component substitution (Principal Component Analysis - PCA, Intensity Hue Saturation – HIS, Gram Schmidt), Fourier Transform (Ehlers, High Pass Filtering Approach) and on Multi – Scale or Multi – Resolution techniques (Wavelet Transform) (Lasaponara et al, 2012).
In this paper, Ehlers fusion was used. This method is done with the following procedure. Intensity Hue Saturation (IHS) transformation is done in the multispectral image. Fast Fourier Transform (FFT) is applied in the component of Intensity (I) of the resulted image as well a low pass filter. Fast Fourier Transform is also applied in the panchromatic image followed by high pass filtering. In these filtered images inverse FFT is applied and the results are added. Finally an inverse HIS transformation is applied to produce a fused RGB image. The procedure can be repeated with successive three band selections until all bands are fused with the panchromatic image (Ehlers, 2010).
The resulted fused – pansharpened image is presented in Figure 4. The evaluation of the pansharpened image was done using visual analysis and statistical measures, particularly correlation coefficient and high pass correlation coefficient.
Figure 4. Pansharpened image (True Colour Composite)
Visual analysis of the pansharpened image shows that visual changes in colour do not appear compared to the multispectral image. The improved structure is clearly visible. The spectral characteristics of the original image are preserved and the spatial improvement is evident, particularly in the built up areas and the cultivations.
However, we must mention that visual analysis is subjective, depending on the interpreter.
The spectral value preservation was evaluated with the correlation coefficient between the bands of the multispectral image and the corresponding bands of the pansharpened image. Values for the correlation coefficient range from -1 to +1. The best correspondence between the two images should be close to +1.
The results are presented in Table 1, indicatively for bands 2,3,4,5.
Table 1. Correlation coefficients between the corresponding multispectral and pansharpened images (indicatively for bands 2,3,4,5)
The spatial improvement was evaluated with the calculation of the high pass correlation coefficient (Zhou et al, 1998). A high pass filter (3x3) was applied to the panchromatic image and to each band of the pansharpened image.
The calculation of the correlation coefficients between the filtered bands of the pansharpened image and the filtered panchromatic image followed, resulting in Table 2, indicatively for bands 2,3,4,5.
Table 2. High pass correlation coefficients (indicatively for bands 2,3,4,5)
The average value for the coefficient values for the 4 bands that are indicatively presented is 0.937. The correlation coefficients after high pass filtering produced an average value of 0.900.
3.2 Supervised image classification
The object of image classification is the categorization of all pixels of an image into land cover classes (Lillesand et al, 1987).
Particularly in supervised classification, the user “supervises” the pixel categorization by selecting sample pixels representative of specific classes and afterwards with the suitable image processing software uses these training sites for the classification of all the pixels of the image.
The selection of training sites is done on the base of user΄s prior knowledge about the area. Maximum Likelihood Classification (MLC) is a common used supervised classification for Landsat imageries and it was the classification we applied in this paper.
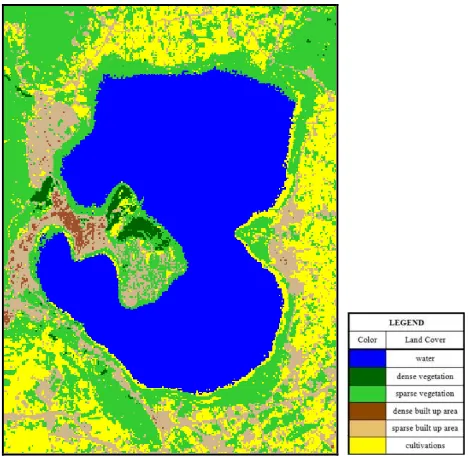
The classification scheme included 6 classes: water, dense vegetation, sparse vegetation, dense built up areas, sparse built up areas and cultivations. Fifteen training sites were used for each class.
At first the pansharpened image was classified because of the easier identification of the landscape characteristics. The classification of the multispectral image followed. The training sites were chosen in corresponding areas with those used in the pansharpened image. The results are presented in Figure 5 and Figure 6.
An accuracy assessment of the two classified images was done by generating random points equally distributed per class and matching land cover with ancillary data. The results are presented in Table 3, Table 4 and Table 5.
Figure 5. Pansharpened image classification
Figure 6. Multispectral image classification
Table 3. Accuracy assessment of the pansharpened image classification
Table 4. Accuracy assessment of the multispectral image classification
Table 5. Overall classification accuracy and overall kappa statistics
4. DISCUSSION – CONCLUSIONS
Land cover information contributes significantly on the study of urban and regional planning, hydrological modelling, study of hazards, transportation planning, road construction and other issues that are related to civil engineering.
The acquisition of land cover information can be effectively done with remote sensing methods and techniques.
Landsat 8 satellite imageries present particular interest in extracting land cover, mainly because of the fine spectral resolution and the capability of merging the high spatial resolution panchromatic band with multispectral imagery.
In this paper Landsat 8 multispectral and panchromatic imageries were used concerning the surroundings of a lake in north-western Greece.
In order to combine the rich spectral context of the multispectral image with the high spatial resolution of the panchromatic image, Ehlers fusion was applied. The pansharpened image was effectively evaluated visually, as well as using statistical measures. It can be photointerpreted easier than the original and the preservation of the spectral characteristics of the multispectral image makes it suitable for image classification.
Land cover delineation was carried out with supervised image classification of the pansharpened image and the original multispectral image. Overall classification accuracy and kappa statistics are higher for the pansharpened image classification.
In conclusion concerning the study site of this paper, Ehlers fusion can be effectively used for Landsat 8 image pansharpening and furthermore the pansharpened image can be satisfactorily classified to delineate land cover. This procedure may offer a useful tool for monitoring land cover and land cover changes, in areas that are associated with civil engineering interest.
REFERENCES
Ehlers, M., Klonus, S., Åstrand, P.J., Rosso P., 2010. Multi-sensor image fusion for pansharpening in remote sensing. International Journal of Image and Data Fusion 1:1, pp. 25-45.
Genderen, J. L. van, and Pohl, C., 1994. Image fusion: Issues, techniques and applications. In: Proceedings EARSel Workshop Intelligent Image Fusion, edited by J. L. van Genderen and V. Cappellini (Enschede, ITC), pp. 18- 26.
Kousouris, Th., 2014. The Lakes in Greece: 3/6 Macedonia . EKKE, Athens, pp. 62-64.
Landsat 8 websites: http://landsat.usgs.gov/landsat8.php http://earthexplorer.usgs.gov (last accessed at March 2016)
Lasaponara, R., Masini, N., 2012. Satellite Remote Sensing, A New Tool for Archaeology, Remote Sensing and Digital Image Processing, Vol. 16, Chapter 4, Springer, pp. 87-109.
Lillesand, T. M., Kiefer, R. W., 1987. Remote Sensing and Image Interpretation. John Wiley & Sons, Inc., pp. 668-669.
Zhang, Y., 2004. Understanding Image Fusion. Photogrammetric Engineering and Remote Sensing, Vol. 70, No 6, pp. 657-661.
Zhou, J., Civco, D.L., and Silander, J.A., 1998. A wavelet transform method to merge Landsat TM and SPOT panchromatic data. International Journal of Remote Sensing, 19 (4), pp. 743-757.