TRENDS AND DETERMINANTS OF
THE GEOGRAPHICAL DISTRIBUTION OF ECONOMIC ACTIVITIES: EVIDENCE FROM INDONESIAN MANUFACTURING
Khoirunurrofik*
Institute for Economic and Social Research (LPEM) and Department of Economics, University of Indonesia, Indonesia
ABSTRACT
This study analyzes the trends and determinant factors of vis-à-vis spatial distribution in Indonesian manufacturing during the period of 1990–2010. There is a long-term increasing trend of regional specialization driven by core regions in Java Island and by affluent regions outside of Java Island. Among resource-based and labor-intensive industries, there is a smooth declining trend of geographical concentration. An increasing trend in regional specialization and geographical concentration during the economic crisis is identified turns into a decreasing trend at the onset of setting up a decentralization policy and then pushed upward again. Finally, by applying spatially weighted Ellison-Glaeser (EG) Index, it is found that labor skills, export activities, and wage rates strongly determine the degree of agglomeration among Indonesian manufacturing industries.
Keywords: agglomeration, decentralization, regional specialization, geographical concentration, global economy.
JELClassification: R11, R12
INTRODUCTION
As the world’s biggest archipelago and the fourth most heavily populated country in the world, Indonesia—with a population exceeding 237 million across 33 provinces—has experienced a developmental divide due to inequality among its regions.1 The fact is the population and economic activities are concentrated in Java Island and the surrounding areas, even after establishing a decentralization policy. For instance, the manufacturing sector has traditionally been concentrated in West Indonesia, particularly in Java Island. As a result, manufacturing firms tend to be located in Java Island. As part of strengthen the democratization, a policy was introduced in 2001 that sought to boost the
*Corresponding e-mail: [email protected]
1
These data are from and are taken from )ndonesia’s Central of Bureau Statistics
http://webbeta.bps.go.id/tab_sub/view.php?kat=1&tabel=1&daftar=1&id_subyek=12¬ab=1
19
attractiveness of local government, build a new economic center, and invite new firms and new workers to agglomerate in those other regions.
Since in the middle of 1960s, Indonesia has adopted an industrialization policy and positioned the manufacturing industry as being the most important sector for the Indonesian economics (Aswicahyono et al., 2010). However, the high concentration of manufacturing firms in Java Island characterized Java Island as a dominant province, and they remain a concern with regard to economic disparity. Accordingly, external shock that relates to economic distribution is decentralization policy which seeks to foster regional competition and determine geographical concentration.
The decentralization policy is one way to promote long-term economic growth, based on the view that leads to better resources allocation and more productive and possibly smaller public sector (Oates, 1993). It is thought that an increase in transfers of economic activities from the center of Java Island to other regions tends to increase the ability of those regions to improve the public goods provision locally, and this thinking affects firms’ decisions on siting new facilities. Theoretically, fiscal decentralization as part of a decentralization policy can induce agglomeration economics both directly to lower tax competition as suggested by Tiebout (1956) and indirectly through public goods provision. Therefore, it is also important to examine the effect of a decentralization policy on the geographical concentration of economic activities.
To the best of our knowledge, study on regional specialization patterns and industrial concentration in the context of developing countries is scarce, except in China.2 Studies on industrial concentrations in Indonesia tend to focus on concentration trends and fail to consider the locations of plants (e.g., Bird, 1999). Sjöberg and Sjöholm (2004) examined that the spatial concentration of the manufacturing sector in Indonesia between 1986 and 1996, and they underlined its relationship to trade liberalization policy. However, the time has been passed, and their findings may not reflect the current conditions: there have been marked changes since then, particularly after the 1997–1998 period, the economic crisis and the implementation of regional autonomy since 2001.
The objectives of this study are to describe the distribution of economic activities by looking at the trends in regional specialization and geographical concentration,
20
emphasizing how the economic crisis and decentralization policy changed the pattern and to examine the determinant factors of the industry’s spatial concentration. This study contributes to the literature by documenting the long-term regional specialization and concentration trends of the Indonesian manufacturing industry from 1990 to 2010. We also introduce the use of weighted Ellison-Glaeser (EG) Index proposed by Guimarães et al. (2011) in an empirical modeling of geographical concentration to account for neighboring agglomeration effects. In particular, we evaluate the changes that occurred in tandem with the external shocks of the 1997–1998 Asian financial crisis and the implementation of decentralization policy.
This study determines the spatial distribution of the economic activities of the Indonesian manufacturing industry by measuring the regional specialization index (RSI), as originally proposed by Krugman (1991b), and the spatial Ellison-Glaeser index is originally developed by Ellison and Glaeser (1997) and extended by Guimarães et al. (2011)—to account for neighboring effects. With spatial trends in hand, then we investigate whether economies of scale, resources, international trade activities, labor skills and wage rate can show the changes in geographical concentration.
21
This study is done by several sections. The first section provides a brief overview of the importance and unique nature of this study. The second section surveys the related literature. In the third section, the empirical model used is presented, including information on the data and variable construction. Analyses and the results are presented in the fourth section and the final section provides the concluding remarks.
LITERATURE REVIEW
The importance of geographical and location characteristics as a key determinants of production structure and trade is pinpointed by Fujita et al. (1999) and Krugman (1991a, 1991b). They attribute the spatial concentration of economic activity to natural advantages and spillover. Krugman (1991b) developed a model to explain how firms concentrate in a specific location.
To study the spatial distribution of economic activities, we start by distinguishing the specialization from the concentration. We define the specialization in this study as the relative position of each city over the rest of the country. On the other hand, we define concentration as the distribution of a particular sector of the two-digit SICs across cities within the country. In a broader view, we see that agglomeration as a group of many industrial clusters or spatial concentration of many sectors in a particular city.3 By understanding the distinction, these three definitions will help us to look at how economic activities are spatially distributed. Brakman et al. (2009) illustrated and explained in detail the differences among concentration, specialization, and agglomeration. They suggested that concentration and agglomeration are similar and distinct from specialization. They argued that concentration and agglomeration are similar in that they both related to how a specific economic activity takes place across locations. However, while agglomeration captures a broader set of aspects across industries within a sector, concentration tends to relate to a particular industry type. On the other hand, they assert that specialization focuses on how one can study countries or a regional economic structure by looking at a particular spatial unit across industries or sectors.
3
22
The first study to discuss long-term trends in regional specialization and the economics location within the context of manufacturing is explained by Kim (1995), for the case of the United States. He distinguished between specialization and localization/concentration as follows: specialization is important when one looks at the development of the regional manufacturing structure across industries, while localization or concentration is important when one looks at the development of each industry across region. Kim (1995) argued that regional specialization can bestow comparative advantages on a particular region. Furthermore, he noted that a higher level of regional specialization implies the region that has greater advantages in terms of economics scale in production. (e used Krugman’s (1991) RSI to compare relative regional specialization among nine census regions. He concluded that the degree of regional specialization among U.S. manufacturing industries increased until World War I, but then slightly declined thereafter, until the end of the study period.
Unlike Kim’s 99 study which makes use of (oover’s localization index, the current study employs the geographical concentration index proposed by Ellison and Glaeser (1997; hereafter, EG index) and an extension of the spatially weighted EG index developed by Guimarães et al. (2011; hereafter, EGS index) to measure localization or concentration. The EG index first proposed is the measurement of the geographical concentration of economic activity; it distinguishes between two agglomerative forces namely, natural advantage and spillover while controlling for industrial location. By providing empirical evidence that differentiates pure geographical forces and economic determinants, Ellison and Glaeser argued that geographical concentration stems not only from industrial concentration, but also from natural advantages inherent to area characteristics (e.g., natural resources and closeness to market) and locational spillover (e.g., input sharing, labor pooling, and knowledge sharing). They also asserted that the index can control the effects of internal economics scale or large plant size. They demonstrated evidence of the industrial localization of U.S. manufacturing industries at the four-digit SIC level and also demonstrate that in industries with strong upstream-downstream linkages, localization stems from natural advantages and co-agglomeration.
23
employment data from 2000. They found a positive and statistically significant relationship between industrial agglomeration and those micro determinants. Furthermore, Devereux et al. (2004) found geographical concentration mostly among low-tech industries in the United Kingdom, while Braunerhjelm and Borgman’s
study identified high geographical concentrations among Swedish industries, which they attribute to knowledge-intensive manufacturing industries and the intensive use of raw materials.
In the context of developing countries, a large body of study on geographical concentration relates in China (e.g., Ge, 2009; He et al., 2008; Lu and Tao, 2009). He et al. (2008) found that during 1980–2003, Chinese industries were geographically more heavily concentrated; this was particularly the case for the least-protected industries (e.g., rubber, chemical, education, and sporting goods). They also asserted that industries with stronger connections in foreign markets as part of the globalization process were more heavily concentrated, particularly in coastal regions. These findings agreed with those of Ge (2009), who asserted that export-oriented and foreign-invested industries have a higher degree of agglomeration than others and tend to cluster in regions accessible to foreign markets (e.g., close to airports). Furthermore, local protections related to the decentralization policy stymied geographical concentration or industrial specialization (He et al., 2008; Lu and Tao, 2009).
24
thought to be the best choice in examining the geographical location of plants, as it precludes the need for data that pertains to the specific location of a plant. The data that are generally not available in most countries (including Indonesia). Therefore, to account for economic activity in neighboring regions, we adopt the spatially weighted EGS index. This index precludes MAUP and deals with economic clustering that occurs across borders (Guimarães et al., 2011).
EMPIRICAL METHODS
Data and Measurement
This study analyzed data from the Statistik Industri, an unpublished electronic dataset captured through an annual survey of large and medium sized firms conducted by )ndonesia’s Central Bureau of Statistics BPS between 99 and ; the firms were classified in terms of two or three digit SIC codes4. All values in this study were expressed in 2000 real values5. We used the WPI published monthly in the BPS bulletin Statistik Bulanan Indikator Ekonomi. This study covered 66 industries at the three-digit SIC level and 23 sectors at the two digits SIC level6.
We defined the term city as the third administrative level of the )ndonesian government, originally known as a district or municipality. Therefore, for the sake of simplicity, the term city in this study refers to a district or municipality. Since the
4The study referred to the individual observations, which could be either a firm or an establishments (or plant), as the information did not distinguish between a standalone establishment and a firm with many establishments. In the analysis, we referred to both the term firm and establishment interchangeably, but one should consider it as the latter concept primarily.
5All values in a given year were expressed in 2000 constant prices. We used wholesale price
indices WP)s published monthly in BPS’s bulletin, StatistikBulananIndikatorEkonomi. We
compiled these data from the CEIC database and annual publication of Statistik Indonesia from BPS. We deflated output, value added, intermediate input, and materials using the manufacturing WPI in five-digit ISIC. Meanwhile, wage was deflated using a GDP deflator and a weighted price of oil for the industry sector was used to deflate the values of energy and electricity.
25
number of cities in Indonesia changed over the time, we referred to the 1990 configuration of 284 cities and 26 provinces (excluding Timor Leste) and considered any newly created districts as belonging to their original districts (cities).
The document regional specialization and concentration trends within the Indonesian manufacturing industry from 1990 to 2010, we first measured specialization as per Kim (1995) to examined the pattern of local economic structure, by calculating Krugman’s RS). Next, we measured geographical concentration in line with the work of Ellison and Glaeser (1997) and Guimarães et al. (2011) to calculate the EG index and EGS index, respectively. We followed Sjöberg and Sjöholm (2004) to measure those indices by using employment and value-added data. This approach was important as it provided a better perspective in analyzing and comparing a variety of industries that might be influenced by input factors. Sjöberg and Sjöholm (2004) argued that employment data tend to bias toward labor intensive industries, while value-added data tend to bias toward capital intensive industries.
We measured the regional specialization index to compare each city’s industrial structure with the rest of the country. From the Krugman Specialization Index, we obtained the RS) for each city by calculating the share of industry in the city’s total employment or value added. Then we calculated the same industry in other cities and took the difference between share of city with other cities’ share. After taking the absolute values of these differences, we summed over all industries to get the RSI for each city. The RSI is formulated as follows:
(1) Where is the level of employment in industry i = ,….,N for region j, and is the total industry employment in region j (and similarly for region k). If the index value equals to 0, then the two regions j and k are completely de-specialized. If the index value equals to 2, the regions are completely specialized (Combes and Overman, 2004; Kim, 1995).
We used the EG index to measure geographical concentration, given its ability to separate the sources of industrial agglomeration from natural advantages and spillover. The EG index is a function of raw geographical concentration (G) and the Herfindahl Index (H) of industry, which are defined as follows:
26
(3)
(4)
Where N is the number of plants and M is the number of regions. stands for the share of an industry’s total employment in region j, while denotes the fraction of aggregate employment in region j. refers to the share of plant p in industry employment. Ellison and Glaeser (1997) claimed that the use of the EG index can facilitate the comparisons across industries, across countries, or overtime. A positive or negative EG index value indicates the agglomeration or de-agglomeration process, respectively. If industry (i) is concentrated in some region, the EG index will have a positive value. However, when industry (i) is not concentrated in some region (j) and is uniformly scattered following a random location process, the EG index takes the value of 0. To overcome the limitation of the EG index as explained in the literature review above, we adopted the EGS index, which accounted for neighboring effects.
To capture regional externalities using a spatial-weights matrix, we followed Rodríguez-Pose et al. (2013) and defined the matrix of the neighboring spatial distance as follows:
(5)
Where denotes a distance threshold between the capitals of neighboring districts in which we assume regional externalities still appear. If the Euclidean distance from capital district j to capital district kis smaller than , then the spatial distance is equal to . Now, we have a distance matrix, we can calculate , the weighted neighbor distance matrix for region j with respect to neighbor k:
. (6)
27
capital provinces, in line with Rodríguez-Pose et al. (2013). Thus, we define EGS as follows:
(7) where:
(8)
Here, stands for spatially weighted G, and stands for the industry’s share of total employment in region k, while denotes the fraction of aggregate employment in region k. is a weighted neighbor distance matrix for region j with respect to neighbor k . EGSstands for spatially weighted EG.
Empirical Model for the Determinant of Geographical Concentration
To understand the determinants of geographical concentration, we followed Kim (1995) to estimate the impact of industrial characteristics, particularly the economics scale and resources, on geographical concentration in the following baseline equation:
(9) where the i subscripts = , …, indicate industries in thethree-digit SIC and t (=1990–2010) indicates the period of study.
28
dummies, that referred to our years of interest
( . We also looked at specific categories
of resource-based and labor-intensive industries using the dummies, and as per the OECD (1987) classification. Finally, stands for industry characteristics i, and denotes idiosyncratic errors.
We estimated the model using the OLS, random-effects (RE), fixed-effects (FE), and Hausman-Taylor models (HT). The Hausman and Sargan-Hansen test are applied to test the equality of the coefficient estimates from RE to those from FE, or from HT to those from FE. Sargan-Hansen has an advantage in its ability to incorporate robust cluster standard errors. Moreover, the Wald test is conducted to test heteroscedasticity.
RESULTS AND DISCUSSIONS
The Trend of Regional Specialization in Manufacturing
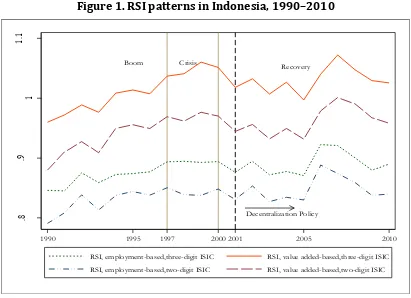
To evaluate the development of regional manufacturing structures, we begin by briefly summarizing the evidence pertaining to the regionalization trends (see figure1). The general trend is the RSI increased during the economic crisis and following the initiation of regional autonomy, although it tended to decline after 2006. From figure 1, we can see that regional specialization among industries at the three digits SIC level was higher than that among industries at the two digits SIC level; this implies that externalities may exist in narrower industries like those with four or five digits SIC codes, as suggested by Kim (1995). The recent decline in regional specialization in Indonesian manufacturing employment was likely due to increases in oil prices and an increase in the minimum wage. These two factors potentially push firms to diversify their product offerings.
29
Figure 1. RSI patterns in Indonesia, 1990–2010
Boom Crisis Recovery
Decentralization Policy
.8
.9
1
1.
1
1990 1995 1997 20002001 2005 2010
RSI, employment-based,three-digit ISIC RSI, value added-based,three-digit ISIC
RSI, employment-based,two-digit ISIC RSI, value added-based,two-digit ISIC
30
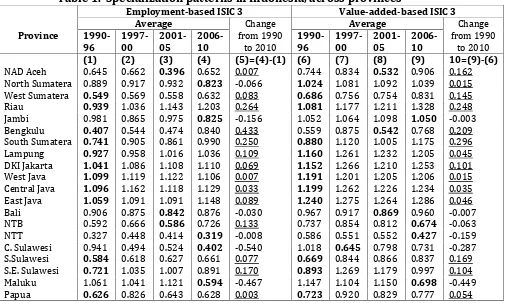
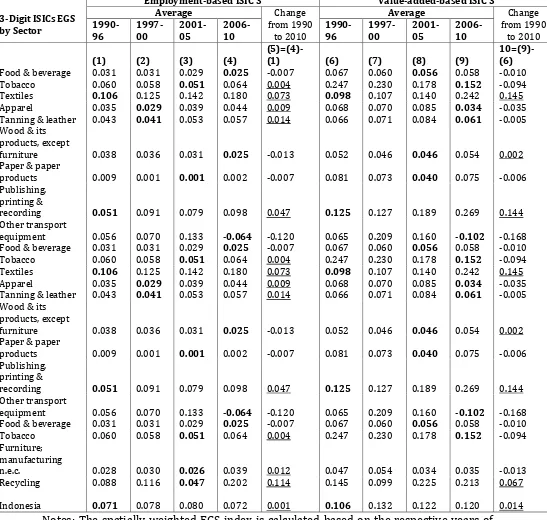
Table 1. Specialization patterns in Indonesia, across provinces
Employment-based ISIC 3 Value-added-based ISIC 3
Province respective years. The underlined font indicates provinces that became more specialized, while the bold font indicates a minimum value for each province.
31
Figure 2. RSI Patterns in Indonesia, Using Employment
0.00
Sumatera Java Kalimantan Sulawesi Other Indonesia
R
Notes: RS) is calculated based on the cities’ RS) values in the year ranges shown, and among industries at the three-digit SIC level.
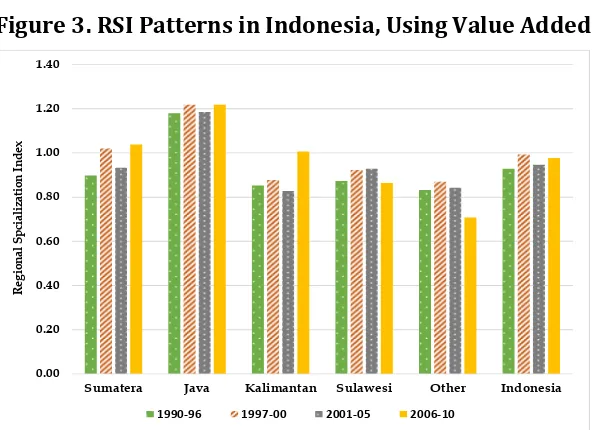
Despite the fact that the production structure might be different across provinces, we classified the provinces into five groups in terms of the island on which they were located. Figure2 and 3 show the regionalization pattern of each province over the period of study, using employment and value added data. We found a similar pattern between the two figures, although they indicated different degrees of specialization. We also found that Sumatera, Java Island, and Kalimantan became more specialized, while Sulawesi and the other islands became more de-specialized.
Figure 3. RSI Patterns in Indonesia, Using Value Added
0.00
Sumatera Java Kalimantan Sulawesi Other Indonesia
32
The Trend of Geographical Concentration in Manufacturing
Following Brülhart (2001), we classified the industries into five categories: resource-intensive, labor-resource-intensive, scale-resource-intensive, differentiated, and science-based industries (classification based on OECD, 1987). Appendix Table A.1 lists the three-digit ISIC codes for each category; the classifications were based on the factors that influenced the competitive process. Abundant natural resources constitute a primary competitiveness factor for resource-based industries, while low labor costs constitute a comparative advantage for labor-intensive industries. For scale-based industries, having a competitive edge is a matter of production length, while among product-differentiated industries, being competitive means having the ability to satisfy market demand. Finally, science-based industries rely on the application of scientific knowledge.
33
Figure 4. Geographical Concentration Pattern in Indonesia: EG Index, 1990–2010
Boom
Crisis
Recovery
Decentralization Policy
0
.0
5
.1
.1
5
.2
1990 1995 1997 2000 2001 2005 2010
EG, employment-based at city level EG, value added-based at city level EG, employment-based at province level EG, value-added based at province level
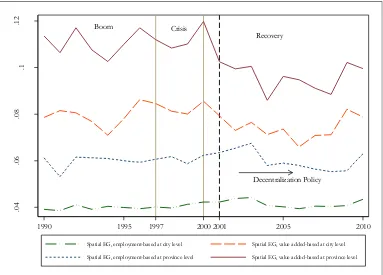
Figure 5. Geographical Concentration Pattern in Indonesia: EGS Index, 1990–2010
Boom Crisis
Recovery
Decentralization Policy
.0
4
.0
6
.0
8
.1
.1
2
1990 1995 1997 20002001 2005 2010
Spatial EG, employment-based at city level Spatial EG, value added-based at city level
34
By accounting for neighboring effects, we found that the EGS index is always greater than the EG index. Furthermore, the EGS index is more sensitive to capturing changes in the geographical concentration pattern, and this indicates that there is a strong connection among regions as externalities flow across cities and provinces. The deconcentration of economic activities seems to appear at around 2000 and become more spatially deconcentrated following the implementation of regional autonomy. The decline in concentration based on value-added data occurs at a brisker rate than based on employment data; this implies that the movement of capital for production is more sensitive to external shocks than the shifting of employment. Another interpretation is that the concentration of the labor market within the manufacturing industry is more rigid, as the mature plants are already firmly established in the core regions.
35
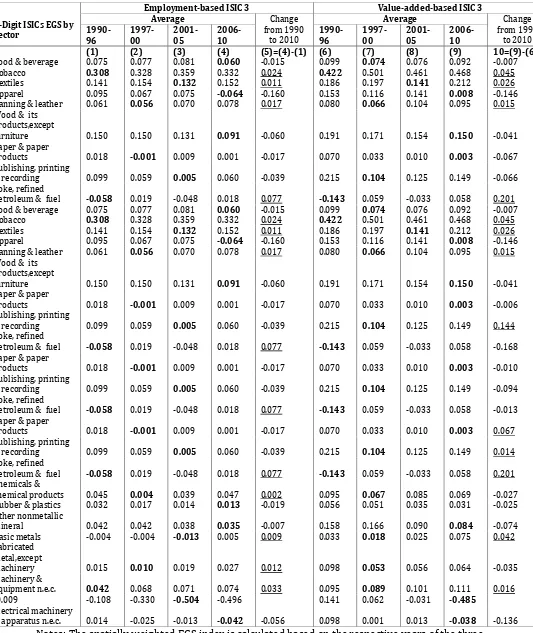
Table 2. Concentration (EGS) Pattern in Indonesia across Sectors, at the City Level.
Employment-based ISIC 3 Value-added-based ISIC 3
3-Digit ISICs EGS
Notes: The spatially weighted EGS index is calculated based on the respective years of the three-digit ISICs EGS within sector.
36
Table 3. Concentration (EGS) Pattern in Indonesia across Sectors, at Province Level.
Employment-based ISIC 3 Value-added-based ISIC 3
3-Digit ISICs EGS by
37
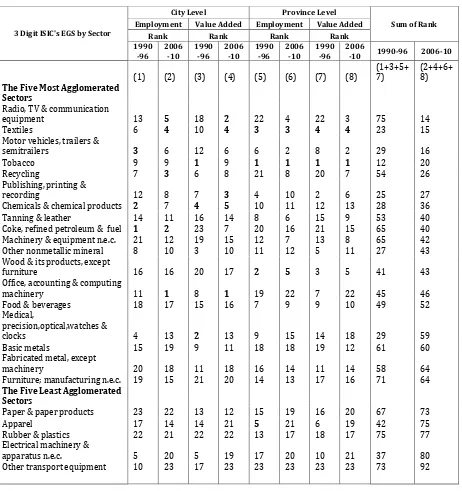
Table 4. Ranking of agglomerated industries.
3 Digit ISIC's EGS by Sector
City Level Province Level
Sum of Rank
Employment Value Added Employment Value Added
Rank Rank Rank Rank
Wood & its products, except
furniture 16 16 20 17 2 5 3 5 41 43
38
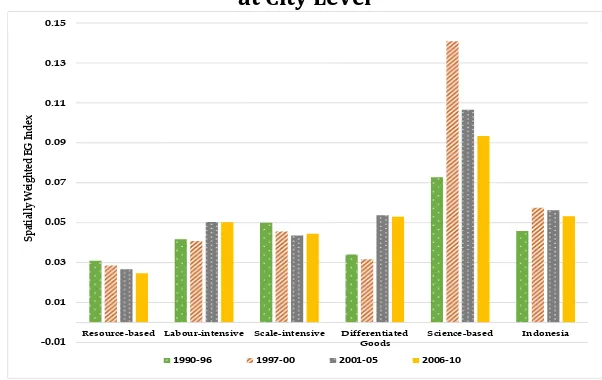
Figure 6 and 7 show that industrial concentration varies widely by industry group as per the OECD (1987) classification. In general, Figure 6 shows that the labor-intensive, differentiated goods and science-based industries are becoming more spatially concentrated. It is also clear that resource-based and scale-intensive industries have become more dispersed. However, at the province level, the geographical concentration of labor-intensive industries tends to be less concentrated (see Figure. 7.); indicating that industry group, in particular, the relocation of manufacturing appears within the province and concentrated in certain cities.7
Figure 6. Geographical Concentration Pattern in Indonesia (Employment-Based), at City Level
Figure 7. Geographical Concentration Pattern in Indonesia (Employment-Based), at Province Level
39
Determinant of Geographical Concentration
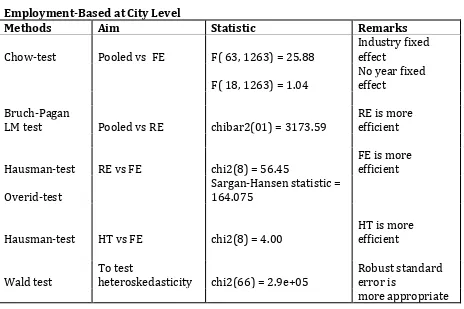
Before we discuss the determinant factor of geographical concentration, first we perform some tests to select the best model of our empirical modeling including OLS pooled estimation, fixed effect (FE) estimation, random effect (RE) estimation and Hausman-Taylor (HT) estimation. We focus on the results of statistic test at city level as reported in Table 5.8 The table indicates that the Hausman-Taylor estimation is the most efficient model. However, the Wald test of heteroscedasticity suggests applying robust standard errors. We will report the estimation results of both standard errors and robust standard errors.
Table 5. Testing for model selection.
Employment-Based at City Level
Methods Aim Statistic Remarks
Chow-test Pooled vs FE F( 63, 1263) = 25.88
Industry fixed effect
F( 18, 1263) = 1.04
No year fixed effect
Bruch-Pagan
LM test Pooled vs RE chibar2(01) = 3173.59
RE is more efficient
Hausman-test RE vs FE chi2(8) = 56.45
FE is more efficient Overid-test
Sargan-Hansen statistic =
164.075
Hausman-test HT vs FE chi2(8) = 4.00
HT is more efficient
Wald test
To test
heteroskedasticity chi2(66) = 2.9e+05
Robust standard error is
more appropriate
8
40
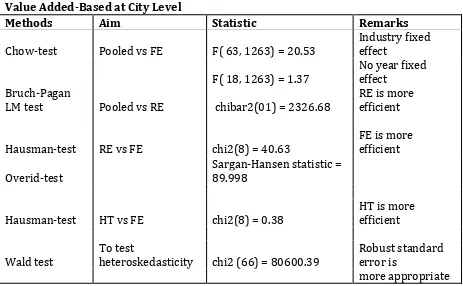
Value Added-Based at City Level
Methods Aim Statistic Remarks
Chow-test Pooled vs FE F( 63, 1263) = 20.53
Industry fixed effect
F( 18, 1263) = 1.37
No year fixed effect
Bruch-Pagan
LM test Pooled vs RE chibar2(01) = 2326.68
RE is more efficient
Hausman-test RE vs FE chi2(8) = 40.63
FE is more efficient Overid-test
Sargan-Hansen statistic =
89.998
Hausman-test HT vs FE chi2(8) = 0.38
HT is more efficient
Wald test
To test
heteroskedasticity chi2 (66) = 80600.39
Robust standard error is
more appropriate
Table 6 and 7 report the regression results at the city level.9 The results seem to beconsistent with those found in the literature—namely, increasing returns to scale have positive effects at both the city and province levels. Nonetheless, the role of raw materials is found to be limited at the city level when we use the value-added measurement. Kim (1995) found that production economies of scale supported localization in U.S. manufacturing, while He et al. (2008) concluded that internal economics scale contributed to geographical concentration. However, those variables become statistically insignificant when we impose robust standard errors (see Table 7). Meanwhile, a higher skill or knowledge intensity is associated with lower concentration, suggesting that firms with higher-skilled workers tend to be more dispersed.
9
41
Table 6. Determinant Geographical Concentration, at City Level
Dependent
Variables EGS, Employment-Based EGS, Value Added-Based
42
Table 7. Determinant GeographicalConcentration, at City Level Using Robust SE
Dependent
Variables EGS, Employment-Based EGS, Value Added-Based
43
dynamics in Indonesia and found superior performance among the regions most connected to the global economy.
We found also that wage negatively affects concentration, which suggests that higher wage rates break down the concentration and push firms to attempt to relocate to other regions with lower wage rates. This finding is consistent with that of Henderson and (1996) and with the arguments of Deichmann et al. (2008) pertaining to the factor price of industrial location. In general, we identified that the effect of export activities on EGS is stronger in employment based and the effect of wage on EGS is larger in value-added based. It is suggesting the relative importance of input factors between labor and capital. Finally, there is evidence that geographical concentration stemmed from economic crisis and decentralization policy in the long term, suggesting that both external shocks changed the pattern of geographical concentration to one that is more spatially concentrated. We also found evidence that resource-based and labor-intensive industries experienced de-agglomeration.
CONCLUSIONS
This study presented a general picture of the distribution of economic activities among manufacturing industries in Indonesia. We found that the provinces and cities became more specialized and experienced a greater degree of movement when they faced external shocks. The distribution of manufacturing activity overall slightly changed due to the 1997–98 economic crisis and the enactment of decentralization policy; evidence of this change was particularly compelling at the province and city levels, where firms were currently undergoing a deconcentration of sorts.
44
goods and science-based industries became more dispersed. Especially among labor-intensive industries, there is more concentration at the city level but greater dispersal at the province level. These findings confirmed that agglomeration has shifted across cities within each province.
The empirical results supported theory regarding economics scale and resource endowment in determining agglomeration and concentration. Furthermore, a firm’s interaction with the global economy does influence the local pattern of that firm’s location; it also has a positive effect on geographical concentration. Meanwhile, the market factor of labor price pushed industries to relocate to areas with cheaper labor cost. Concerning external shocks, there was evidence that either the economic crisis or decentralization policy had a positive relationship with geographical concentration.
Finally, the findings in third study gave some policy implications. Policymakers would be well advised to harness an increase in regional specialization to improve economic distribution across the country. Furthermore, the governments of the periphery cities near the core cities should work as buffer zones and anticipate the relocation of firms. Finally, the strong connection between the global economy and geographical concentration points to the importance of having special economic zones that have good access to the international economy.
REFERENCES
Aswicahyono, H., Hill, H., and Narjoko, D., (2010). Industrialisation After a Deep Economic Crisis: Indonesia. Journal of Development Studies, 46(6), 1084–1108. Bird, K., (1999). Concentration in Indonesia Manufacturing, 1975–93. Bulletin of
Indonesian Economic Studies, 35(1), 43–73.
Brakman, S., Garretsen, H., and Van Marrewijk, C., (2009). The New Introduction to Geographical Economics. Cambridge: Cambridge University Press.
Braunerhjelm, P., and Borgman, B., (2004). Geographical Concentration, Entrepreneurship and Regional Growth: Evidence from Regional Data in Sweden, 1975–99. Regional Studies, 38(8), 929–947.
Brülhart, M., (2001). Evolving Geographical Concentration of European Manufacturing industries. Weltwirtschaftliches Archiv, 137(2), 215–243.
45
Deichmann, U., Kaiser, K., Lall, S. V., and Shalizi, Z., (2005). Agglomeration, Transport and Regional Development in Indonesia (World Bank Policy Study Working Paper No. 3477). Washington, DC: World Bank.
Deichmann, U., Lall, S. V., Redding, S. J., and Venables, A. J., (2008). Industrial Location in Developing Countries. The World Bank Study Observer, 23(2), 219–246.
Devereux, M. P., Griffith, R., and Simpson, H., (2004). The Geographical Distribution of Production Activity in the UK. Regional Science and Urban Economics, 34(5), 533– 564.
Duranton, G., and Overman, H. G., (2005). Testing for Localization using Micro-Geographical Data. Review of Economic Studies, 72(4), 1077–1106.
Ellison, G., and Glaeser, E. L., (1997). Geographical Concentration in US Manufacturing Industries: A Dartboard Approach. Journal of Political Economy, 105(5), 889– 927.
Fujita M., Krugman, P., and Venables, A., (1999). The Spatial Economy. Cities, Regions and International Trade. Cambridge: MIT Press.
Ge, Y., (2009). Globalization and Industry Agglomeration in China. World Development, 37(3), 550–559.
Guimarães, P., Figueiredo, and O., Woodward, D., (2011). Accounting for Neighboring Effects in Measures of Spatial Concentration. Journal of Regional Science, 51(4), 678–693.
He, C., Wei, Y. D., and Xie, X., (2008). Globalization, Institutional Change, and Industrial Location: Economic Transition and Industrial Concentration in China. Regional Studies, 42(7), 923–945.
Henderson, J. V., and Kuncoro, A., (1996). Industrial Centralization in Indonesia. The World Bank Economic Review, 10(3), 513–540.
Hill, H., Resosudarmo, B. P., and Vidyattama, Y., (2008). Indonesia's Changing Economic Geography. Bulletin of Indonesian Economic Studies, 44(3), 407–435.
Kim, S., (1995). Expansion of Markets and the Geographical Distribution of Economic Activities: The Trends in US Regional Manufacturing Structure, 1860–1987. Quarterly Journal of Economics, 110(4), 881–908.
Krugman, P., (1991a). Geography and Trade. Cambridge, MA: MIT Press.
46
Lu, J., and Tao, Z., (2009). Trends and Determinants of China’s )ndustrial Agglomeration. Journal of Urban Economics, 65(2), 167–180.
Marcon, E., and Puech, F., (2003). Evaluating the geographical Concentration of Industries using Distance-Based Methods. Journal of Economic Geography, 3, 409–428.
Midelfart‐Knarvik, K. H., and Overman, H. G., (2002). Delocation and European Integration: Is Structural Spending Justified?, Economic Policy, 17(35), 321–359. Oates, W. E., (1993). Fiscal Decentralization and Economic Development. National Tax
Journal 46, 237–243.
OECD, (1987). Structural Adjustment and Economic Performance, OECD, Paris.
Rodríguez-Pose, A., Tselios, V., Winkler, and D., Farole, T., (2013). Geography and The Determinants of Firm Exports in Indonesia. World Development 44, 225–240. Rosenthal, S. S., and Strange, W. C., (2001). The determinants of agglomeration. Journal
of Urban Economics, 50(2), 191–229.
Sjöberg, Ö., and Sjöholm, F., (2004). Trade Liberalization and the Geography of Production: Agglomeration, Concentration, and Dispersal in Indonesia’s Manufacturing Industry. Economic Geography, 80(3), 287–310.
47
Appendix: Table A.1 List of Three-Digit ISIC Codes based on OECD (1987) Classification
SIC3 OECD Classification SIC3 OECD Classification
Resource-based industries Differentiated goods
151 Meat, fish, fruit, vegetables, oils 291 General purpose machinery
152 Dairy products 292 Special purpose machinery
153 Grain mill products, animal feeds 293 Domestic appliances n.e.c.
154 Other foods 311 Electrical motors, generators, etc
155 Beverages 312 Electrical distribution equipment
160 Tobacco products 313 Insulated wire, cable
201 Wood saw milling and planning 314 Batteries and cells
202 Wood products 315 Lamps and equipment
210 Paper and products 319 Other electrical equipment n.e.c.
251 Rubber products 322 TV and radio transmitters
252 Plastic products 323 TV, radio, video equipment
333 Watches, clocks
Labor-intensive industries 341 TV color vehicle assembly 171 Spinning, weaving & textile finish 342 Motor vehicle bodies
172 Other textiles 343 Motor vehicle components
173 Knitted, crocheted fab., articles 351 Ship building, repair
174 Kapok 352 Railway equipment
181 Apparel 359 Motorcycle, bicycle, other
182 Fur articles
191 Leather tanning and products Scale-intensive industries
192 Footwear 221 Publishing
281 Structural metal products 222 Printing
289 Other fabricated metal products 223 Media recording reproduction
231 Coke oven products
Science-based industries 232 Refined petroleum products
242 Industries other chemical products 241 Basic chemicals
300
Office, accounting, computing
machinery 243 Manmade fibers
321 Electronic components 261 Glass products
331 Medical, measuring equipment 262 Porcelain products
332 Optical, photographic equipment 263 Clay products
353 Aircraft, spacecraft 264 Cement and lime products
265 Marble and granite product