*Corresponding e-mail: [email protected]
MODEL OF CAUSALITY BETWEEN FDI AND
GROSS DOMESTIC PRODUCT ON ASEAN-5 COUNTRIES FROM 1980-2014
Dedy Supriyadi
Department of Economics
Department of Economics, Faculty of Economics and Business, University of Brawijaya
Dias Satria*
Department of Economics
Faculty of Economics and Business, University of Brawijaya
ABSTRACT
The research examines the relationship between Foreign Direct Investment (FDI) and Gross Domestic Product (GDP) for ASEAN-5 countries between the periods of 1980 to 2014. The study uses a Toda-Yamamoto granger causality model to test the causality between the FDI and the GDP. The results show that the ASEAN countries are differently in responding the impacts of FDI to the GDP. In general, the FDI leads to GNP in Singapore and Thailand while, in Indonesia and Malaysia, the GNP leads to FDI. In the case of Philippines, there is no causality relationship between the two variables found.
Keywords: FDI, GDP, ASEAN, Toda-Yamamoto
JEL Classification: E01, F21
INTRODUCTION
The relationship between Foreign Direct Investment (FDI) and Gross Domestic Product (GDP) has long been an issue of interest among researchers and policymakers. FDI is often considered as the key role in economic development. However, there is a view that FDI has no significant impact to the economy of a country. Based on the data from UNCTAD (2015), Southeast Asia region has a significant portion of FDI flow and stock which is the second highest after the East Asia region. Among the Southeast Asian countries, most of the FDI flows into countries like Singapore, Indonesia, Thailand, Malaysia and Philippines.
2
(Winantyo et al, 2008). Since 1987, ASEAN has initiated a step of investment agreement by the signing of the Promotion and Protection of Investment Agreement (PPIA). A decade later, in 1998, it initiated the framework on the ASEAN Investment Area (AIA), the investment incentives aimed to promote ASEAN as an attractive competitive region, that is open and free to attract and increase FDI (Aldaba and Yap, 2009; Winantyo et al, 2008).
In 2008, these agreements merged into one, known as the ASEAN Comprehensive Investment Agreement (ACIA). Through ACIA, there are three stages towards the ASEAN liberalization for the ASEAN Economic Community (AEC) in 2015. The first stage was conducted in 2008 to 2011, the second stage was conducted in 2011 to 2013, and the final stage was conducted in 2013 to 2015. (Winantyo et al, 2008). When the final stage has completed, the single market of the ASEAN Economic Community enacted at the end of 2015 as a continuation towards the liberalization in ASEAN region. One of the important pillars of AEC 2015 was the implementation of the free flow of investment.
The free flow of investments in AEC 2015 provides opportunities for the FDI improvement in ASEAN region. It is expected to create shared prosperity in the region through an increase in GDP, because, the welfare may occur if there is an acceleration of capital accumulation and investment, especially FDI. The framework is in line with the hypothesis of FDI-driven growth. The hypothesis believes that FDI can lead an improvement in the GDP. It is supported by empirical research by Kundan and Gu (2010) in Nepal and by Baharumshah and Thanoon (2006) in East Asia which support the hypothesis of the existence of FDI-driven growth.
On the other hand, the regionalization and liberalization, such as AEC 2015, may have a significant impact on the FDI inflow. Because the economic integration creates a greater market share, then the performance of the broad and integrated regional economy will be getting better. It is what lies behind the second hypothesis. FDI-driven growth requires the growth of market size to attract FDI. This hypothesis is empirically supported by the research of Chakraborty and Basu (2002), and Pradhan (2008) that showed the pattern of relationship FDI-driven growth. In addition, Ang (2008) investigated the relationship between two variables. The research results support the hypothesis of FDI-driven growth.
3
and GDP is still a matter of debate in many countries, whereas on the empirical level, research findings are not always in line with the constructed theories. On the theoretical
level as cited in Aga’s (2014), Adam (2009) classifies two main views used to demonstrate the relationship between FDI and GDP comprising traditional view as represented by dependency theory and modern view led by the neoclassical and endogenous growth theory.
From the traditional standpoint, dependency theory claims that inhibition of FDI does not significantly affect the increase in GDP. FDI bring through developed countries to exploit most of the existing economic potentials of poor countries. Dividend given by foreign investors to the host countries turned out to be channeled to the investor's home country (Kuncoro, 2006). Moreover, FDI tends to inhibit direct investment which local companies cannot compete because of the limited funding, size and market force.
The above opinion is supported by previous research. The first FDI research by Weisskopf (1972) supports the traditional standpoint that the host countries of FDI receive an insufficient benefit because the profit is transferred to the foreign company's home country. Saltz (1992) further examined the effects of FDI in 68 developing countries and revealed the negative correlation between two variables. Several of recent researchs fall into the similar conclusion. However, Herzer and Klasen (2008) examined the pattern of the relation between two variables in 28 countries. The results showed that only seven countries cointegrated in the long term. In addition, no causality that supports the neutral causality hypothesis proven to be occurring in 16 countries. Lastly, Falki (2009) has done the research about the impact of FDI, domestic capital, foreign capital and labor toward the economic growth of Pakistan during 1980 to 2006.
4
According to neoclassical theory, FDI increases GNP through the increased investment volume or its efficiency (Li and Liu, 2005). Furthermore, FDI increases the supply of capital and the growth of recipient countries through the formation of fixed capital. On the other hand, based on endogenous growth theory, FDI increases GNP by the diffusion of technology of home country to the host country. FDI related technological spillover counterbalances the effect generated by the diminishing results on investment and retains economy on the long-term growth path.
From the perspective of modernization, the first hypothesis of FDI-driven growth generated. This hypothesis is formulated based on the growth theory which puts direct investment as one of the determinants of output growth. The impact of FDI on the economy of recipient country is examined in the context of its effect on the factors triggering growth including human capital, export and technology. Furthermore, FDI encourages the export of host country and help companies in the host countries to advance their access to international market. Several empirical research indicated the same hypothesis as exemplified by Kundan and Gu (2010) in Nepal by utilizing granger causality and cointegration that revealed the long-term relationship of the variables and the direction of the causality running from FDI to GNP. In addition, Baharumshah dan Thanoon (2006) asserted the effect of GNP on economic growth of such countries as in East Asia including China, both in the short-term and long-term.
5
This hypothesis is supported by several studies showing that a relatively high increase in GNP is able to attract higher FDI flow into the host country as Chakraborty and Basu (2002) research in the context of India employing the VECM method for determining the short-term dynamic interaction between two variables. The empirical result showed that causality flow from real GDP to FDI. In addition, Ang (2008) has investigated the relationship between two variables in Malaysia that revealed the GNP leads to long-term FDI. The two previously mentioned researchs are also supported by a research by Pradhan (2008) which analyzed the pattern of the relationship between FDI and economic growth in Malaysia and India during 1970-2004 using granger causality test and cointegration. The result shows that economic growth leads to FDI in both countries.
The last is the hypothesis of feedback, the most interesting scenario in the relationship between GNP and FDI. According to Zhang (2001), the condition can occur because a high increase in GNP or a rapid economic growth of a country not only attracts more FDI but also provides better opportunities to generate profit. On the one hand, the flow of FDI may directly and indirectly helps in increasing the host country's GNP. This hypothesis supported by research conducted by Srinivasan et al (2011) in the SAARC countries. The results show a two-way relationship of FDI and GNP in SAARC countries excluding India. In addition, Umoh et al (2012) investigated the correlation between economic growth and foreign investment in Nigeria in 1970 and 2008 using a single equation model and system of simultaneous equations. The result indicates a positive correlation of the growth rate to FDI and vice versa. Lastly, Shaari et al (2012) utilized the VAR model with cointegration techniques, granger-causality and VECM. The result of granger causality tests show that FDI leads to GDP and vice versa.
RESEARCH METHOD
6
The data used was secondary data obtained from the United Nations Conference on Trade and Development (UNCTAD). The selected research period started from 1980 to 2013. The 1980 period used as the starting point of the analysis due to the fact that FDI policy reforms in most of the ASEAN countries that have been occurred since the early 1980s (Winantyo et al, 2008). The selection of ASEAN-5 countries as the research objects including Singapore, Indonesia, Thailand, Malaysia and the Philippines was based on the reason that the ASEAN-5 had benefited from the flow and great FDI stock and high level of GDP. Therefore, the ASEAN-5 countries are predicted to have a strong prospect in
attracting the world’s FD) volume in the era of AEC 5.
This research examines two variables, thus bilateral causality can be used. Bilateral causality can be examined using Granger causality model or Toda-Yamamoto causality model. Granger causality model is a term used to identify the existence of the causal relationship in time series analysis. According to Oladipo (2009) in Agustin's (2014), Granger causality test is based on the null hypothesis formulated as a zero restriction on the coefficient of the subset slackness of the variables involved. If the subset slackness of the variables involved is not at the level, then the results of Granger causality test estimate are false and inefficient. In this research, if the data did not have roots at the unit level, then Granger causality models can be used. The granger causality standard model used is as follows:
LNGDPt = (1)
LNFDIt = c2 + (2)
7
LNGDPt = (3)
LNFDIt = (4)
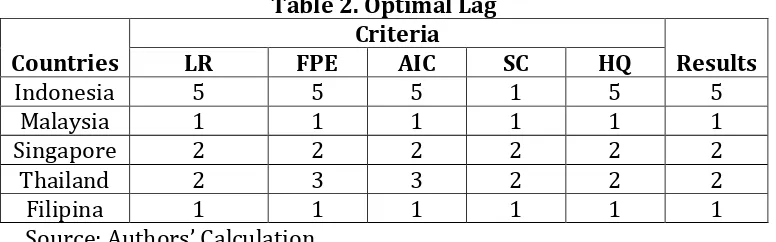
where k is the optimal lag, dmax is the maximum order, GDPt is gross domestic product in period t, and FDI is FDI stock in period t. In using Toda-Yamamoto causality model, the first step is to determine the maximum order (dmax) which can be identified through the stationary unit root test – ADF test. The next step is to determine the optimal lag (k). Once the maximum order (dmax) and optimal lag (k) is identified, it is necessary to estimate the augmented VAR model.
RESULTS
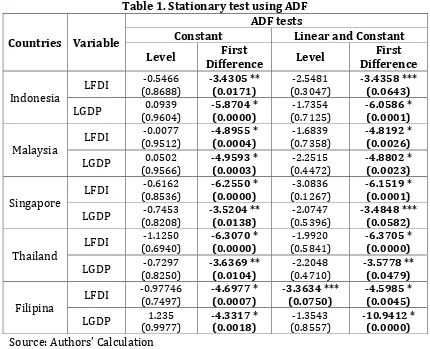
Stationary tests
Stationary test in this research aims to analyze whether the variables in the estimation have roots units or not, because most of the macroeconomic data are not stationary. If it still estimated, it generates spurious regression (spurious regression). Moreover, the result can be stationary give the information regarding causality test models used. If the stationary is on the degree level, then use the model of Granger causality. If stationary is on the degree one, then use the Toda Yamamoto causality model. The stationary test in this research is using Augmented Dickey-Fuller test by comparing the probability value with
the level of α %, 5% and % or also by comparing the value of Augmented Dickey -Fuller with Mackinnon Statistic Critical Value.
9
Cointegration test is used to determine the balance in the long term between the variables in the model. Cointegration test based on the method that uses the Johansen’s cointegration optimal lag in accordance with the determination of an underlying deterministic cointegration equation. Johansen cointegration test is known by comparing the eigenvalues subset of the statistics with eigenvalues in the table with a confidence level of 5%. In addition, also compare the value of the statistical trace values in the table with a confidence level of 5%.
Indonesia 24.49392 19.38704 29.93932 25.87211 Cointegration Malaysia 16.88442 19.38704 23.82156 25.87211 No Cointegration Singapore 21.05978 19.38704 25.91552 25.87211 Cointegration
Thailand 8.396637 17.14769 12.01322 18.39771 No Cointegration Filipina 17.44333 19.38704 25.02529 25.87211 No Cointegration Source: Authors’ Calculation
10 Causality Test
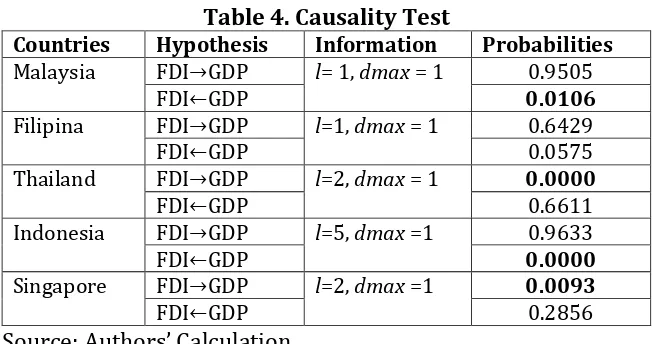
Causality test is used to determine an exogenous variable can be treated as an endogenous variable. In this research, Toda-Yamamoto causality model is used where all the variables are integrated on a single degree as it have been tested in stationary data. In identifying the causal relationship between the two variables, probability value is compared to a confidence level of 1% and 5%.
Table 4. Causality Test
Countries Hypothesis Information Probabilities Malaysia FD)→GDP l= 1, dmax = 1 0.9505
FD)←GDP 0.0106
Filipina FD)→GDP l=1, dmax = 1 0.6429
FD)←GDP 0.0575
Thailand FD)→GDP l=2, dmax = 1 0.0000
FD)←GDP 0.6611
Indonesia FD)→GDP l=5, dmax =1 0.9633
FD)←GDP 0.0000
Singapore FD)→GDP l=2, dmax =1 0.0093
FD)←GDP 0.2856
Source: Authors’ Calculation
The Toda-Yamamoto causality test results show the relationship between variables as shown in the table 4. Indonesia and Malaysia are going one-way relationship that affecting the FDI and GDP at the rate of 5%. While Singapore and Thailand show one-way relationship of FDI and GDP at a rate of 5%. Lastly, Philippines does not showing the causal relationship between the variables at the 5% level.
The results of some series of tests revealed that the relationship between FDI and GNP differs in ASEAN-5 countries. In general, the FDI leads to GNP in Singapore and Thailand while, in Indonesia and Malaysia, the GNP leads to FDI. In the case of Philippines, there is no causality relationship between the two variables found.
11
macroeconomic conditions, differences in economic structure (Zhang, 2001), investment climate and investment policy (Herzer and Klasen, 2008).
In the case of Singapore and Thailand, the FDI leads to GDP; the finding reinforces the hypothesis of FDI-driven growth. This particular finding is also proved by the research of Kundan and Gu (2010) in Nepal, and of Baharumshah and Thanoon (2006) which extend the relationship patterns of FDI to GDP. Theoretically, the pattern of this relationship can be described in neoclassical and endogenous growth theory that claims the direct investment is one of the dominant factors for the increase in GDP. According to Li and Liu (2005), the neoclassical theory explains that FDI increases the capital stock that could lead to an increase in GDP.
However, based on the endogenous growth theory, foreign investment will increase GDP by the diffusion of technology from developed countries to recipient countries (Borensztein, 1998). The technology eliminates the effect of diminishing returns of capital based on neoclassical theory and retains the long-term economic stability. In addition, the endogenous growth theory also asserts that FDI can increase the GDP through the spillover effect.
If it analyzed separately, the pattern of the relationship as found in the case of Singapore can be explained. First, the FDI increases capital accumulation due to the fact that since its initial construction has been used as the trigger of the increased GDP. It cannot be separated from the fact that Singapore is a small country both in terms of its territorial size, population, and insufficient natural resources to build the country. Under these conditions, the economy of Singapore which has experienced contractions at the beginning of its separation from Malaysia encountered difficulty to achieve high economic growth and transformed into a developed country without the presence of FDI.
Second, due to the spillover effects carried by FDI in Singapore, one of them is the transfer of technology or technology overflow. Borensztein et al (1998) argued that the transfer of technology plays an important role in the economic development of a country, for instance the increased productivity in the long-term. Technology overflow as the evidence of the occurrence of spillover effect is also reinforced by the research of Tu and Ta (2012) which revealed that the positive technology transfer in Singapore was derived from
12
has a good absorptive capability. Borensztein et al (1998) explained that the spillover effect may occur depending on the quality of absorptive capability of human capital. Referring to the report of Global Competitiveness Index published by the World Economic Forum (2014), the quality of Singapore human capital as reflected by its excellent higher education and training pillar placed Singapore on the second rank of 144 countries.
Meanwhile, in Thailand, the FDI leads to GDP as a result of several factors. First, as in Singapore, FDI in Thailand increases the capital stock based on the fact that the following economic crisis of 1997/1998, the flow and stock of FDI in Thailand have grown substantially over the last decade. This is in contrast with the case of Indonesia and Malaysia where FDI after the economic crisis of 1997/1998 has not been able to return to prior crisis condition. Second, the occurrence of such spillover effects as technology and knowledge transfer is confirmed by research conducted by Tu and Ta (2012) who found the positive effect of the abundance of technology in Thailand originating from China's FDI. The positive spillover effect in Thailand happens when technology advancement and managerial skills in the FDI are transmitted to domestic companies because of the presence of multinational companies. Technology and knowledge transfer occurs when multinational companies establish cooperation with domestic companies.
Moreover, Thailand’s FD) policy focuses on export-oriented multinational companies which correspondingly support the hypothesis of FDI- driven growth. Thailand provides distinct tax incentives to multinationals which have export-oriented products. According to Balasubramanyam et al (1996), hypothesis of FDI-driven growth tends to occur in developing countries that have a policy of export-oriented foreign investment.
The case of Malaysia and Indonesia in which GDP leads to FDI further reinforces the presence of hypothesis of FDI-driven growth. This particular finding is supported by the previous research including by Chakraborty and Basu (2002) in India, by Ang (2008) for Malaysia and by Pradhan (2008) for India and Malaysia for the periods of 1970 to 2004 that revealed the spread out relationship pattern of GDP towards FDI.
If it is analyzed deeply, there are some causes of the relationship direction of
13
as a potential market. Potential market share provides more opportunities for multinational companies to increase sales and profits and subsequently increase their investment in the country. This is in line with Khan and Nawaz (2010) that foreign investors invest in countries where they get a new opportunity. The large market share of Indonesia is also supported by the report of Global Competitiveness Index issued by World Economic Forum (2014) in which Indonesia ranked 15 out of 144 countries.
Second, Indonesia is stable and relatively has a high economic growth. Over the past three decades, Indonesia economic growth is always higher than 5% per year except during the economic crisis of 1997/1998 and a few years after the crisis. High economic growth during several periods often makes foreign investor to expect faster return on investment. In addition, if compared with other ASEAN-5 countries, Indonesia's economic growth is relatively stable from year to year. It provides comfort and certainty for investors in estimating the rate of profit. The large market share and relatively high and stable economic growth are supported by FDI regulations. Generally, Indonesia opens up opportunities for broader FDI. The publication of Act Number 25 of 2007 provides positive opportunities for the flow of FDI due to the diminishing negative investment list, which means more and more sectors are opened to be entered by FDI.
While in Malaysia, there are several reasons that strengthen the relationship of the GDP that leads to FDI. First, although Malaysia does not have a large population, the level of real income per capita is high. In 2013, the level of Malaysia, real income was the second highest in Southeast Asia. High level of real income makes Malaysia's population to have a greater purchasing power than other countries in the ASEAN-5 and it would be a determining factor for investors. This fact is supported by research of Muhammad et al (2011) that shows market size significantly influences the flow of FDI in Malaysia.
14
restriction and providing a number of incentives to attract more FDI. Easing restriction and incentive provision make Malaysia as one of the most open countries after Singapore in terms of FDI Regulatory Restrictiveness Index issued by the Organization for Economic Co-operation and Development (2014).
In the case of Philippines, no relationship between the two variables was found. This research finding strengthens the support for the research by Aga (2014) in Turkey and Herzer and Klasen (2008) which revealed no causal relationship in 16 out of 28 countries. There are several explanations for this. First, the direct spillover effects as capital accumulation, or the indirect effects such as technology and knowledge transfer does not happen as predicted by endogenous growth theory and the possibility of negative spillover effects (Yalta, 2013). This may happen because multinational companies try to protect their specific knowledge or foreign companies reduce the productivity of domestic companies through the effects of competition.
In terms of economy, unstable macroeconomic conditions, fluctuations in economic growth and low GDP of Philippines compared to ASEAN-5 economy during the research period also influence this relationship. Some macroeconomic variables in Philippines showed that the condition is not quite good compared to other ASEAN-5 countries. Furthermore, in terms of policy, Philippines is one of the countries that has the strictest regulation on the restrictions of foreign ownership compared to other ASEAN-5 countries. It is one of the factors that lead to the low flow of FDI in Philippines for decades. The number of restricted sectors makes the Philippines lagged the ASEAN-5 countries in attracting FDI. It is supported by a publication issued by the OECD in which Philippines is one of the most closed countries in the ASEAN as seen from FDI Regulatory Restrictiveness Index. Lastly, in terms of competitiveness and investment climate of Philippines based on Global Competitiveness Index issued by the World Economic Forum (2014), most of the indicators do not perform well if compared with the ASEAN-5 countries.
CONCLUSION
15
and the GDP. The results show that the ASEAN countries are differently in responding the impacts of FDI to the GDP. In general, the FDI leads to GNP in Singapore and Thailand while, in Indonesia and Malaysia, the GNP leads to FDI. In the case of Philippines, there is no causality relationship between the two variables found.
REFERENCES
Aga, Ahmed Abdulrahman Khader. (2014). The Impact of FDI on Economic Growth: A Case Study of Turkey 1980-2012. International Journal of Economics and Finance. 6(7), 71-84
Agustin, Grisvia. (2014). Analisis Determinan Pertumbuhan Ekonomi, Investasi Asing Langsung dan Daya Saing Indonesia dan China 1995-2011. Disertasi. Universitas Brawijaya
Aldaba, Rafaelita M. and Josef T. Yap. (2009). Investment and Capital Flows: Implication of the ASEAN Economic Community. Discussion Paper Series No. 2009-01. Philippines Institute for Devlopment Studies
Ang, James B. (2008). Financial Development and the FDI-Growth Nexus: the Malaysian Experience. Journal of Applied Economics. Vol. 41(13), 1595-1601
Baharumshah, A. Zubaidi and M. Abdul-Malik Thanoon. (2005). Foreign Capital Flow and Economic Growth in East Asian Countries. China Economic Review. 17(1), 70-83
Baharumshah, A. Z., and Thanoon, M. A. M. (2006). Foreign capital flows and economic growth in East Asian countries. China economic review, 17(1), 70-83.
Balasubramnyam, V.N. et al. (1996). Foregin Direct Investment and Growth in EP and IS Countris. Economics Journal. Vol. 106(434), 92-105
Borensztein, E., De Gregorio, J., and Lee, J. W. (1998). How does Foreign Direct Investment affect Economic Growth?. Journal of international Economics, 45(1), 115-135.
Chakraborty, Chandana and Parantap Basu. (2002). FDI and Growth in India: A Cointegration Approach. Applied Economics. 34(9), 2061-1073
Esso, Jacques Loesse. (2010). Long-Run Relationship and Causality Between FDI and Growth: Evidance From Ten African Countries. International Journal of Economics and Finance. 2(2), 168-177
16
Gui-Diby, S. Loris. (2014). Impact of FDI on Economic Growth in Africa: Evidance from Three Decade of Panel Data Analysis. Reseach in Economic. Vol.68, 248-256
Herzer, D., and Klasen, S. (2008). In search of FDI-led growth in Developing Countries: The Way Forward. Economic Modelling, 25(5), 793-810.
Khan, R. E. A. and M. A. Nawaz. (2010). Economic Determinants of FDI in Pakistan. Journal of Economics. 1(2), 99-104
Kundan, Majagaiya and Qingliang Gu. (2010). A Time Series Analysis of Foregin Direct Investment and Economic Growth: A Case Study of Nepal. International Journal of Business and Management. 5(2), 144-148
Kuncoro, Mudrajad. (2006). Ekonomi Pembangunan: Teori, Masalah dan Kebijakan. Edisi ke-3. Yogyakarta: UPP AMP YKPN
Li, Xiaoying and Xiaming Liu. (2005). FDI and Economic Growth: An Increasingly Endogenous Relationship. World Development. 33(3), 393-407
Muhammad, A., Muhammad, F., Muzaffar, A., and Muhammad, S. . ’Market size effect
on foreign direct investment: A Case of Malaysia,’. Interdisciplinary Journal of Contemporary Research in Business, 3(7), 1002-1007.
Pradhan, Rudra Prakash. (2008). Does Economic Growth Promote FDI? Evidance from India and Malaysia. South Asian Journal of Management. 15(1), 07-23
Saltz, S. Ira. (1992). The Negative Correlation Between FDI and Economic Growth in the Third World: Theory and Evidance. Rivista Internazionale di Scienze Economiche e Commerciali. Vol.39, 617-633.
Shaari, Mohd Shahidan Bin. (2012). FDI and Economic Growth: Evidence from Malaysia. Interational Business Reaseach. 5(10), 100-106
Srinivasan, P., Kalaivani, M., and Ibrahim, P. (2011). An Empirical Investigation of Foreign Direct Investment and Economic Growth in SAARC Nations. Journal of Asia Business Studies, 5(2), 232-248.
Tu, Yonghong and Xiao Tan. (2012). Technoloy Spillovers of FDI in ASEAN Sourcing from Local and Abroad. China Finance Review International. 2(1), 78-94
Umoh, O. J., Jacob, A. O., and Chuku, C. A. (2012). Foreign Direct Investment and Economic Growth in Nigeria: An Analysis of the Endogenous Effects. Current Research Journal of Economic Theory, 4(3), 53-66.
17
http://unctadstat.unctad.org/wds/ReportFolders/reportFolders.aspx?sCS_ChosenLa ng=en (accessed in 01 Maret 2015)
Viyajakumar, Sridharan P. (2009). Causal Relationship between FDI and Growth: Evidence from BRICS Countries. International Business Reseach. Vol.2, (No.2), 198-203
Weisskopf, T. E. (1972). The impact of foreign capital inflow on domestic savings in underdeveloped countries. Journal of international Economics, 2(1), 25-38.
World Economic Forum. (2014). The Global Competitiveness Report 2014–2015. www3.weforum.org/docs/WEF_GlobalCompetitivenessReport_2014-15.pdf
(accessed in 01 Maret 2015)
Winantyo, R., Arifin, S., Djaafara, R. A., and Budiman, A. S. (2008). Masyarakat Ekonomi ASEAN (MEA), 2015: memperkuat sinergi ASEAN di tengah kompetisi global. Elex Media Komputindo.
Yalta, A. Yasemin. (2013). Revisiting the FDI-led Growth Hypothesis: The Case of China. Economic Modelling. Vol.31, 335-343
Zhang, K.H. (2001). Does FDI Promote Economic Growth? Evidence from East Asia and Latin America. Contemporary Economics Policy. 19(2), 175-185