N
utrients such as nitrogen and phosphorus have long been known to degrade surface waters, causing harmful algal blooms, the loss of submersed aquatic vegetation, and ish kills in bodies of water around the country. Nutrient pollution, which can come from sources such as agricul-tural operations, urbanlandscapes, and wastewater, is addressed by the Clean Water Act through the use of narrative standards for water quality—statements that deine a desired condition of a water body in words (see Box 1).
Recently, the U.S. Environmental Protection Agency (EPA) has encouraged states to estab-lish numeric nutrient criteria which deine the maximum nitrogen and phosphorus concentra-tion in a water body, under the assumpconcentra-tion that this will accelerate and standardize the restora-tion of nutrient-impaired waters. In Florida, numeric criteria for nitrogen and phosphorus were proposed by the EPA following a 2009
lawsuit that maintained that Florida’s narrative standard was not protec-tive of the state’s waters.
Implementing numeric criteria may result in new Florida waters being listed as impaired, and may also cause the reevaluation of total maximum daily load calculations— limits on the amount of nutrients that can be discharged to a water body each day—for waters that are already listed as impaired. These actions could lead to new or revised discharge permits for point sources such as municipal and industrial waste-water treatment plants, and new nutrient control requirements for nonpoint sources of pollutants. Because of these implications, the EPA was required to produce an economic analysis of the potential costs of implementing numeric
nutrient criteria for Florida’s lakes and lowing waters. In late 2010, EPA estimated the incre-mental cost to range from $135.5 to
$206.1 million per year. Other stakeholder groups produced much higher estimates of the The Environmental Protection Agency’s estimate of the costs associated with implementing
numeric nutrient criteria in Florida’s waterways was signiicantly lower than many stakehold -ers expected. This discrepancy was due, in part, to the fact that the Environmental Protection Agency’s analysis considered only the incremental cost of reducing nutrients in waters it considered “newly impaired” as a result of the new criteria—not the total cost of improving water quality in Florida. The incremental approach is appropriate for this type of assessment, but the Environmental Protection Agency’s cost analysis would have been more accurate if it better described the differences between the new numeric criteria rule and the narrative rule it would replace, and how the differences affect the costs of implementing nutrient reductions
over time, instead of at a ixed time point. Such an analysis would have more accurately
described which pollutant sources, for example municipal wastewater treatment plants or agricultural operations, would bear the costs over time under the different rules and would
have better illuminated the uncertainties in making such cost estimates.
Review of the EPA’s Economic Analysis of
Final Water Quality Standards for Nutrients
for Lakes and Flowing Waters in Florida
Algal bloom on the lower St. Johns River.
cost of implementing numeric nutrient criteria, with some estimating annual costs as high as $12 billion.
EPA’s Estimates of the Incremental Cost to
Implement the Numeric Nutrient Criteria Rule
EPA’s cost estimate was lower than those calculated by other stakeholder groups due to several factors. First, EPA considers only the incremental cost of improving the quality of waters that are newly identi-ied as impaired based on the numeric nutrient criteria rule, and does not consider waters that Florida has already determined to be impaired based on existing methods. Second, EPA and other stakeholders made different assumptions about the extent to which certain pollutant sources should be included in their cost analyses. Third, there are differing assumptions made about levels of technology that will be needed to meet the numeric nutrient criteria.The report concluded that EPA was correct to estimate incremental costs of the change from the narrative to numeric approach. However, some members of the media, the public, and decision makers misinterpreted EPA’s incremental cost estimate as the total cost needed to improve Florida water quality. The committee stressed that the total costs to meet Florida’s water quality goals, are highly uncertain but will substantially exceed the incremental costs of any rule change and will take decades to achieve.
Assessment and Commentary on EPA’s
Analysis
The irst part of EPA’s analysis identiied point sources of water pollution that will have to improve water treatment in response to the numeric nutrient criteria rule, the likely technological upgrades that would be implemented, and the cost of such upgrades. To deal with more diffuse sources of nutrients, EPA identiied
waters that would be newly impaired under the numeric nutrient criteria and delineated their associ-ated watersheds in order to estimate the location and amount of land area that would require new pollutant load controls. Costs to comply with the numeric nutrient criteria rule were estimated for the various sectors of pollutant sources: municipal wastewater facilities, industrial wastewater facilities, agricultural lands, urban stormwater, and on-site septic systems, as well as for related governmental expenditures.
Determination of Incrementally Impaired Waters If suficient monitoring data on nitrogen and phosphorus concentrations were available for all waterbodies, identifying newly impaired waters would be quite simple. However, for about 77 to 86 percent of the lakes and lowing waters in Florida, there are not enough monitoring data to make an assessment. EPA opted to assume that all unassessed waters would be in compliance with the numeric nutrient criteria rule. The report concluded that this assumption was not valid and that it led EPA to underestimate the number of newly impaired waters. A more defensible approach would consider the characteristics of unas-sessed waterbodies and their drainage areas to predict if they would fail to meet the numeric nutrient criteria.
Acreage of Land Draining to Incrementally Impaired Watersheds
After identifying newly impaired waterbodies, EPA delineated the drainage basin of the waterbody and determined the acreage of various land uses within that drainage basin. EPA used a relatively coarse “grid,” deined by the 10-digit hydrologic units code (or HUC-10). Each HUC-10 covers about a 227-square-mile area, and is generally too coarse for total
maximum daily load analysis. A more precise esti-mate of the potential incrementally affected acreage due to the new rule could have been performed with the same assumptions but with the 12-digit hydrologic unit code, which covers only 40 square miles and allows more precise delineation of the drainage areas contributing to various waterbodies.
Sector Cost Assessments
For each sector that discharges to inland waters, EPA estimated the incremental cost by multiplying the number of newly affected “units” by a per-unit treatment cost. For municipal and industrial point Box 1. Narrative Standards and
Numeric Nutrient Criteria
Florida currently uses a narrativestandard that states “in no case shall nutrient concentrations of a body of water be altered so as to cause an imbalance in natural populations of aquatic lora and fauna.” Implementing this standard involves carrying out detailed biological assessments for individual waterbodies.
In 2009 EPA determined that numericnutrient criteria would be necessary in Florida to meet the requirements of the Clean Water Act. Under numeric nutrient criteria, measured water body concentrations of nutrients are compared to the regional numeric
standards to determine if the water should be listed as impaired.
sources, EPA identiied the number of plants that would have to improve treatment in response to the numeric nutrient criteria rule, made assump-tions about the needed technological upgrades, and assigned a cost for the upgrades. For the stormwater and agricultural sectors, EPA esti-mated the acreage draining to the newly impaired waterbodies, reduced that acreage because of best management practices already in place, selected additional best management practices thought to be adequate to comply with the numeric nutrient criteria rule for the remaining acreage, and assigned a unit cost for those best management practices. For septic systems, EPA determined the number of systems within 500 feet of a newly impaired waterbody and multi-plied this number by the unit cost to upgrade septic systems to reduce their nutrient loads. Government costs were based solely on estimates of the administrative costs of developing addi-tional total maximum daily load calculations.
The report concluded that EPA underesti-mated the incremental cost for the stormwater, agricultural, septic system, and government sectors. There is signiicant uncertainty in the EPA cost estimate for the municipal and indus-trial wastewater sectors, making it dificult to know whether the EPA under- or over-estimated the incremental cost in these sectors.
In all sectors, the state’s current level of implementation of best management practices to reduce nutrient pollution was assumed by EPA to continue under the numeric nutrient criteria rule and to be satisfactory. However, the report concluded that the use of current best management practices is unlikely to be suficient to meet beneicial designated uses in Florida waters.
A Framework for Incremental Cost Analysis
of Rule Change
Because of limitations in the EPA analysis, the committee provided an alternative framework for cost analysis of a rule change. This alternative begins by taking a different approach than EPA to deining the incremental effect of the change to numeric nutrient criteria and the subsequent costs. The procedure is rooted in a comparison, over time, of how each of ive stages of water quality management occurs under the narrative rule (which is considered the baseline), under the EPA’s numeric nutrient criteria rule, and under a recently proposed Florida rule. These ive stages are (1) listing waters as impaired, (2) determining whether nutrients are the stressor, (3) deining the level of
nutrient reduction and writing the total maximum daily load, (4) total maximum daily load implementa-tion, and (5) determining that the waterbody has met its designated use. Discrepancies in the cost estimates of EPA and other stakeholders could be traced to different assumptions about how the rules would affect actions taken in each of the ive water quality manage -ment stages.
Timing and Cost Uncertainty
The three rules differentially affect the timing of the ive stages of water quality management, and as a result, also affect the realization of administrative and load control costs and water quality outcomes. Timing was not considered in the EPA report, even though the numeric nutrient criteria rule was proposed as a way to accelerate the restoration of nutrient-impaired waters. In reality, the speed with which actual water quality beneits are observed is constrained by the time required to conduct necessary studies and imple-ment load controls, and by available budgets and staff.
Future cost analyses of rule changes would more fully represent areas of possible costs differences if
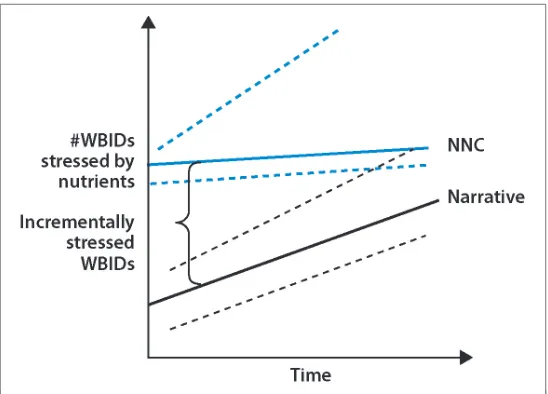
Figure 1. The incremental effect of the numeric nutrient criteria (NNC) rule is the difference between the blue and black lines over time, which in this example show predictions of the number of waterbodies listed as impaired by nutrients under the narrative and the NNC rules. Because EPA’s analysis assessed incremental effects at one timepoint, rather than into the future, EPA effectively assumed that the only incremental change was the initial new listing of impaired waters (the difference between the blue line and black lines at time zero). A more complete analysis would produce graphs like this that take into account the differences in how waterbodies are listed under the two rules and the impacts on cost over time. For example, because the narrative rule is based on biological
Committee to Review EPA’s Economic Analysis of Final Water Quality Standards for Nutrients for Lakes and Flowing
Waters in Florida: Glen T. Daigger (Chair), CH2M Hill, Inc.; Otto C. Doering (Vice Chair), Purdue University; Leonard A.
Shabman (Vice Chair), Resources for the Future; Walter L. Baker, State of Utah; Allen P. Davis, University of Maryland, College Park; K. William. Easter, University of Minnesota, St. Paul; Wendy D. Graham, University of Florida, Gainesville;
Arturo A. Keller, University of California, Santa Barbara; David J. Mulla, University of Minnesota, St. Paul; Kevin M.
Sherman, Quanics, Inc., Crestwood, Kentucky; Kurt Stephenson, Virginia Polytechnic Institute and State University;
Michael B. Tate, Kansas Department of Health and Environment; Alan H. Vicory, Ohio River Valley Water Sanitation Commission, Cincinnati; LaJuana S. Wilcher, English, Lucas, Priest & Owsley, L.L.P., Bowling Green, Kentucky; Laura J.
Ehlers (Study Director), Michael J. Stoever (Research Associate), Anita A. Hall (Senior Program Associate), National Research Council.
The National Academies appointed the above committee of experts to address the speciic task requested by the U.S. Environmental Protection Agency. The members volunteered their time for this activity; their report is peer-reviewed and the inal product signed off by both the committee members and the National Academies. This report brief was prepared by the National Research Council based on the committee’s report.
For more information, contact the Water Science and Technology Board at (202) 334-3422 or visit http://dels.nas.edu/wstb. Copies of Review of EPA’s Economic Analysis of Final Water Quality Standards for Nutrients for Lakes and Flowing Waters in Floridaare available from the National Academies Press, 500 Fifth Street, NW, Washington, D.C. 20001; (800) 624-6242; www.nap.edu.
Permission granted to reproduce this brief in its entirety with no additions or alterations. Permission for images/igures must be obtained from their original source.
© 2012 The National Academy of Sciences
Read or purchase this report and locate information on related reports at
http://dels.nas.edu/wstb
they were more explicit in describing the differences between the rules over time. Administrative, load control, and water quality opportunity costs could be reported as a cash low over time. Comparing the rules over time can provide an opportunity to present a realistic picture of how the timing of water quality improvement actions might unfold with alternative rules,
by illustrating the time lags between listing and achievement of water quality standards. It can also show both total and incremental costs. Most impor-tantly, reporting on timing would provide useful information for predicting annual
budgetary requirements.
Many assumptions are made in predicting administrative and load control costs over time, leading to uncertainty in cost analyses. This uncer-tainty—which can stem from such issues as a lack of knowledge about the cost of a relatively new technology, or about how implementation of the numeric nutrient criteria will be translated to efluent limits for point sources—was inadequately represented in the EPA analysis. In future analyses, reporting the difference in the time paths for imple-mentation of water quality management rules and
associated uncertainties would provide a more realistic way to compare costs of the different rules.
Transparency and Reconciling Sources of Disagreement The analyses carried out so far have done little to bridge the gaps between stakeholders. Indeed, EPA conducted its analysis in a manner that led some Florida stakeholders to view it as supericial or of limited scope, leading to reduced credibility. The result was to foster
disagreement about embedded assumptions rather than using the analysis to isolate and possibly reconcile sources of disagreement. Cost analysis rooted in the alternative framework can help convey cost estimates in a more transparent way and thus facilitate learning, reduce misunderstand-ings among stakeholders, and increase public conidence in the results. However, it is important to note that conducting an alternative cost analysis, with increased attention to careful assessment of rule differences, stakeholder engagement, and uncertainty analysis, might not have been possible with the budget and time EPA spent on it cost analysis. Any critique of the existing EPA cost analysis should recognize that some deiciencies may be traced to time and budget limitations. Mycrosystis (algae) bloom on the St. Johns River.