MAPPING OF ELECTROCHEMISTRY AND NEURAL NETWORK MODEL
APPLIED IN STATE OF CHARGE ESTIMATION FOR LEAD
ACID BATTERY USED IN ELECTRIC VEHICLE
Bambang Sri Kaloko
1.2*, Soebagio
1, and Mauridhi H. Purnomo
11
Department of Electrical Engineering, Sepuluh Nopember Institute of Technology Jl. Keputih Sukolilo Surabaya
2
Department of Electrical Engineering, University of Jember Jl. Slamet Riyadi 62 Jember
Received February 28, 2011; Accepted May 24, 2011
ABSTRACT
Analytical models have been developed to diminish test procedures for product realization, but they have only been partially successful in predicting the performance of battery systems consistently. The complex set of interacting physical and chemical processes within battery systems has made the development of analytical models of significant challenge. Advanced simulation tools are needed to be more accurately model battery systems which will reduce the time and cost required for product realization. As an alternative approach begun, the development of cell performance modeling using non-phenomenological models for battery systems were based on artificial neural networks (ANN) using Matlab 7.6.0(R2008b). ANN has been shown to provide a very robust and computationally efficient simulation tool for predicting state of charge for Lead Acid cells under a variety of operating conditions. In this study, the analytical model and the neural network model of lead acid battery for electric vehicle were used to determinate the battery state of charge. A precision comparison between the analytical model and the neural network model has been evaluated. The precise of the neural network model has error less than 0.00045 percent.
Keywords:Neural network, Back Propagation Network, Electrochemistry, Lead acid battery, State of Charge
INTRODUCTION
The need to develop electric vehicles arises not only due to the high price of international petroleum but also for solving the worsening environment problems. Energy management is the major key technology of battery powered vehicle [1]. The increase of energy density and efficiency, and accurate measurement of the state of charge (SOC) are important research topics [2-3]. Although many new electrochemical systems were studied for this application, the lead acid battery is still a leading candidate [4]. Measurement of the SOC of lead acid battery in battery powered vehicle was studied by electrochemical reaction [5]. The estimation of SOC of lead acid battery is a key point of energy management system in electric vehicle [6].
Many methods are used to improve the precision of SOC. Generally, the methods for measuring the SOC of the lead acid battery are: impedance method, and conductance method or resistance method [7-8]. In the previous study, the method was proposed to estimate the SOC of the battery by measuring the AC ripples during the charging state of the battery.
The internal resistance of the battery is used for the parametric fitting model. This method may not be accurate enough for the measurement of the SOC of the
lead acid battery in the electric vehicle because the internal resistance of the battery is not a constant [9]. This method applied only for the batteries of the same model are used for evaluating. This approach does not work anymore if the battery has some differences. The Coulometric method can measure the charge or discharge current of battery to solve the above disadvantages [10], because the Coulometric measurement method uses the summation method for the calculation, there will usually be several correction factors added to minimize the error and used together to determine the SOC. For example, during the charging period, the terminal voltage is measured, the rising slope of the voltage is measured too the end of discharge voltage.
The Ampere hours algorithm is commonly estimated the SOC. The battery capacity is calculated by multiplying the current by time of discharge [11-12]. The residual capacity is calculated by initial capacity minus capacity discharged.
hours algorithm together to achieve the SOC for electric vehicle [14]. The open circuit method, loaded voltage method and the Coulometric measurement method can be combined to measure the SOC of the battery in the battery powered vehicles [15].
Although the Coulometric method is convenient to use, however it still has disadvantages. The measurement of the battery is based on the actual current and rated capacity, while battery capacity depends on discharge current. The battery aging effect will also reduce the capacity, if it is not corrected, an error may occur. Modified Coulometric measurement method uses the Coulometric measurement method as the basis and considered the current additive effect and the battery aging factor [16].
As for considering the battery aging factor and the correction of its capacity, the correction of the SOC is determined by using the slope of the voltage over time during the battery discharge. During the initial period of the discharge, the voltage of each battery is approximately the same. While more than 70% of the capacity is being discharged, the voltage of the severely old battery will decrease drastically. Thus, such property can be used to correct the SOC of the old battery [15-17].
Neural network establishes a relationship between input and output data, which uses voltage, current, temperature as its input and the SOC as output. In order to train this artificial neural network based model, the data were collected after a series of the designed experiments carried out using the battery evaluation and testing system with the wide range of discharge current and temperature [18-20]. The virtue of the method is that it can be applied to the battery systems.
As mentioned above, the reaction of the electrode of the battery is strongly and directly related to the SOC. In this paper, the proposed measurement method of the SOC of the lead acid battery is to use the basic theory of electrochemistry to determine the electrochemical reaction parameters related to the SOC. The research in recent years emphasizes the electrodynamics of the charge transfer reaction [16,21]. These effects are the important factors that cause the conversion of chemical energy into electrical energy. In this paper, the electrochemical theory for these reactions of the electrode is used to calculate the chemical parameters for the electrode reaction and the circuit is also designed to calculate the variation of the electrochemical parameters of the battery to measure the SOC of the lead acid battery. In this paper, not only the analytical model is introduced, but also the neural network model is discussed. In addition, the lead acid battery is used to verify the precision of lead acid battery model.
EXPERIMENTAL SECTION
Materials
Lead acid battery type 46B24L produced by PT. GS Battery. Meanwhile the structure of battery by Ying et al from lead acid battery data bank was obtained and employed as the virtual target [5].
Instrumentation
Mathematical Laboratory (Matlab) version R2008b (developed by MathWorks, Natick, Massachusetts) was employed to perform the simulation procedures and developer of mathematical computing. All computational simulations were performed on a Window machine with Intel Dual Core 2GHz as the processors and 1 GB of RAM.
Procedure
SOC Algorithm for Lead Acid Battery Using Electrochemistry
The cell reaction is a chemical reaction that characterizes the battery. When the battery is discharged, chemical compounds of higher energy content are converted by this reaction into compounds of lower energy content. Usually the released energy would be observed as heat. But in a battery, the cell reaction is divided into two electrode reactions, one of them releases electrons and the other absorbs electrons, and then the flow of electrons forms the current that can be drawn from the battery. Thus, the generation or consumption of energy connected to the cell reaction is directly converted into an electric current. The redox reaction of the electrodes of the lead acid battery can be expressed as:
( )s 2( )s 2 2 4(aq) 2 4( )s 2 2 ( )l
Pb PbO H SO PbSO H O (1)
SOC Algorithm for Lead Acid Battery Using Neural Network
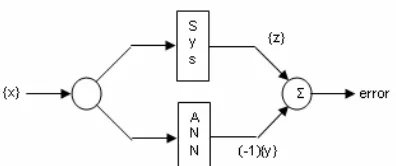
Fig 1. Diagram of ANN model simulating a physical system
Fig 2. Diagram of a multi-layered Back Propagation network
The ANN can be used in a variety of frameworks to simulate many types of system behavior including electrochemical system. The ANN requires training data to learn patterns of input/output behavior and it can be used to simulate system behavior of in the training space. This network done by interpolating specified inputs among the training inputs to yield output that are interpolations of training outputs.
The purpose of mapping ANN can be expressed mathematically using the following input/output notation and terminology. Suppose {x} represent a vector of inputs system. The system will be simulated to operate on the data in {x}, yielding an output vector {z}. There is a functional relationship, {z} = g ({x}), for {z} and {x} with the function g(.) is assumed to be deterministic but unknown.
Since the ANN is built, so that it can also be used to operate on the input {x} to yield {y}=h({x}). The function h(.) is deterministic, it has a pre established framework and the parameters {p}. The function h(.) will be an approximation to the system function g(.). Given a sequence of examples of input/output {xj} and {zj}, j = 1,…R. The parameters {p} of the ANN are adjusted to minimize the error between actual system output {z} and the ANN output {y}, when presented with the same input {x}. This is achieved through a training process that involves error minimization through the variation of the parameters {p}. The first training is completed and expected to be given the input {x} which is different from that used during trainings. The ANN will yield outputs {y} that are accurate estimations of the outputs {z} produced by the system being modeled. The ANN serves as an interpolator between the output vector as a function of
the position of the input vector. A diagram of this process is shown in Fig. 1.
There are a number of ANN architectures available for electrochemical simulation. Although there are many types of ANN to solve the problem, the method used to model of lead acid battery is feedforward back propagation network (BPN). Fig. 2 shows the BPN network with an input layer, hidden layer, and an output layer.
The operations in each neuron of a BPN are shown in Equation (2). Where ykrepresents the output of neuron k, while yj and wkj represent the output from neuron j in the previous layer and the corresponding weighting factor.The quantity θk is a bias or threshold for offset in the neuron activation.
1
When an input is given to the BPN, it can be fed forward through the entire network to get the output. This output can be compared to the output exemplar, and the ANN parameters can be adjusted to diminish the difference between the ANN output and the training output. The training of the BPN involves the error from the output layer to the input layer. The training procedure commonly known as the delta rule uses the back propagated error to optimize the weights of the network. Simulation of the battery system is developed from simple constant load discharge to more complex and practical simulations including variation load pulses. Result of the model developments is presented in the following discussion.
RESULT AND DISCUSSION
Electrochemistry Model Analysis And SOC
Estimation
The chemical energy of the battery is converted into the maximum electrical energy, which can be expressed by Gibbs energy. Meanwhile, the voltage of the battery can be expressed by Nernst equation as follows [22]:
where R is the gas constant, T is the temperature of the battery.
When the current I is extracted and flown through the battery, an electrochemical reaction with the electrode will cause activation and concentration polarization.
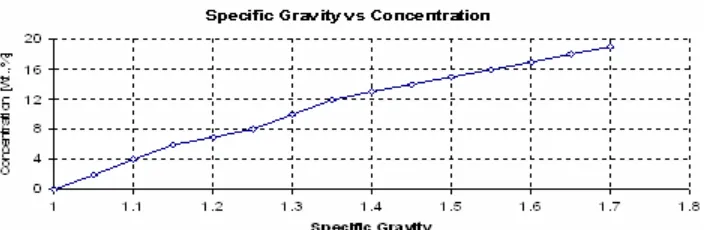
Fig 3.The relation between the concentration and specific gravity of the sulfuric acid
Fig 4.Analitycal model of the SOC at 2, 5, 10 and 15 ohms (T=25 °C)
Table 1.The relation between the SG and the SOC[5]
SOC (%) SG
100 1.33
75 1.3
50 1.27
25 1.24
0 1.21
f f O
i nAFK C
b b R
i nAFK C (4)
where COand CRis the concentration of the solution on the oxidation and reduction agent, whereas A is the electrode surface area. In the balance state there is no current generated, thus the electric potential in balance can be obtained by:
0
0 0
ln f ln
e
b R
C K
RT RT
E
nF K nF C
(5)
Equation (5) can be used to express the Nernst equation by including the concentration of H2SO4 as C0 and the concentration of H2O as a CR. If the resistance of electrolyte Rbican be measured, and the battery current with an external load can also be measured, then the terminal voltage of the battery as:
0 bi
EP
V E IR
E IR
(6)
where REP represents the impedance generated by the reaction of the electrode, then the terminal voltage of the battery can obtain:
0 ln 0
R
C RT V E
nF C
(7)
The electric circuit of the battery can be designed by determine of C0 and CR, and then the SOC of the battery can be obtained after obtaining the values of C0 and CR.
The measured voltage and current of the battery during the experiment are determined to obtain the CO/CRratio. The measured concentration of the sulfuric acid can be used to determine the specific gravity of the electrolyte. Then the relation between the specific gravity and the SOC can be used to obtain the SOC of the battery. Fig. 3 shows the relation between the concentration and the specific gravity. The relation between the specific gravity (SG) and the SOC are listed in Table 1[5].
Figure 4 shows the simulation of a constant load discharge at 2, 5, 10, and 15 ohms. The simulation of analytical model state of charge is able to provide very good for loads between 2 and 15 ohms.
Neural Network Model Analysis and SOC
Estimation
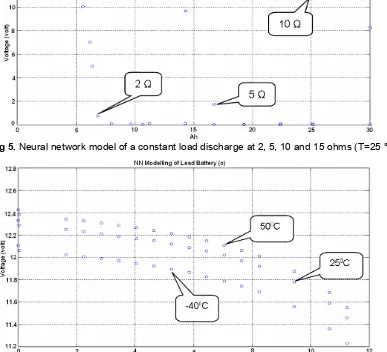
Fig 5.Neural network model of a constant load discharge at 2, 5, 10 and 15 ohms (T=25 °C)
Fig 6.Neural network model of a constant load discharge at -40 °C, 25 °C and 50 °C (load 5 ohm)
Table 2. Variation load and temperature data available for ANN simulations.
Load (ohm) Temperatures (°C)
2 -40, 25, 50
5 -40, 25, 50
10 -40, 25, 50
15 -40, 25, 50
Specifically, the constant load discharge data available for training are outlined in Table 2.
The hope is that these data could be used to train a BPN which could be used to simulate pulse loads between 2 and 15 ohms, with temperature variations between -40 °C and 50 °C. Note, the independent temporal variable has been converted from time to current capacity used to introduce the normalization of the temporal variable. The pulse load simulation was
performed in an attempt to identify how the battery capacity can be generated varies according to load conditions. The capacity of the battery cell is measured to determine changes with load.
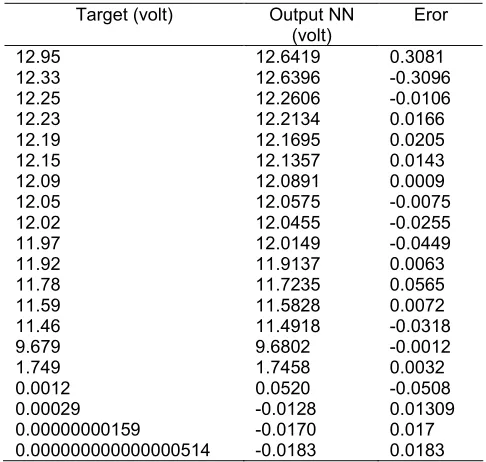
Fig 7.ANN comparison to experimental data when trained with analytical data at 5 ohm (T=25 °C)
Table 3. Simulation data of the lead acid battery type 46B24L.
Target (volt) Output NN (volt)
Eror
12.95 12.6419 0.3081
12.33 12.6396 -0.3096
12.25 12.2606 -0.0106
12.23 12.2134 0.0166
12.19 12.1695 0.0205
12.15 12.1357 0.0143
12.09 12.0891 0.0009
12.05 12.0575 -0.0075
12.02 12.0455 -0.0255
11.97 12.0149 -0.0449
11.92 11.9137 0.0063
11.78 11.7235 0.0565
11.59 11.5828 0.0072
11.46 11.4918 -0.0318
9.679 9.6802 -0.0012
1.749 1.7458 0.0032
0.0012 0.0520 -0.0508
0.00029 -0.0128 0.01309
0.00000000159 -0.0170 0.017
0.000000000000000514 -0.0183 0.0183
capacity when moving from one temperature to another especially for low temperature.
The next further tests are performed toward the separate rules for transition between loads and temperature, they are more completely understood. We currently have experimental data taken under this type of condition. Specifically, the temperature cycle consists of a cold, an ambient and a hot level while the load is a moderate on pulse level. Constant load discharge curves
are still being developed for the load range needed for this test. Due to constant load discharge data were available at three different temperatures, an arbitrary simulation was done to predict the battery voltage using a BPN network trained with load and temperature inputs.
The important characteristics to note in this pulse profile are the ability of the network to predict the change in voltage from one temperature to another and that more capacity can be delivered when moving from a lower temperature to a higher temperature. An example of the network prediction a reduction in voltage moving from a higher to a lower temperature is shown below near 11 Amp hours of capacity removed. Here, the network predicts a reduction of about 0,320 volts as the temperature is lowered from 50 °C to -40 °C. Near 19 Amp hours removed, the simulation suggests that no voltage output from the cell as the temperature be lowered from 50 °C to -40 °C, but it shows that the capacity still exists when the temperature is returned to ambient. These types of responses shown in the simulation are clearly representative of the battery behavior seen in analytical model and further analysis with ANN will increase our understanding of discharge behavior under both constant and pulsed conditions.
Analytical models, however, are able to provide information regarding "local dynamics" that are more difficult for ANN to capture when being trained over a large inputs space. An analytical model has been developed for the Pb/PbO cell, but it is computationally very intensive and it can also take several hours to run. In an attempt to take advantage of the strengths of both analytical and ANN models, preliminary steps have been taken to develop a "hybrid" model. Fig. 7 details the results of our preliminary study using both the analytical and ANN models to simulate the lead acid battery system. Discharge data used to train the BPN had a slightly lower voltage level than the actual pulsed data at that load, which is reflected in this simulation.
A neural network was used to model cell impedance for input to the analytical model because developing a functional relationship for this parameter would be very difficult. By using the ANN model of the cell impedance, the analytical model was used to generate constant load discharge curves at 2 until 15 ohms. These analytical data were used to train the BPN within the 2–15 ohm input space at 25 °C. The trained BPN was used to simulate a discharge at 5 ohm. The discharge data available for training are outlined in Table 3.
There are two classes of uncertainty of issues that affect the specification and use of ANN. First, because the ANN is a non-phenomenological model of system behavior, the map that is learned by an ANN cannot precisely replicate the map that is the source of its input/output exemplars. That is, the ANN is an uncertain representation of the source map. The training techniques used to identify the parameters of ANN are designed to minimize the error with this origin. In practice, there is always a fact that the input/output exemplars presented to an ANN during training, contains measurement noise. This precludes the possibility that the exemplars exactly represent system behavior. The problem is mitigated by the fact that training procedures for ANN typically yield models which average through the measurement noise yielding an average model of system input/output behavior. Secondly, uncertainty issue regarding the use of ANN. Under certain circumstances, the inputs to an ANN may be random variables or random processes. In this case, the inputs map to random output, as they would with any deterministic map. The ANN can be used in the same way where a phenomenological model is used to establish the probability distribution of one or more random output given information on random inputs. In fact, because of its relative, accuracy, and computational efficiency, ANN sometimes used as substitutes for analytical models where numerous model runs are required.
CONCLUSION
The reason for using ANN to simulate the system behavior is that they provide accurate estimations of system behavior and are much more computationally efficient than the phenomenological models. Artificial neural networks are inductive models for simulating input/output mapping with certain advantages over analytical models, especially for complex systems. Among these advantages are the ability to avoid making measurement of hard to determine physical parameters or having to understand cell processes sufficiently to write mathematical functions describing their behavior. The behavior of system with ANN is learning based on training by providing examples of measuring output for various input conditions. In the battery case, the inputs can include many factors, such as the chemistry, state of charge, load profile, size, temperature, and the environment while the output may be in its voltage, current, or capacity. The ANN is efficiently accomplishing this simulation without extensive identification of physical parameters such as cell impedance or diffusion characteristics required in parametric models. When using and modeling battery systems with ANN, time consumption and difficult measurements of the fundamental cell parameters are not necessary since only electrical performance data under the conditions of interest are used for training.
These initial efforts on battery modeling have proven to be very effective, and more complex simulations of battery behavior will be performed. Additional tools like genetic algorithm and/or genetic programming may be used to establish more accurate transition rules. With advanced study of ANN modeling and further development of the parametric model, additional simulations can be performed using the hybrid model to help efficient design and optimize robust battery systems.
By means of analytical and neural network model analysis, a precision of comparison of the SOC battery have been evaluated. Comparison between experimental data and calculated data concluded on proposed method. The precise of the neural network model has error less than 0,00045 percent. The result shows that the precision neural network model is good and very accurate.
ACKNOWLEDGEMENT
Journal of Chemistry, which is very valuable guidance in preparing the manuscript of my research.
REFERENCES
1. Jinrui, N., Fengchun, S., and Qinglian, R., 2006, A Study of Energy Management System of Electric Vehicles, IEEE Vehicle Power and Propulsion Conference, September 2006, 1–6.
2. Yang, Y. P., and Hu, T. H., 2007, A New Energy Management System of Directly Driven Electric Vehicle with Electronic Gearshift and Regenerative Braking, American Control Conference, ACC '07, July 2007, 4419–4424.
3. Livint, G., Horga, V., Albu, M., and Ratoi, M., 2006, Testing Possibilities of Control Algorithms for Hybrid Electric Vehicles, The 2nd WSEAS International Conference on Dynamical Systems and Control, October 2006, 47–52.
4. Mischie and Toma, L., 2008, WSEAS Trans. Power Syst., 3, 3, 111–117.
5. Ying, S.S., Ding, T.S., Yang, J.L., and Rong, W.H., 2008, WSEAS Trans. Power Syst., 7, 10, 1092– 1103.
6. Jung, D.Y., Lee, B.H., and Kim, S.W., 2002, J. Power Sources, 109, 1, 1–10.
7. Lacressonniere, F., Cassoret, B., and Brudny, J., 2005, IEE Proc. Electr. Power Appl., 152, 5, 1365– 1370.
8. Robinson, R.S., 1993, J. Power Source, 42, 381– 388.
9. Pascoe, P.E., Sirisena, H., and Anbuky, A.H., 2002, Coup de Fouet Based VRLA Battery Capacity Estimation, The First IEEE International Workshop on Electronic Design, Test and Applications Proceedings, January 2002,149–153.
10. Kiehne, H.A., 2003, Battery Technology Handbook 2ndEd., Marcel Dekker, NY.
11. Koehler, U., and Schmitz, C., 2001, Nickel metal hydride batteries for hybrid vehicles and new vehicle power supply systems, Proceedings of EVS.
12. Stiegeler, M., Frey, T., Rohr, S., and Kabza, H., 2005, The battery management system for lead acid battery with calibration using charge and discharge rest voltage characteristic, Proceedings of EVS.
13. Salameh, Z.M., Casacca, M.A., and Lynch. W., 1992,IEEE Trans. Energy Convers., 7, 1, 93–98. 14. Onishi, M., Miyata, T., Goto, H., Sonobe, H., Isogai,
M., Emori, A., Kinoshita, T., and Nakanishi, M., 2001, Ni/MH battery system for HEV applications, Proceedings of EVS.
15. Caumont, O., Moigne, P.L., Rombaut, C., Muneret, X., and Lenain, P., 2000, IEEE Trans. Energy Convers., 15, 3, 354–360.
16. Barsali, S., and Ceraolo, M., 2002, IEEE Trans. Energy Convers., 17, 1, 16–23.
17. Henry, A.C., Fred, F.F., and Francisco, T., 2004,J. Power Sources, 129, 1, 113–120.
18. Chan, C.C., Lo, E.W.C., and Weixiang, S., 2000, The new calculation approach of the available capacity of batteries in electric vehicles, Proceedings of EVS 17.
19. Singh. P., and Reisner, D., 2002, Fuzzy logic-based state of health determination of lead acid batteries, Proceedings of Telecommunications Energy Conference, 583–590.
20. Kaloko, B.S., Purnomo, M.H., and Soebagio, Neural Network Modeling of Lead Acid Battery System, Proceeding of International Conference on Chemical Sciences, 157, Jogjakarta, October 2010. 21. Linden, D., Handbook of Batteries, 2nd Ed.,
McGraw Hill, New York, 1995.