SINGLE-LAYER DRYING BEHAVIOR OF RED CHILI
Junaedi Muhidong, Supratomo, Nur Fitri Ramadhani
Agricultural Engineering Department, Faculty of Agriculture, Hasanuddin University. Kampus Tamalanrea 90245, South Sulawesi, Indonesia
Email: [email protected]
ABSTRACT
This study was designated to determine the best model that could represent the behavior of the moisture content of cut red-chili, Tombak variety, during the single layer drying process. A Tray Dryer Model EH-TD-300 Eunha Fluid Science was used to support the experiment. The dryer was constructed to fl ow the drying-air parallel with the crop observed. Three levels of drying air velocity (1.0 m/s, 1.5 m/s, and 2.0 m/s) were applied under a constant drying air temperature of 47oC. The average relative humidity (RH) in the drying chamber during the drying period was around 39%. The
results of this study strongly suggested that the Hii et al. (2008) model, MR = 0.76832.exp(-0.06607.t1.43089) + 0.25351.
exp(-0.06881.t1.43089) and MR = 0.76758.exp(-0.10141.t1.47651) + 0.30562.exp(-0.10018.t1.47651), were the best model in
predicting the moisture behavior of the cut chili, Tombak variety, across the elapsed drying time when the drying air velocities were set to 1.5 m/s and 2.0 m/s, respectively. However, the Diffusion Approach model, MR = -0.02821. exp(0.01340.t) + (1.02821)).exp(-0.107576.t), was observed to be the best model at the drying air velocity of 1.0 m/s.
Keywords: single-layer drying, chili
INTRODUCTION
Chili is one of the strategic crops in Indonesia. Bank Indonesia (2007) reported that the average chili consumption in Indonesia, especially in Java island, was about 5.9 g/ person/day or about 2.2 kg/person/year. Chili production in this country, as indicated by BPS (2010), was about 1.4 and 1.3 million tons in 2009 and 2010, respectively. About half of these productions were coming from East, West, and Central Java areas. South Sulawesi alone produced about 21 thousand tons in 2009 and about 27 thousand tons in 2010.
The moisture content of fresh chili can reach up to around 90% wet-basis. With such high moisture, chili becomes perishable. Tempo Interactive media reported that chili price in January 2011 hit Rp.100,000.-/kg. This price, however, sharply decreased down to about Rp.2,500,-/kg in May 2011, as indicated by the media interactive of Medan Bisnis on May 18, 2011. Price fl uctuation was mostly dictated by the unbalance between demand and supply. To avoid such unbalance situation, the storage time of fresh chili should be improved or any excessive production is dried and kept at lower moisture content to allow a safe storage.
This study was focused to explore the single-layer drying characteristics of chili using a mechanical dryer. Similar studies were conducted by Tuntiwaranuruk and Mani (2009),
steady or various levels of drying temperature. In contrast, this research was exercised a fi xed drying temperature with a range of air velocities.
RESEARCH METHODOLOGY
This research was carried out at the Crop Processing Laboratory of Agricultural Engineering Department, Hasan-uddin University during the period of January to May 2011. Main equipment used was the Tray Dryer Model EH-TD-300 Eunha Fluid Science. The dryer was constructed to fl ow the drying-air parallel with the dried crop and equipped with wet and dry bulb thermometers in its drying chamber. A digital balance was applied to record the weight of the samples across elapsed drying period. Chili used was a Tombak variety, obtained from local chilifarmers in Gowa Regency, South Sulawesi. The initial moisture content was around 90% wet basis.
Three levels of air velocity, v, (1.0, 1.5, and 2.0 m/s) under a constant drying temperature of 47oC were applied in
sample was divided into two sub-samples to improve the accuracy of the observation. For each drying run, the dryer was loaded with two sub-samples of each sample arranging in a single layer batch in such away the thickness of the sample was about equal to the chili diameter. With this approach, the samples were exposed to the same drying air temperature and velocity. The weight of each sub-sample was around 100 g. The drying process was terminated when the weight of the sub-sample had reached a constant value for about 5 hours. The sub-sample was then oven-dried to get its dry weight. With this dry weight, the sub-sample weights across elapsed drying time were converted into a wet-basis and dry-basis moisture contents (Mcwb and Mcdb). The average value of the moisture contents of the two sub-samples was taken to represent the moisture content of each sample for each drying condition. This was allowed to establish three Mcdb data sets, one set for each drying air velocity level. All calculated Mcdb were transformed into moisture ratio for elapse drying time (MR(t)) using the following formula:
Me Mo
Me Mc
MRt t
− −
= ()
) (
Where:
Mo = Initial Mcdb (% dry basis)
Mc(t) = Mcdb at elapsed drying time t (% dry basis)
Me = Equilibrium moisture content (% dry basis) using the fi nal Mcdb of each drying run.
The characteristics of the moisture ratio across the drying time were then fi tted to the thin layer drying models presented in Table 1. These models were used by Muhidong et al. (1992), Kingsly et al. (2007), Yadollahinia et al. (2008), Hii et al. (2008) and Ibrahim et al. (2009).
The values of each drying constant involved in the drying models was determined using a TABLECURVE 2D® V5.01 TRIAL VERSION extracted from http://www. sigmaplot.com/products/tablecurve2d/tablecurve2d.php in March 2011. The best fi tted model was selected based on its R2, Chi-Squared, and RMSE values. A model with the highest
R2, and the lowest Chi-Squared and RMSE (Root Mean
Squared Error) values will be considered as the best model to represent the behavior of the chili moisture contents during the single-layer drying process.
RESULTS AND DISCUSSIONS
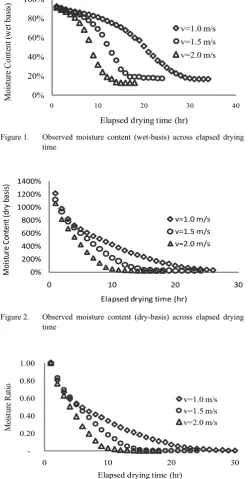
The main result of this research was the behavior of the moisture contents across the elapsed drying time as shown in Figures 1 and 2. The fi rst fi gure represented the reduction of the Mcwb during the drying process. It also served as a drying curve in which surface and bound moistures can be located. This fi gure strongly indicated that a constant drying rate period, a process of releasing surface moisture, occurred prior to the elapsed drying times of around 25, 20, and 15 hours for v=1.0 m/s, v=1.5 m/s, and v=2.0 m/s, respectively. The falling rate then took place after these periods until the end of the drying time. The average relative humidity (RH) in the drying chamber during the drying period was about 39%. Figure 2 provided information regarding the reduction pattern of the Mcdb. The exponential pattern was strongly demonstrated in this fi gure. The values of Mcdb at the end of each drying run which served as an equilibrium moisture content, Me, were found to be equal to 19.6%-db, 20.5%-db, and 14.7%-db for v=1.0 m/s, v=1.5 m/s, and v=2.0 m/s, respectively. This information was then used to determine the MR across the elapsed drying time for each drying run, Figure 3.
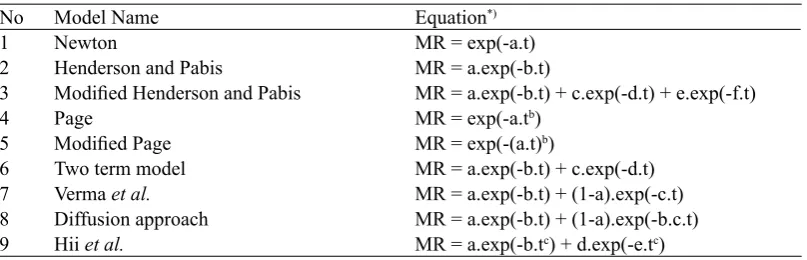
Table 1. Thin layer drying models tested in the experiment No Model Name Equation*)
1 Newton MR = exp(-a.t) 2 Henderson and Pabis MR = a.exp(-b.t)
3 Modifi ed Henderson and Pabis MR = a.exp(-b.t) + c.exp(-d.t) + e.exp(-f.t) 4 Page MR = exp(-a.tb)
5 Modifi ed Page MR = exp(-(a.t)b)
6 Two term model MR = a.exp(-b.t) + c.exp(-d.t) 7 Verma et al. MR = a.exp(-b.t) + (1-a).exp(-c.t) 8 Diffusion approach MR = a.exp(-b.t) + (1-a).exp(-b.c.t) 9 Hii et al. MR = a.exp(-b.tc) + d.exp(-e.tc)
Figure 1. Observed moisture content (wet-basis) across elapsed drying time
Figure 2. Observed moisture content (dry-basis) across elapsed drying
time
Figure 3. Trend of Moisture Ratio (MR) across elapsed drying time
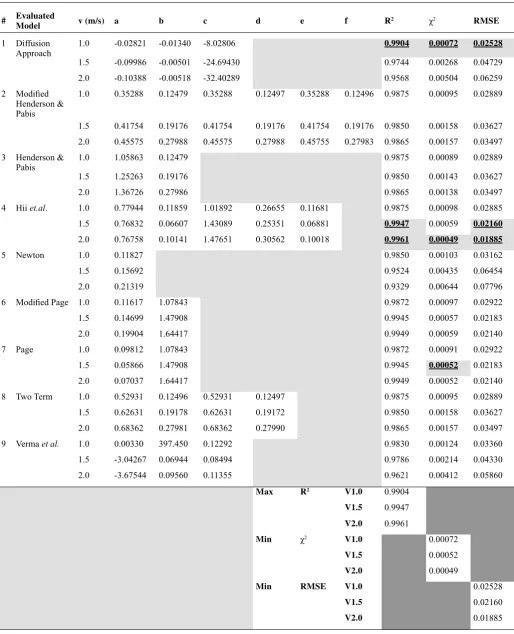
The drying models were fi tted to the MR data set across elapsed drying time and evaluated their goodness of fi t. During the fi tting process, drying constants involving in the models were calculated and their results were displayed in Table 1. This table also presented the R2, Chi-squared and
RMSE values.
The exponential pattern exhibited by the MR as shown in Figure 3 was undeniably relevant to all alternative models proposed in this study. It was also observed that the drying
rates resulted from three different drying air velocities as depicted in Figures 1 and 2 also confi rmed that varying drying air velocities would affect the drying rates of cut chili. This phenomenon supported the argument that the goodness of fi t evaluation of each model should be carried out on each drying run as shown in Table 2.
Based on the values of R2, Chi-squared, and RMSE, it
was obvious that the Hii et al.(2008) models, MR = 0.76832. exp(-0.06607.t1.43089) + 0.25351.exp(-0.06881.t1.43089) and MR
= 0.76758.exp(-0.10141.t1.47651) + 0.30562.exp(-0.10018.
t1.47651), were the best models to predict the behavior of the
moisture contents of the cut chili, as represented by the MR values, across the elapsed drying time at high drying air velocity, 1.5 and 2.0 m/s respectively. Its R2 values reached
up to 0.99 with very small values of Chi-squared and RMSE, as low as 0.00049 and 0.01885. At lower drying velocity, v=1.0 m/s, however, the Diffusion Approach model, MR = -0.02821.exp(0.01340.t) + (1.02821)).exp(-0.107576.t), performed much better than the other models (R2=0.99,
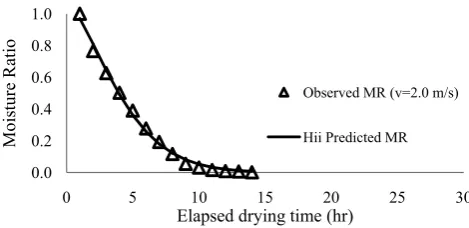
Chi-squared=0.00072, and RMSE=0.02528). Figures 4, 5 and 6 demonstrated the goodness of fi t of these two models in predicting the MR values across the elapsed drying time. Table 2 also showed that the Page model was the third best model after the Hii et al.(2008) and Diffusion Approach models.
Figure 4. Observed Moisture Ratio (MR) vs. predicted values of the Diffusion ApproachModel at the drying air velocity of 1.0 m/s
Figure 5. Observed Moisture Ratio (MR) vs. predicted values of the Hii
et al.(2008) Model at the drying air velocity of 1.5 m/s 0%
Elapsed drying time (hr) v=1.0 m/s
Elapsed drying time (hr)
Table 2. The values of drying constants, R2, χ2 (Chi-squared), and RMSE for each model evaluated at three levels of drying air
velocity
# Evaluated
Model v (m/s) a b c d e f R
2 χ2 RMSE
1 Diffusion Approach
1.0 -0.02821 -0.01340 -8.02806 0.9904 0.00072 0.02528
1.5 -0.09986 -0.00501 -24.69430 0.9744 0.00268 0.04729
2.0 -0.10388 -0.00518 -32.40289 0.9568 0.00504 0.06259
2 Modifi ed Henderson & Pabis
1.0 0.35288 0.12479 0.35288 0.12497 0.35288 0.12496 0.9875 0.00095 0.02889
1.5 0.41754 0.19176 0.41754 0.19176 0.41754 0.19176 0.9850 0.00158 0.03627
2.0 0.45575 0.27988 0.45575 0.27988 0.45755 0.27983 0.9865 0.00157 0.03497
3 Henderson & Pabis
1.0 1.05863 0.12479 0.9875 0.00089 0.02889
1.5 1.25263 0.19176 0.9850 0.00143 0.03627
2.0 1.36726 0.27986 0.9865 0.00138 0.03497
4 Hii et.al. 1.0 0.77944 0.11859 1.01892 0.26655 0.11681 0.9875 0.00098 0.02885
1.5 0.76832 0.06607 1.43089 0.25351 0.06881 0.9947 0.00059 0.02160
2.0 0.76758 0.10141 1.47651 0.30562 0.10018 0.9961 0.00049 0.01885
5 Newton 1.0 0.11827 0.9850 0.00103 0.03162
1.5 0.15692 0.9524 0.00435 0.06454
2.0 0.21319 0.9329 0.00644 0.07796
6 Modified Page 1.0 0.11617 1.07843 0.9872 0.00097 0.02922
1.5 0.14699 1.47908 0.9945 0.00057 0.02183
2.0 0.19904 1.64417 0.9949 0.00059 0.02140
7 Page 1.0 0.09812 1.07843 0.9872 0.00091 0.02922
1.5 0.05866 1.47908 0.9945 0.00052 0.02183
2.0 0.07037 1.64417 0.9949 0.00052 0.02140
8 Two Term 1.0 0.52931 0.12496 0.52931 0.12497 0.9875 0.00095 0.02889
1.5 0.62631 0.19178 0.62631 0.19172 0.9850 0.00158 0.03627
2.0 0.68362 0.27981 0.68362 0.27990 0.9865 0.00157 0.03497
9 Verma et al. 1.0 0.00330 397.450 0.12292 0.9830 0.00124 0.03360
1.5 -3.04267 0.06944 0.08494 0.9786 0.00214 0.04330
2.0 -3.67544 0.09560 0.11355 0.9621 0.00412 0.05860
Max R2 V1.0 0.9904
V1.5 0.9947
V2.0 0.9961
Min χ2 V1.0 0.00072
V1.5 0.00052
V2.0 0.00049
Min RMSE V1.0 0.02528
V1.5 0.02160
Figure 6. Observed Moisture Ratio (MR) vs. predicted values of the Hii et al.(2008) Model at the drying air velocity of 2.0 m/s.
The above result seemed to be different from the one reported by Tuntiwaranuruk and Mani (2009). These researchers discovered that the Page model was the best model for a thin-layer drying process of chili when the drying temperatures were set equal to 45, 50, 55, and 60oC
under a constant drying air velocity of 1.0 m/s. In their study, however, the Hii et al.(2008) and Diffusion Approach models were not parts of the models being evaluated. If these two models were included in their analysis, the results could have been similar to this study.
CONCLUSIONS
Among nine models evaluated, it was discovered that the Hii et al. (2008) model is the most appropriate model to represent the behavior of the moisture contents of the cut chili, Tombak variety, during the single-layer drying process with the drying air velocities of 1.5 and 2.0 m/s under a steady drying temperature of 47oC. On the other hand, the Diffusion
Approach model is found to be the most suitable model at the drying air velocity of 1.0 m/s.
REFERENCES
Bank Indonesia (2007). Pola pembiayaan usaha kecil syariah (PPUK-SYARIAH): usaha budidaya cabai merah (Funding structure of small scale “syariah” chili business). h t t p : / / w w w. b i . g o . i d / N R / r d o n l y r e s / 4 0 7 6 2 4 E 9
-3 D 2 1 - 4 7 1 A - 8 0 9 9 - C -3 8 1 2 A C 4 E D 2 B / 1 6 0 5 -3 / BudidayaCabaiMerahSyariah.pdf. [May 26, 2011]. Biro Pusat Statistik (2010). Harvest area, production and
productivity of chili, Indonesia, 2009-2010. http:// www.bps.go.id/tab_sub/view.php?tabel=1&daftar=1& id_subyek=55¬ab=19. [May 26, 2011].
Hii, C.L., Law, C.L. and Cloke, M. (2008). Modeling of thin layer drying kinetics of cocoa beans during artifi cial and natural drying. Journal of Engineering Science and Technology 3(1): 1 - 10.
Ibrahim, M., Sopian, K. and Daud, W.R.W. (2009). Study of the drying kinetics of lemon grass. American Journal of Applied Sciences 6(6): 1070-1075.
Kingsly, A.R.P, Singh, R., Goyal, R.K. and Sigh, D.B. (2007). Thin-layer drying behavior of organically produced tomato. American Journal of Food Technology 2(2): 71-78.
Medan Bisnis (2011). Harga cabe terus anjlok (Chili price continuously declined). www.medanbisnisdaily. com. [May 26, 2011].
Muhidong, J., Chen, L.H. and Smith, D.B. (1992). Thin-layer drying of kenaf. Transactions of the ASAE 35(6): 1941– 1944.
Tempo Interaktif (2011). Kegarangan harga cabai perlahan memudar (Chili extremely-high price gradually went down). Media Interactive. http://www.tempo.co/hg/ bisnis/2011/01/06/brk,20110106-304367,id.html. [May 26, 2011].
Toyosi, Y. Tunde-Akintunde, and Ajala, A. (2010). Air drying characteristics of chili pepper. International Journal of Food Engineering 6(1): Article 7.
Tuntiwaranuruk, U. and Mani, M. (2009). A thin layer drying model of chili. The 35th Congress on Science and Technology of Thailand, October 15-17, 2009.
Yadollahinia, A.R., Omid, M. and Rafi ee, S. (2008). Design and fabrication of experimental dryer for studying agricultural products. International Journal of Agricul-ture and biology 10(1): 61–65.
0.0 0.2 0.4 0.6 0.8 1.0
0 5 10 15 20 25 30
Moisture Ratio
Elapsed drying time (hr)
Observed MR (v=2.0 m/s)