Summary We established linear and exponential relation-ships between leaf area (A) and leaf length (L), leaf width (W), W2, L2 and LW, in Salix viminalis L. Most relationships were significantly non-linear, but good fits were obtained with both linear and exponential models. The nonlinear relationship be-tween A and LW differed for leaves from sylleptic and proleptic shoots. Leaves from sylleptic and proleptic shoots also differed in specific leaf area (area/weight). Leaf shape (width/length ratio and position of maximum leaf width) changed with leaf size and differed for leaves from sylleptic and proleptic shoots. Leaf area could be modeled adequately using implicit shape descriptions. Agood fit was obtained when the basal and distal parts of the leaf were described as aparabola and an ellipse, respectively. The average area of single leaves and specific leaf area increased both along vertical profiles within shoots and during the growing period. Our results (1) indicate that non-linear models should be used to estimate leaf area from non-linear leaf dimensions for plant species with leaves that vary in shape with leaf size, and (2) demonstrate the dependence of leaf characteristics on both sampling date during the growing sea-son and spatial position in the canopy.
Keywords: allometric relations, isometric relations, leaf shape, leaf size, specific leaf area.
Introduction
In Swedish short-rotation forestry, fast-growing monocultures of basket willow (Salix viminalis L.) are grown at dense spac-ings on fertile soils to give ahigh production of biomass for use as fuel (Sirén 1983). The cultivation of basket willow as a commercial agricultural crop is expanding rapidly in Sweden, from 400 ha in 1988 to 9000 ha in 1993 (Johansson 1993). Although procedures for estimating stem biomass of Salix have been developed both for reseach and commercial pur-poses (Verwijst 1991, Telenius and Verwijst 1995), there have been few attempts to develop procedures for estimating leaf
area (Nilsson 1983) and little is known about single leaf al-lometry in willow.
Plant leaf area is directly related to light interception, tran-spiration and photosynthesis, and is considered to be the most important single determinant of plant productivity (Linder 1985). Reliable determinations of leaf area, however, are labor-intensive and costly, especially when time series are needed for fast-growing, high-yield plantations that change rapidly over time (Ceulemans et al. 1993). Indirect leaf area estimation methods based on light-interception measurements may be used at the stand level (Nobel et al. 1993), but these methods do not provide information about leaf area of individual trees, and they provide no information about the size and shape of single leaves.
Both leaf size and shape directly affect energy and mass exchange of the leaf because the thickness of the boundary layer limits the exchange of heat, water vapor and carbon dioxide (Parkhurst et al. 1968, Taylor and Gates 1970, Gates 1980). Therefore, measurements at the individual leaf level that define leaf shape and can be scaled up to obtain leaf area at the individual tree and stand levels (e.g., Ceulemans et al. 1993) would be useful in ecophysiological studies that span several scales.
The area of individual leaves can be estimated from non-de-structive measurements of leaf width (W) and leaf length (L) (Wargo 1978, Ramkhelawan and Brathwaite 1990), and their ratios give some indication about the constancy of leaf shape with size. Humphries and French (1964) estimated leaf size by comparing leaves with simple geometric shapes, such as cir-cles and ellipses.
We have studied leaf size, shape and specific leaf area (leaf area/leaf dry weight) of Salix viminalis L. The objectives of the study were to (1) establish relationships between linear leaf dimensions and individual leaf area; (2) determine the relation-ship between leaf shape and leaf size; and (3) assess the spatial variation of leaf characteristics within shoots and their dynam-ics throughout the first growing season.
Leaf allometry of
Salix viminalis
during the first growing season
THEO VERWIJST
1and DA-ZHI WEN
21
The Swedish University of Agricultural Sciences, Department of Ecology and Environmental Research, Section of Short-Rotation Forestry, Box 7072, 75007 Uppsala, Sweden
2 The Chinese Academy of Sciences, South China Institute of Botany, Department of Plant Ecology, Guangzhou 510650, China
Received September 26, 1995
In spring 1994, 180 polyethylene barrels were put in the soil with their brims just above the soil surface, at asquare spacing of 0.7 × 0.7 m, at the Ultuna field station, Uppsala (59°49′ N, 14°40′ E, 5 m a.s.l.). Each barrel had a volume of about 220 dm3 and contained adrainage tube at the bottom, con-nected with apipe emerging at the soil surface, where surplus water could be extracted with a pump. The barrels were filled with washed quartz sand. In June 1994, one cutting of Salix viminalis (clone 78183, cf. Ager et al. 1986) was planted in each barrel. The barrels were covered with alid that contained ahole through which the shoots grew. Adrip irrigation system was used to add water and nutrients to each barrel. Nutrients and water were added daily in proportion to nutrient uptake, calculated on the basis of relative growth rates (Ingestad 1987). From each cutting, one to five buds grew into proleptic shoots reaching amaximum length of about 1.5 m at the end of the season. Each shoot consisted of astem with leaves and axillary buds. Some of these axillary buds developed into sylleptic shoots later in the season. Syllepsis implies that current-year axillary buds develop into shoots during continu-ous extension growth of the mother shoot (Kozlowski 1964). The leaves of Salix viminalis are ovate to lanceolate in shape and have entire margins.
Sampling and analyses
Four times during the growing season (July 26, August 15, September 5 and 26), seven plants with aminimum distance of 2 m from each other, were selected and one shoot was ran-domly chosen from each plant. From each of the chosen shoots, seven fully expanded leaves were sampled along a vertical profile from the base to the top at equal relative distances. On the last two sampling occasions, three leaves on each of seven sylleptic shoots were also collected. Leaf area was measured with asurface area meter (LI-3100; Li-Cor Inc., Lincoln, NE). Length (L), width (W) and the distance from the leaf base to the mid-vein point at the position of maximum leaf width (P) were recorded for each leaf. All leaves were oven-dried at 70 °C for two days and then weighed.
The lengths of the leaf halves (divided at the position of maximum width) P for the basal part and L − P for the distal part were used together with W to calaculate leaf area as an ellipse (obtuse point) or a parabola (acuminate point) or a combination of these shapes.
Least squares regression was used in both linear and non-linear models. The nonnon-linear regression procedure used an iterative least-squares method (Hartley 1961). The initial start-ing values for all parameters were set to 0.1 and the tolerance criterion for convergence was 10−5 units of magnitude of each parameter. In the regression statistics used, acorrection for sample size and number of predictors was applied. The results of the regressions were assessed on the basis of comparisons of r2, uncorrected for sample size and number of predictors used in the model, and of the standard error of the mean (SEM).
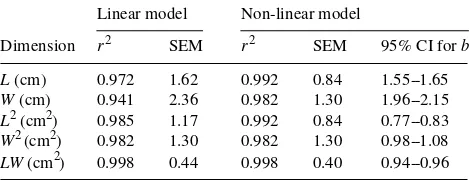
with r2 values of 0.97 and 0.94, respectively (Table 1). Still higher coefficients of determination were obtained by taking the squares of the linear dimensions or using the product of L and W (LW) as the predictor variable. When anonlinear model was fitted, the estimated exponent (b) was significantly differ-ent from 1 in all but one of the cases, indicating that the relationships were intrinsically nonlinear. The extent of the decrease in standard error, resulting from using anonlinear model instead of alinear model, was related to the deviation of parameter b from 1. When A was regressed on the product of L and W, the linear model gave aslight underestimation of the area of small leaves, and an overestimation of the larger leaves (Figure 1A). Thus, although alinear regression of A on L had a high coefficient of determination, considerable systematic errors resulted from alinear fit compared with anonlinear fit (Figure 1B).
In both the linear and nonlinear models, differences between leaves from sylleptic shoots (S) and leaves from proleptic shoots (P) were taken into account by including anominal variable for leaf type (Table 2). Comparisons of the parameter estimates and standard errors of the parameters of the linear and nonlinear models showed that the relationship between A and LW was nonlinear and that leaf type had asignificant effect (b1 differed significantly from zero) in the nonlinear model. This difference was not detected by the linear model.
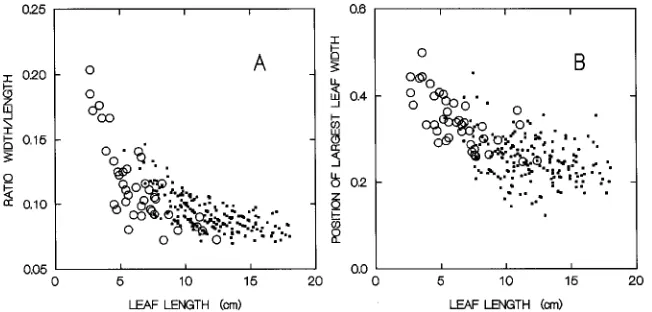
Nonlinearity of the relationship between A and LW implies that leaf shape is changing with changing linear leaf dimen-sions. This was confirmed by inspection of the ratio of W to L (W/L), and the position of maximum leaf width (Figures 2A and 2B). Although these measures showedconsiderable scat-ter, regression analysis indicated significant differences be-tween S-leaves and P-leaves. For both leaf types, leaves became relatively narrower with increasing length. The S-leaves were broader than the P-S-leaves, and the W/L ratio decreased faster with increasing leaf length for S-leaves than for P-leaves (Table 3). Furthermore, the position of maximum leaf width, which divides the leaf into basal and distal parts, changed with increasing leaf length. Maximum leaf width was almost in the middle of the shortest leaves, whereas longer leaves had adistal part that was four times as long as the apical
Table 1. The r2-values and standard error of the mean (SEM) for linear (A = aD) and nonlinear (A = aDb) regressions of leaf area (A) on leaf dimensions (D). The dimensions are leaf length (L), leaf width (W) or acombination of the two.
Linear model Non-linear model
part. The S-leaves had a relatively larger apical portion than the P-leaves, but the apical portion of S-leaves diminished faster with increasing leaf length than that of P-leaves (Table 3).
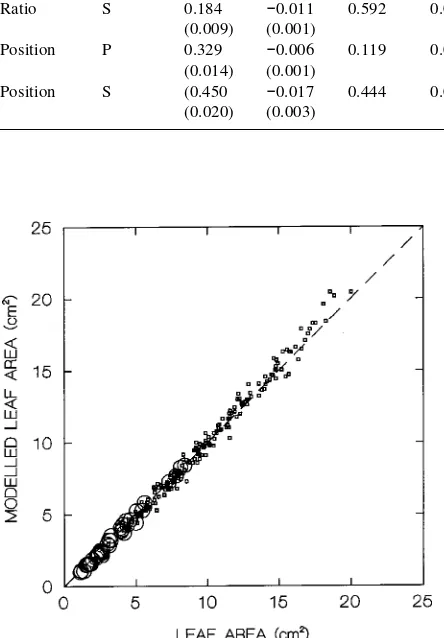
Differences in shape were successfully modeled by dividing each leaf into basal and distal parts and comparing each part based on simple geometric shapes such as ellipses and parabo-las. In this way, we were able to estimate leaf area on the basis of leaf linear dimensions while taking account of the inherent changes in leaf shape with size. We tried six possible combi-nations of ellipses and parabolas, and found that a good fit was
obtained when the basal part of the leaf was described as a parabola and the distal part was described as an ellipse (Fig-ure 3). This approach resulted in an overestimation of leaf area of 0.4 ± 0.4% (mean ± standard error) for all sampled leaves.
We postulated that differences in leaf area of individual leaves along a vertical profile within shoots are related to differences in leaf size over time, because leaves that develop at the beginning of the season emerge on small shoots close to the ground, whereas later leaves develop higher up. This rela-tion is illustrated by the response surface of leaf area to sam-pling occasion and relative height of the leaf on the shoot (Figure 4A). The smallest leaves on proleptic shoots were found close to the ground at the beginning of the season, whereas the largest leaves were found on distal shoot parts late in the season.
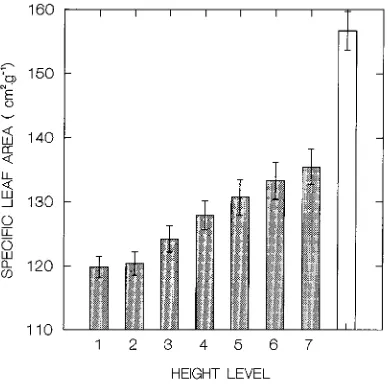
To estimate leaf area from leaf weight, we plotted specific leaf area (SLA, defined as the ratio between leaf area and leaf weight, M) against leaf area. The plot showed alarge scatter, and there was aclear distinction in the bivariate means be-tween S- and P-leaves (Figure 5). Although alinear model of A on M gave a good fit, the relationship proved to be nonlinear and differed between S- and P-leaves (Table 4). Much of the variation in SLA of P-leaves was explained by height (H) (Figure 6), which constituted asignificant term in the non-linear regression model (Table 4). The change in SLA with
Figure 1. Relationships between leaf area and the product of leaf length and width (A) and between leaf area and leaf length (B), for leaves on sylleptic shoots (circles) and proleptic shoots (squares) based on alinear (solid line) and anon-linear (dotted line) fit. Devia-tions from alinear fit are small in the first case and larger in the second, but significant in both cases (see Table 1).
Table 2. Regressions of leaf area (A, cm2) on the product of leaf length and width (LW, cm2) and including anominal variable (cat) for leaf type (cat = 1 for leaves on proleptic shoots, cat = 2 for leaves on sylleptic shoots), using a non-linear and a linear (c = 1) model: A = (b0 + b1 cat)LWc.
Model b0 (SE) b1 (SE) c (SE) r2 SEM
Linear 0.74 0.006 1 0.998 0.44 (0.014) (0.013) (--)
Non-linear 0.906 −0.036 0.944 0.9984 0.39 (0.028) (0.014) (0.007)
Discussion
We focused on leaf shape because changes in leaf shape with leaf size illustrate why nonlinear models may perform better than linear models for the estimation of leaf area from leaf linear dimensions.
When leaf area is estimated from a one-dimensional leaf characteristic such as length or width, the application of a linear model assumes that the two-dimensional area changes in direct proportion to the one predictor variable used, i.e., that there is an inherent isometric relation. It can be seen that this assumption holds true if other linear leaf dimensions are kept constant. This may be the case in many graminoids where leaf elongation can occur without changing leaf width; however, in many other plants, a change in leaf length accompanies a change in leaf width. If changes in one linear leaf dimension are proportional to changes in the other linear leaf dimension, and leaf shape is not otherwise changing, a linear model that uses the squared values of one of the dimensions will give a perfect fit. In most cases, however, relationships between leaf area and linear leaf dimensions and also the interrelations between the various linear leaf dimensions are not constant (e.g., Figure 2A). Therefore, if an inherent allometric relation is fitted with alinear model, systematic errors will occur, even if ahigh coefficient of determination is obtained. In our study, this was exemplified by the difference between a linear and a nonlinear model used to estimate leaf area from length and width and from length alone (Figure 1). Use of a single linear leaf dimension can be justified in cases where the number of measurements has to be restricted. When representative sam-ples can be taken and the aim is to assess average values at the whole-plant level, linear models can be applied, but they may seriously limit interpretation of the data in terms of leaf size and shape variations.
The constant a in the linear model A = aLW is often used to compare leaves of different clones, species or treatments (Kemp 1960, Ceulemans et al. 1993) and can be compared to the values of fixed geometrical shapes; e.g., a parabola and an Y Type a (SE) b (SE) r2 SEM
Ratio P 0.135 −0.004 0.486 0.048 (0.003) (0.0003)
Ratio S 0.184 −0.011 0.592 0.045 (0.009) (0.001)
Position P 0.329 −0.006 0.119 0.048 (0.014) (0.001)
Position S (0.450 −0.017 0.444 0.045 (0.020) (0.003)
Figure 3. Relationship between measured and estimated leaf area when leaf shape was modeled implicitly with leaf size (the basal part of the leaf is described as aparabola and the distal part as an ellipse) for leaves on sylleptic shoots (circles) and proleptic shoots (squares).
ellipse have values of 0.667 and 0.785, respectively. By divid-ing each leaf into basal and distal parts on the basis of the position of maximum leaf width and modeling leaf area as a combination of parabolic and elliptic parts, single-leaf values in the range between 0.667 and 0.785 are theoretically possible and may change systematically with leaf size. For leaves with a value beyond the range of 0.667--0.785, the procedure can be extended to cover the range from 0 to 1 by modeling leaf width as a function of leaf length, and integrating the resulting function to obtain the area. The disadvantage of an implicit shape description is the large number of variables that need to be determined for each leaf.
We found anonlinear relationship between leaf area and leaf dry weight in Salix viminalis. Sharrett and Baker (1985) and Ma et al. (1992) also found that anonlinear model best de-scribed the relationship between A and M for alfalfa (Medicago sativa L.) and peanut (Arachis hypogaea L.), respectively.
The differences in leaf area and specific leaf area (SLA) along avertical profile and over a growing season showed that it is not valid to extrapolate results in space and time from a
spatially and temporally restricted sampling. In fully devel-oped stands, which may reach amaximum leaf area index of about 8 (Lindroth et al. 1994) and aheight of about 7 m at harvest, strong vertical microclimatic gradients may lead to even greater differences in leaf characteristics than observed in this study. Reddy et al. (1989) concluded that 93% of the variation in SLA of cotton leaves (Gossypium hirsutum L.) could be accounted for by the light flux density within the cotton canopy. In their study, a high SLA was found at the bottom of the canopy and alow SLA was found at the top of the canopy. In our study, where the canopy was still open and provided little shade, the situation was reversed, and the vari-ation in SLA was probably associated with a time-related factor such as growth stage or leaf maturity.
In willow, sylleptic shoots occur mainly during the first season (Brunkener 1988). The sylleptic shoots tend to wither in summer and eventually fall off. Development of sylleptic shoots during later years is rare. The finding that leaves from
Figure 5. Relationship between specific leaf area and leaf area of leaves on sylleptic shoots (circles) and proleptic shoots (squares).
Table 4. Regressions of leaf area (A, cm2) on leaf dry weight (M, g) including anominal variable (H) for relative height within the shoot ranging from 1 (shoot base) to 7 (shoot tip). P = leaves on proleptic shoots, S = leaves on sylleptic shoots, using the model: A = (b0 + b1H)Mc.
Model Type b0 (SE) b1 (SE) c (SE) r2 SEM
Linear P + S 127.25 1 0.989 0.98
(0.845) (--)
Non-linear P + S 113.00 0.951 0.990 0.97
(4.90) (0.018)
Non-linear S 82.16 0.834 0.991 0.39
(7.70) (0.027)
Non-linear P 119.34 0.974 0.990 1.04
(6.09) (0.021)
Non-linear P 96.06 2.39 0.925 0.992 0.89
(4.49) (0.34) (0.017)
Acknowledgments
This study was carried out under the auspices of the Swedish Energy Forestry Project, financially supported by the Swedish Agricultural Foundation (SLF) and by the National Board for Industrial and Tech-nical Development (NUTEK). Dr. Li-Quan Zhang assisted with field work and data analyses. Financial support from The Chinese Ecosys-tem Research Network Project (CERN) to D.-Z. Wen is gratefully acknowledged.
References
Ager, A., A. Rönnberg-Wästljung, J. Thorsén and G Sirén. 1986. Genetic improvement of willows for energy forestry in Sweden. Swedish Univ. Agric. Sciences, Sect. of Energy Forestry, Report 43, 47 p.
Brunkener, L. 1988. Gross morphological and anatomical aspects of shoot growth in Salix. Swedish Univ. Agric. Sciences, Sect. of Energy Forestry, Report 45.
Ceulemans, R., J. Pontaillier, F. Mau and J. Guittet. 1993. Leaf al-lometry in young poplar stands: Reliability of leaf area index estimation, site and clone effects. Biomass Bioenergy 4:315--321. Gates, D.M. 1980. Biophysical ecology. Springer-Verlag, Berlin,
611 p.
Hartley, H.O. 1961. The modified Gauss-Newton method for the fitting of non-linear regression functions by least squares. Tech-nometrics 3:269--280.
Humphries, E.G. and S.A.W. French. 1964. Determination of leaf area by rating in comparison with geometric shapes. Ann. Appl. Biol. 54:281--284.
Ingestad, T. 1987. New concepts on stand fertility and plant nutrition as illustrated by research on forest trees and stands. Geoderma 40:237--252.
Johansson, H. 1993. Energy forestry with effective technology and new breeds of Salix varieties. In Bioenergy Conference. Hanasaari Cultural Centre, Espoo, Finland, pp 191-199.
Kemp, C.D. 1960. Methods of estimating the leaf area of grasses from linear measurements. Ann. Bot. 24:491--499.
Kozlowski, T.T. 1964. Shoot growth in woody plants. Bot. Rev. 30:333--392.
willow: variation with season, humidity and biomass allocation. J. Hydrol. 156:1--19.
Ma, L., F.P. Gardner and A. Selamat. 1992. Estimation of leaf area from leaf and total mass measurements in peanut. Crop Sci. 32:467--471.
Nilsson, L.-O. 1983. Leaf development of willow----methods and ap-plications. In: Mesures des Biomasses et des Accroissements For-estiers. Ed. D. Auclair. Les Colloques de l’INRA, No 19. Paris, pp 21--30.
Nobel, P.S., I.N. Forseth and S.P Long. 1993. Canopy structure and light interception. In Photosynthesis and Production in aChanging Environment. Eds. D.O. Hall, J.M.O. Scurlock, H.R. Bolhàr-Nor-denkampf, R.C. Leegood and S.P. Long. Chapman and Hall, Lon-don, pp 79--90.
Parkhurst, D.F., P.R. Duncan, D.M. Gates and F. Kreith. 1968. Wind-tunnel modelling of convection of heat between air and broad leaves of plants. Agric. Meteorol. 5:33--47.
Ramkhelawan, E. and R.A.I. Brathwaite. 1990. Leaf area estimation by non-destructive methods in sour orange (Citrus aurantium L.) Trop. Agric. 67:203--206.
Reddy, V.R., B. Acock, D.N. Baker and A. Acock. 1989. Seasonal leaf area-leaf weight relationships in the cotton canopy. Agron. J. 81:1--4. Sharrett, B.S. and D.G. Baker. 1985. Alfalfa leaf area as afunction of
dry matter. Crop Sci. 26:1040--1042.
Sirén, G. 1983. Energiskogsodling. Nämnden för energiproduktions-forskning, Stockholm, 255 p.
Taylor, S.E. and D.M. Gates. 1970. Some field methods for obtaining meaningful leaf diffusion resistances and transpiration rates. Oecol. Plant. 5:105--113.
Telenius, B. and T. Verwijst. 1995. The influence of allometric vari-ation, vertical biomass distribution and sampling procedure on biomass estimates in commercial short-rotation forests. Biore-source Technol. 51:247--253.
Verwijst, T. 1991. Logarithmic transformations in biomass estimation procedures: Violation of the linearity assumption in regression analysis. Biomass Bioenergy 1: 175--180.