Java Performance Tuning
Copyright © 2000 O'Reilly & Associates, Inc. All rights reserved. Printed in the United States of America.
Published by O'Reilly & Associates, Inc., 101 Morris Street, Sebastopol, CA 95472.
The O'Reilly logo is a registered trademark of O'Reilly & Associates, Inc. Many of the designations used by manufacturers and sellers to distinguish their products are claimed as trademarks. Where those designations appear in this book, and O'Reilly & Associates, Inc. was aware of a trademark claim, the designations have been printed in caps or initial caps.
Nutshell Handbook, the Nutshell Handbook logo, and the O'Reilly logo are registered trademarks, and The Java™ Series is a trademark of O'Reilly & Associates, Inc. The association of the image of a serval with the topic of Java™ performance tuning is a trademark of O'Reilly & Associates, Inc. Java™ and all Java-based trademarks and logos are trademarks or registered trademarks of Sun Microsystems, Inc., in the United States and other countries. O'Reilly & Associates, Inc. is independent of Sun Microsystems.
Many of the designations used by manufacturers and sellers to distinguish their products are claimed as trademarks. Where those designations appear in this book, and O'Reilly & Associates, Inc. was aware of a trademark claim, the designations have been printed in caps or initial caps. While every precaution has been taken in the preparation of this book, the publisher assumes no responsibility for errors or omissions, or for damages resulting from the use of the information contained herein.
While every precaution has been taken in the preparation of this book, the publisher assumes no responsibility for errors or omissions, or for damages resulting from the use of the information contained herein.
Java Performance Tuning
Preface - 5
Contents of This Book
Virtual Machine (VM) Versions
Conventions Used in This Book
Comments and Questions
Acknowledgments
1. Introduction - 7 1.1 Why Is It Slow?
1.2 The Tuning Game
1.3 System Limitations and What to Tune
1.4 A Tuning Strategy
1.5 Perceived Performance
1.6 Starting to Tune
1.7 What to Measure
1.8 Don't Tune What You Don't Need to Tune
1.9 Performance Checklist
2. Profiling Tools - 21
2.1 Measurements and Timings
2.2 Garbage Collection
2.3 Method Calls
2.5 Monitoring Gross Memory Usage
2.6 Client/Server Communications
2.7 Performance Checklist
3. Underlying JDK Improvements - 55 3.1 Garbage Collection
3.2 Replacing JDK Classes
3.3 Faster VMs
3.4 Better Optimizing Compilers
3.5 Sun's Compiler and Runtime Optimizations
3.6 Compile to Native Machine Code
3.7 Native Method Calls
3.8 Uncompressed ZIP/JAR Files
3.9 Performance Checklist
4. Object Creation - 77
4.1 Object-Creation Statistics
4.2 Object Reuse
4.3 Avoiding Garbage Collection
4.4 Initialization
4.5 Early and Late Initialization
4.6 Performance Checklist
5. Strings - 97
5.1 The Performance Effects of Strings
5.2 Compile-Time Versus Runtime Resolution of Strings
5.3 Conversions to Strings
5.4 Strings Versus char Arrays
5.5 String Comparisons and Searches
5.6 Sorting Internationalized Strings
5.7 Performance Checklist
6. Exceptions, Casts, and Variables - 135 6.1 Exceptions
6.2 Casts
6.3 Variables
6.4 Method Parameters
6.5 Performance Checklist
7. Loops and Switches - 144 7.1 Java.io.Reader Converter
7.2 Exception-Terminated Loops
7.3 Switches
7.4 Recursion
7.5 Recursion and Stacks
7.6 Performance Checklist
8. I/O, Logging, and Console Output - 167 8.1 Replacing System.out
8.2 Logging
8.3 From Raw I/O to Smokin' I/O
8.4 Serialization
8.5 Clustering Objects and Counting I/O Operations
8.6 Compression
8.7 Performance Checklist
9. Sorting - 191
9.1 Avoiding Unnecessary Sorting Overhead
9.2 An Efficient Sorting Framework
9.3 Better Than O(nlogn) Sorting
9.4 Performance Checklist
10.1 User-Interface Thread and Other Threads
10.2 Race Conditions
10.3 Deadlocks
10.4 Synchronization Overheads
10.5 Timing Multithreaded Tests
10.6 Atomic Access and Assignment
10.7 Thread Pools
10.8 Load Balancing
10.9 Threaded Problem-Solving Strategies
10.10 Performance Checklist
11. Appropriate Data Structures and Algorithms - 233 11.1 Collections
11.2 Java 2 Collections
11.3 Hashtables and HashMaps
11.4 Cached Access
11.5 Caching Example I
11.6 Caching Example II
11.7 Finding the Index for Partially Matched Strings
11.8 Search Trees
11.9 Performance Checklist
12. Distributed Computing - 264 12.1 Tools
12.2 Message Reduction
12.3 Comparing Communication Layers
12.4 Caching
12.5 Batching I
12.6 Application Partitioning
12.7 Batching II
12.8 Low-Level Communication Optimizations
12.9 Distributed Garbage Collection
12.10 Databases
12.11 Performance Checklist
13. When to Optimize - 281 13.1 When Not to Optimize
13.2 Tuning Class Libraries and Beans
13.3 Analysis
13.4 Design and Architecture
13.5 Tuning After Deployment
13.6 More Factors That Affect Performance
13.7 Performance Checklist
14. Underlying Operating System and Network Improvements - 304 14.1 Hard Disks
14.2 CPU
14.3 RAM
14.4 Network I/O
14.5 Performance Checklist
15. Further Resources - 315 15.1 Books
15.2 Magazines
15.3 URLs
15.4 Profilers
15.5 Optimizers
Preface
Performance has been an important issue with Java™ since the first version hit the Web years ago. Making those first interpreted programs run fast enough was a huge challenge for many developers. Since then, Java performance has improved enormously, and any Java program can now be made to run fast enough provided you avoid the main performance pitfalls.
This book provides all the details a developer needs to performance-tune any type of Java program. I give step-by-step instructions on all aspects of the performance-tuning process, right from early considerations such as setting goals, measuring performance, and choosing a compiler, to detailed examples on using profiling tools and applying the results to tune the code. This is not an entry-level book about Java, but you do not need any previous tuning knowledge to benefit from reading it.
Many of the tuning techniques presented in this book lead to an increased maintenance cost, so they should not be applied arbitrarily. Change your code only when a bottleneck has been identified, and never change the design of your application for minor performance gains.
Contents of This Book
Chapter 1 gives general guidelines on how to tune. If you do not yet have a tuning strategy, this chapter provides a methodical tuning process.
Chapter 2 covers the tools you need to use while tuning. Chapter 3 looks at the Java Development Kit™ ( JDK, now Java SDK), including VMs and compilers.
Chapter 4 through Chapter 12 cover various techniques you can apply to Java code. Chapter 12
looks at tuning techniques specific to distributed applications.
Chapter 13 steps back from the low-level code-tuning techniques examined throughout most of the book and considers tuning at all other stages of the development process.
Chapter 14 is a quick look at some operating system-level tuning techniques.
Each chapter has a performance tuning checklist at its end. Use these lists to ensure that you have not missed any core tuning techniques while you are tuning.
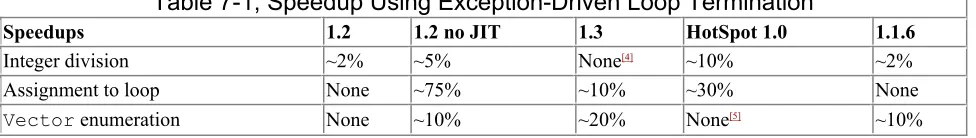
Virtual Machine (VM) Versions
I have focused on the Sun VMs since there is enough variation within these to show interesting results. I have shown the time variation across different VMs for many of the tests. However, your main focus should be on the effects that tuning has on any one VM, as this identifies the usefulness of a tuning technique. Differences between VMs are interesting, but are only indicative and need to be verified for your specific application. Where I have shown the results of timed tests, the VM versions I have used are:
1.1.6
Version 1.1.x VMs do less VM-level work than later Java 2 VMs, so I have used a 1.1.x VM that includes a JIT. Version 1.1.6 was the earliest 1.1.x JDK that included enough
1.1.x VMs from 1.1.6 still show the fastest results for some types of tests. Version 1.1.6 supports running with and without a JIT. The default is with a JIT, and this is the mode used for all measurements in the book.
1.2
I have used the 1.2.0 JDK for the 1.2 tests. Java 2 VMs have more work to do than prior VMs because of additional features such as Reference objects, and 1.2.0 is the first Java 2 VM. Version 1.2 supports running with and without a JIT. The default is with a JIT, and this is the mode used for measurements labeled "1.2." Where I've labeled a measurement "1.2 no JIT," it uses the 1.2 VM in interpreted mode with the -Djava.compiler=NONE option to set that property.
1.3
I have used both the 1.3.0 full release and the 1.3 prerelease, as the 1.3 full release came out very close to the publication time of the book. Version 1.3 supports running in interpreted mode or with client-tuned HotSpot technology (termed "mixed" mode). Version 1.3 does not support a pure JIT mode. The default is the HotSpot technology, and this is the mode I've used for measurements labeled simply "1.3."
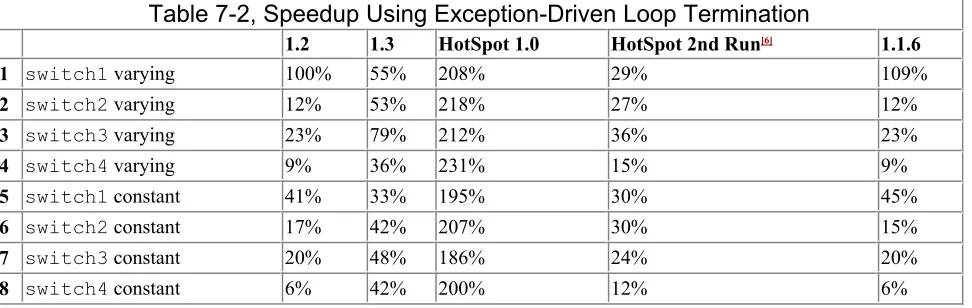
HotSpot 1.0
HotSpot 1.0 VM was run with the 1.2.0 JDK classes. Because HotSpot optimizations frequently do not kick in until after the program has run for a little while, I sometimes show measurements labeled "HotSpot 2nd Run." This set of measurements is the result from repeating the particular test within the same VM session, i.e., the VM does not exit between the first and second runs of the test.
Conventions Used in This Book
The following font conventions are used in this book:
Italic is used for:
• Pathnames, filenames, and program names
• Internet addresses, such as domain names and URLs
• New terms where they are defined
Constantwidth is used for:
• All Java code
• Command lines and options that should be typed verbatim
• Names and keywords in Java programs, including method names, variable names, and class names
Comments and Questions
The information in this book has been tested and verified, but you may find that features have changed (or you may even find mistakes!). You can send any errors you find, as well as suggestions for future editions, to:
O'Reilly & Associates, Inc. 101 Morris Street
Sebastopol, CA 95472
(800) 998-9938 (in the United States or Canada) (707) 829-0515 (international/local)
(707) 829-0104 (fax)
You can also send messages electronically. To be put on the mailing list or request a catalog, send email to:
To ask technical questions or comment on the book, send email to:
There is a web site for the book, where examples, errata, and any plans for future editions are listed. You can access this site at:
http://www.oreilly.com/catalog/javapt/
For more information about this book and others, see the O'Reilly web site:
http://www.oreilly.com
Acknowledgments
A huge thank you to my wonderful wife Ava, for her unending patience with me. This book would have been considerably poorer without her improvements in clarity and consistency throughout. I am also very grateful to Mike Loukides and Kirk Pepperdine for the enormously helpful assistance I received from them while writing this book. Their many notes have helped to make this book much clearer and complete.
Thanks also to my reviewers, Patrick Killelea, Ethan Henry, Eric Brower, and Bill Venners, who provided many useful comments. They identified several errors and added good advice that makes this book more useful.
I am, of course, responsible for the final text of this book, including any erroors tthat rremain.
Chapter 1. Introduction
The trouble with doing something right the first time is that nobody appreciates how difficult it was.
There is a general perception that Java programs are slow. Part of this perception is pure
assumption: many people assume that if a program is not compiled, it must be slow. Part of this perception is based in reality: many early applets and applications were slow, because of
nonoptimal coding, initially unoptimized Java Virtual Machines (VMs), and the overheads of the language.
In earlier versions of Java, you had to struggle hard and compromise a lot to make a Java
application run quickly. More recently, there have been fewer reasons why an application should be slow. The VM technology and Java development tools have progressed to the point where a Java application (or applet, servlet, etc.) is not particularly handicapped. With good designs and by following good coding practices and avoiding bottlenecks, applications usually run fast enough. However, the truth is that the first (and even several subsequent) versions of a program written in any language are often slower than expected, and the reasons for this lack of performance are not always clear to the developer.
This book shows you why a particular Java application might be running slower than expected, and suggests ways to avoid or overcome these pitfalls and improve the performance of your application. In this book I've gathered several years of tuning experiences in one place. I hope you will find it useful in making your Java application, applet, servlet, and component run as fast as you need. Throughout the book I use the generic words "application" and "program" to cover Java
applications, applets, servlets, beans, libraries, and really any use of Java code. Where a technique can be applied only to some subset of these various types of Java programs, I say so. Otherwise, the technique applies across all types of Java programs.
1.1 Why Is It Slow?
This question is always asked as soon as the first tests are timed: "Where is the time going? I did not expect it to take this long." Well, the short answer is that it's slow because it has not been performance-tuned. In the same way the first version of the code is likely to have bugs that need fixing, it is also rarely as fast as it can be. Fortunately, performance tuning is usually easier than debugging. When debugging, you have to fix bugs throughout the code; in performance tuning , you can focus your effort on the few parts of the application that are the bottlenecks.
The longer answer? Well, it's true that there are overheads in the Java runtime system, mainly due to its virtual machine layer that abstracts Java away from the underlying hardware. It's also true that there are overheads from Java's dynamic nature. These overhead s can cause a Java application to run slower than an equivalent application written in a lower-level language ( just as a C program is generally slower than the equivalent program written in assembler). Java's advantages—namely, its platform-independence, memory management, powerful exception checking, built-in
multithreading, dynamic resource loading, and security checks—add costs in terms of an interpreter, garbage collector, thread monitors, repeated disk and network accessing, and extra runtime checks.
when it is too difficult to determine method calls at compile time, as is the case for many Java methods.
Of course, the same Java language features that cause these overheads may be the features that persuaded you to use Java in the first place. The important thing is that none of these overheads slows the system down too much. Naturally, "too much" is different depending on the application, and the users of the application usually make this choice. But the key point with Java is that a good round of performance tuning normally makes your application run as fast as you need it to run. There are already plenty of nontrivial Java applications, applets, and servlets that run fast enough to show that Java itself is not too slow. So if your application is not running fast enough, chances are that it just needs tuning.
1.2 The Tuning Game
Performance tuning is similar to playing a strategy game (but happily, you are usually paid to do it!). Your target is to get a better score (lower time) than the last score after each attempt. You are playing with, not against, the computer, the programmer, the design and architecture, the compiler, and the flow of control. Your opponents are time, competing applications, budgetary restrictions, etc. (You can complete this list better than I can for your particular situation.)
I once attended a customer who wanted to know if there was a "go faster" switch somewhere that he could just turn on and make the whole application go faster. Of course, he was not really expecting one, but checked just in case he had missed a basic option somewhere.
There isn't such a switch, but very simple techniques sometimes provide the equivalent. Techniques include switching compilers , turning on optimizations, using a different runtime VM, finding two or three bottlenecks in the code or architecture that have simple fixes, and so on. I have seen all of these give huge improvements to applications, sometimes a 20-fold speedup. Order-of-magnitude speedups are typical for the first round of performance tuning.
1.3 System Limitations and What to Tune
Three resource s limit all applications:
• CPU speed and availability
• System memory
• Disk (and network) input/output (I/O)
When tuning an application, the first step is to determine which of these is causing your application to run too slowly.
If your application is CPU -bound, you need to concentrate your efforts on the code, looking for bottlenecks, inefficient algorithms, too many short-lived objects (object creation and garbage collection are CPU-intensive operations), and other problems, which I will cover in this book. If your application is hitting system-memory limits, it may be paging sections in and out of main memory. In this case, the problem may be caused by too many objects, or even just a few large objects, being erroneously held in memory; by too many large arrays being allocated (frequently used in buffered applications); or by the design of the application, which may need to be
On the other hand, external data access or writing to the disk can be slowing your application. In this case, you need to look at exactly what you are doing to the disks that is slowing the application: first identify the operations, then determine the problems, and finally eliminate or change these to improve the situation.
For example, one program I know of went through web server logs and did reverse lookups on the IP addresses. The first version of this program was very slow. A simple analysis of the activity being performed determined that the major time component of the reverse lookup operation was a network query. These network queries do not have to be done sequentially. Consequently, the second version of the program simply multithreaded the lookups to work in parallel, making multiple network queries simultaneously, and was much, much faster.
In this book we look at the causes of bad performance. Identifying the causes of your performance problems is an essential first step to solving those problems. There is no point in extensively tuning the disk-accessing component of an application because we all know that "disk access is much slower than memory access" when, in fact, the application is CPU-bound.
Once you have tuned the application's first bottleneck, there may be (and typically is) another problem, causing another bottleneck. This process often continues over several tuning iterations. It is not uncommon for an application to have its initial "memory hog" problems solved, only to become disk-bound, and then in turn CPU-bound when the disk-access problem is fixed. After all, the application has to be limited by something, or it would take no time at all to run.
Because this bottleneck-switching sequence is normal—once you've solved the existing bottleneck, a previously hidden or less important one appears—you should attempt to solve only the main
bottlenecks in an application at any one time. This may seem obvious, but I frequently encounter teams that tackle the main identified problem, and then instead of finding the next real problem, start applying the same fix everywhere they can in the application.
One application I know of had a severe disk I/O problem caused by using unbuffered streams (all disk I/O was done byte by byte, which led to awful performance). After fixing this, some members of the programming team decided to start applying buffering everywhere they could, instead of establishing where the next bottleneck was. In fact, the next bottleneck was in a data-conversion section of the application that was using inefficient conversion methods, causing too many temporary objects and hogging the CPU. Rather than addressing and solving this bottleneck, they instead created a large memory allocation problem by throwing an excessive number of buffers into the application.
1.4 A Tuning Strategy
Here's a strategy I have found works well when attacking performance problems:
1. Identify the main bottlenecks (look for about the top five bottlenecks, but go higher or lower if you prefer).
2. Choose the quickest and easiest one to fix, and address it (except for distributed applications where the top bottleneck is usually the one to attack: see the following paragraph).
3. Repeat from Step 1.
This procedure will get your application tuned the quickest. The advantage of choosing the
advise you target the topmost bottleneck. The characteristics of distributed applications are such that the main bottleneck is almost always the best to fix and, once fixed, the next main bottleneck is usually in a completely different component of the system.
Although this strategy is simple and actually quite obvious, I nevertheless find that I have to repeat it again and again: once programmers get the bit between their teeth, they just love to apply
themselves to the interesting parts of the problems. After all, who wants to unroll loop after boring loop when there's a nice juicy caching technique you're eager to apply?
You should always treat the actual identification of the cause of the performance bottleneck as a science, not an art. The general procedure is straightforward:
1. Measure the performance using profilers and benchmark suites, and by instrumenting code. 2. Identify the locations of any bottlenecks.
3. Think of a hypothesis for the cause of the bottleneck. 4. Consider any factors that may refute your hypothesis.
5. Create a test to isolate the factor identified by the hypothesis. 6. Test the hypothesis.
7. Alter the application to reduce the bottleneck.
8. Test that the alteration improves performance, and measure the improvement (include regression testing the affected code).
9. Repeat from Step 1.
Here's the procedure for a particular example:
1. Run the application through your standard profiler (measurement).
2. You find that the code spends a huge 11% of time in one method (identification of bottleneck).
3. Looking at the code, you find a complex loop and guess this is the problem (hypothesis). 4. You see that it is not iterating that many times, so possibly the bottleneck could be outside
the loop (confounding factor).
5. You could vary the loop iteration as a test to see if that identifies the loop as the bottleneck. However, you instead try to optimize the loop by reducing the number of method calls it makes: this provides a test to identify the loop as the bottleneck and at the same time provides a possible solution. In doing this, you are combining two steps, Steps 5 and 7. Although this is frequently the way tuning actually goes, be aware that this can make the tuning process longer: if there is no speedup, it may be because your optimization did not actually make things faster, in which case you have neither confirmed nor eliminated the loop as the cause of the bottleneck.
6. Rerunning the profile on the altered application finds that this method has shifted its percentage time down to just 4%. This may still be a candidate bottleneck for further optimization, but nevertheless it's confirmed as the bottleneck and your change has improved performance.
7. (Already done, combined with Step 5). 8. (Already done, combined with Step 6). 1.5 Perceived Performance
to see something happening, and a good rule of thumb is that if an application is unresponsive for more than three seconds, it is seen to be slow. Some Human Computer Interface authorities put the user-patience limit at just two seconds; an IBM study from the early '70s suggested people's attention began to wander after waiting for more than just one second. For performance improvements, it is also useful to know that users are not generally aware of response time improvements of less than 20%. This means that when tuning for user perception, you should not deliver any changes to the users until you have made improvements that add more than a 20% speedup.
A few long response times make a bigger impression on the memory than many shorter ones. According to Arnold Allen,[1] the perceived value of the average response time is not the average,
but the 90th percentile value: the value that is greater than 90% of all observed response times. With a typical exponential distribution, the 90th percentile value is 2.3 times the average value.
Consequently, so long as you reduce the variation in response times so that the 90th percentile value is smaller than before, you can actually increase the average response time, and the user will still perceive the application as faster. For this reason, you may want to target variation in response times as a primary goal. Unfortunately, this is one of the more complex targets in performance tuning: it can be difficult to determine exactly why response times are varying.
[1]Introduction to Computer Performance Analysis with Mathematica (Academic Press).
If the interface provides feedback and allows the user to carry on other tasks or abort and start another function (preferably both), the user sees this as a responsive interface and doesn't consider the application as slow as he might otherwise. If you give users an expectancy of how long a particular task might take and why, they often accept that this is as long as it has to take and adjust their expectations. Modern web browsers provide an excellent example of this strategy in practice. People realize that the browser is limited by the bandwidth of their connection to the Internet, and that downloading cannot happen faster than a given speed. Good browsers always try to show the parts they have already received so that the user is not blocked, and they also allow the user to terminate downloading or go off to another page at any time, even while a page is partly
downloaded. Generally, it is not the browser that is seen to be slow, but rather the Internet or the server site. In fact, browser creators have made a number of tradeoffs so that their browsers appear to run faster in a slow environment. I have measured browser display of identical pages under identical conditions and found browsers that are actually faster at full page display, but seem slower because they do not display partial pages, or download embedded links concurrently, etc. Modern web browsers provide a good example of how to manage user expectations and perceptions of performance.
However, one area in which some web browsers have misjudged user expectation is when they give users a momentary false expectation that operations have finished when in fact another is to start immediately. This false expectation is perceived as slow performance. For example, when downloading a page with embedded links such as images, the browser status bar often shows reports like "20% of 34K," which moves up to "56% of 34K," etc., until it reaches 100% and indicates that the page has finished downloading. However, at this point, when the user expects that all the downloading has finished, the status bar starts displaying "26% of 28K" and so on, as the browser reports separately on each embedded graphic as it downloads them. This causes frustration to users who initially expected the completion time from the first download report and had geared themselves up to do something, only to have to wait again (often repeatedly). A better practice would be to report on how many pages need to be downloaded as well as the current download status, giving the user a clearer expectation of the full download time.
best strategy is to put the user in control. It is better to provide the option to choose between faster performance and better functionality. When users have made the choice themselves, they are often more willing to put up with actions taking longer in return for better functionality. When users do not have this control, their response is usually less tolerant.
This strategy also allows those users who have strong performance requirements to be provided for at their own cost. But it is always important to provide a reasonable default in the absence of any choice from the user. Where there are many different parameters, consider providing various levels of user-controlled tuning parameters, e.g., an easy set of just a few main parameters, a middle level, and an expert level with access to all parameters. This must, of course, be well documented to be really useful.
1.5.1 Threading to Appear Quicker
A lot of time (in CPU cycles) passes while the user is reacting to the application interface. This time can be used to anticipate what the user wants to do (using a background low priority thread), so that precalculated results are ready to assist the user immediately. This makes an application appear blazingly fast.
Similarly, ensuring that your application remains responsive to the user, even while it is executing some other function, makes it seem fast and responsive. For example, I always find that when starting up an application, applications that draw themselves on screen quickly and respond to repaint requests even while still initializing (you can test this by putting the window in the
background and then bringing it to the foreground) give the impression of being much faster than applications that seem to be chugging away unresponsively. Starting different word-processing applications with a large file to open can be instructive, especially if the file is on the network or a slow (removable) disk. Some act very nicely, responding almost immediately while the file is still loading; others just hang unresponsively with windows only partially refreshed until the file is loaded; others don't even fully paint themselves until the file has finished loading. This illustrates what can happen if you do not use threads appropriately.
In Java, the key to making an application responsive is multithreading. Use threads to ensure that any particular service is available and unblocked when needed. Of course this can be difficult to program correctly and manage. Handling interthread communication with maximal responsiveness (and minimal bugs) is a complex task, but it does tend to make for a very snappily built application.
1.5.2 Streaming to Appear Quicker
When you display the results of some activity on the screen, there is often more information than can fit on a single screen. For example, a request to list all the details on all the files in a particular large directory may not fit on one display screen. The usual way to display this is to show as much as will fit on a single screen and indicate that there are more items available with a scrollbar. Other applications or other information may use a "more" button or have other ways of indicating how to display or move on to the extra information.
This situation is often the case for distributed applications. A well-known example is (again!) found in web browsers that display the initial screenful of a page as soon as it is available, without waiting for the whole page to be downloaded. The general case is when you have a long activity that can provide results in a stream, so that the results can be accessed a few at a time. For distributed applications, sending all the data is often what takes a long time; in this case, you can build streaming into the application by sending one screenful of data at a time. Also, bear in mind that when there is a really large amount of data to display, the user often views only some of it and aborts, so be sure to build in the ability to stop the stream and restore its resources at any time.
1.5.3 Caching to Appear Quicker
This section briefly covers the general principles of caching. Caching is an optimization technique I return to in several different sections of this book, when it is appropriate to the problem under discussion. For example, in the area of disk access, there are several caches that apply: from the lowest-level hardware cache up through the operating-system disk read and write caches, cached filesystems, and file reading and writing classes that provide buffered I/O. Some caches cannot be tuned at all; others are tuneable at the operating-system level or in Java. Where it is possible for a developer to take advantage of or tune a particular cache, I provide suggestions and approaches that cover the caching technique appropriate to that area of the application. In some cases where caches are not directly tuneable, it is still worth knowing the effect of using the cache in different ways and how this can affect performance. For example, disk hardware caches almost always apply a read-ahead algorithm : the cache is filled with the next block of data after the one just read. This means that reading backward through a file (in chunks) is not as fast as reading forward through the file. Caches are effective because it is expensive to move data from one place to another or to calculate results. If you need to do this more than once to the same piece of data, it is best to hang on to it the first time and refer to the local copy in the future. This applies, for example, to remote access of files such as browser downloads. The browser caches locally on disk the file that was downloaded, to ensure that a subsequent access does not have to reach across the network to reread the file, thus making it much quicker to access a second time. It also applies, in a different way, to reading bytes from the disk. Here, the cost of reading one byte for operating systems is the same as reading a page (usually 4 or 8 KB), as data is read into memory a page at a time by the operating system. If you are going to read more than one byte from a particular disk area, it is better to read in a whole page (or all the data if it fits on one page) and access bytes through your local copy of the data.
General aspects of caching are covered in more detail in the section Section 11.4. Caching is an important performance-tuning technique that trades space for time, and it should be used whenever extra memory space is available to the application.
1.6 Starting to Tune
Before diving into the actual tuning, there are a number of considerations that will make your tuning phase run more smoothly and result in clearly achieved objectives.
1.6.1 User Agreements
Any application must meet the needs and expectations of its users, and a large part of those needs and expectations is performance. Before you start tuning, it is crucial to identify the target response times for as much of the system as possible. At the outset, you should agree with your users
The performance should be specified for as many aspects of the system as possible, including:
• Multiuser response times depending on the number of users (if applicable)
• Systemwide throughput (e.g., number of transactions per minute for the system as a whole, or response times on a saturated network, again if applicable)
• The maximum number of users, data, files, file sizes, objects, etc., the application supports
• Any acceptable and expected degradation in performance between minimal, average, and extreme values of supported resources
Agree on target values and acceptable variances with the customer or potential users of the
application (or whoever is responsible for performance) before starting to tune. Otherwise, you will not know where to target your effort, how far you need to go, whether particular performance targets are achievable at all, and how much tuning effort those targets may require. But most importantly, without agreed targets, whatever you achieve tends to become the starting point. The following scenario is not unusual: a manager sees horrendous performance, perhaps a function that was expected to be quick, but takes 100 seconds. His immediate response is, "Good grief, I expected this to take no more than 10 seconds." Then, after a quick round of tuning that identifies and removes a huge bottleneck, function time is down to 10 seconds. The manager's response is now, "Ah, that's more reasonable, but of course I actually meant to specify 3 seconds—I just never believed you could get down so far after seeing it take 100 seconds. Now you can start tuning." You do not want your initial achievement to go unrecognized (especially if money depends on it), and it is better to know at the outset what you need to reach. Agreeing on targets before tuning makes everything clear to everyone.
1.6.2 Setting Benchmarks
After establishing targets with the users, you need to set benchmarks. These are precise specifications stating what part of the code needs to run in what amount of time. Without first specifying benchmarks, your tuning effort is driven only by the target, "It's gotta run faster," which is a recipe for a wasted return. You must ask, "How much faster and in which parts, and for how much effort?" Your benchmarks should target a number of specific functions of the application, preferably from the user perspective (e.g., from the user pressing a button until the reply is returned, or the function being executed is completed).
You must specify target times for each benchmark. You should specify ranges: for example, best times, acceptable times, etc. These times are often specified in frequencies of achieving the targets. For example, you might specify that function A takes not more than 3 seconds to execute from user click to response received for 80% of executions, with another 15% of response times allowed to fall in the 3- to 5-second range, and 5% allowed to fall in the 5- to 10-second range. Note that the earlier section on user perceptions indicates that the user will see this function as having a 5-second response time (the 90th percentile value) if you achieve the specified ranges.
You should also have a range of benchmarks that reflect the contributions of different components of the application. If possible, it is better to start with simple tests so that the system can be
understood at its basic levels, and then work up from these tests. In a complex application, this helps to determine the relative costs of subsystems and which components are most in need of performance-tuning.
The following point is critical: Without clear performance objectives, tuning will never be
completed. This is a common syndrome on single or small group projects, where code keeps on
Your general benchmark suite should be based on real functions used in the end application, but at the same time should not rely on user input, as this can make measurements difficult. Any
variability in input times or any other part of the application should either be eliminated from the benchmarks or precisely identified and specified within the performance targets. There may be variability, but it must be controlled and reproducible.
1.6.3 The Benchmark Harness
There are tools for testing applications in various ways.[2] These tools focus mostly on testing the
robustness of the application, but as long as they measure and report times, they can also be used for performance testing. However, because their focus tends to be on robustness testing, many tools interfere with the application's performance, and you may not find a tool you can use adequately or cost-effectively. If you cannot find an acceptable tool, the alternative is to build your own harness.
[2] You can search the Web for java+perf+test to find performance-testing tools. In addition, some Java profilers are listed in Chapter 15.
Your benchmark harness can be as simple as a class that sets some values and then starts the main( ) method of your application. A slightly more sophisticated harness might turn on logging and timestamp all output for later analysis. GUI-run applications need a more complex harness and require either an alternative way to execute the graphical functionality without going through the GUI (which may depend on whether your design can support this), or a screen event capture and playback tool (several such tools exist[3]). In any case, the most important requirement is that your
harness correctly reproduces user activity and data input and output. Normally, whatever
regression-testing apparatus you have (and presumably are already using) can be adapted to form a benchmark harness.
[3] JDK 1.3 introduced a new java.awt.Robot class, which provides for generating native system-input events, primarily to support automated
testing of Java GUIs.
The benchmark harness should not test the quality or robustness of the system. Operations should be normal: startup, shutdown, noninterrupted functionality. The harness should support the different configurations your application operates under, and any randomized inputs should be controlled; but note that the random sequence used in tests should be reproducible. You should use a realistic amount of randomized data and input. It is helpful if the benchmark harness includes support for logging statistics and easily allows new tests to be added. The harness should be able to reproduce and simulate all user input, including GUI input, and should test the system across all scales of intended use, up to the maximum numbers of users, objects, throughputs, etc. You should also validate your benchmarks, checking some of the values against actual clock time to ensure that no systematic or random bias has crept into the benchmark harness.
For the multiuser case, the benchmark harness must be able to simulate multiple users working, including variations in user access and execution patterns. Without this support for variations in activity, the multiuser tests inevitably miss many bottlenecks encountered in actual deployment and, conversely, do encounter artificial bottlenecks that are never encountered in deployment, wasting time and resources. It is critical in multiuser and distributed applications that the benchmark harness correctly reproduces user-activity variations, delays, and data flows.
1.6.4 Taking Measurements
are being run and any special conditions that apply, e.g., weekend or after hours in the office. Sometimes the variation can give you useful information. It is essential that you always run an initial benchmark to precisely determine the initial times. This is important because, together with your targets, the initial benchmarks specify how far you need to go and highlight how much you have achieved when you finish tuning.
It is more important to run all benchmarks under the same conditions than to achieve the end-user environment for those benchmarks, though you should try to target the expected environment. It is possible to switch environments by running all benchmarks on an identical implementation of the application in two environments, thus rebasing your measurements. But this can be problematic: it requires detailed analysis because different environments usually have different relative
performance between functions (thus your initial benchmarks could be relatively skewed compared with the current measurements).
Each set of changes (and preferably each individual change) should be followed by a run of benchmarks to precisely identify improvements (or degradations) in the performance across all functions. A particular optimization may improve the performance of some functions while at the same time degrading the performance of others, and obviously you need to know this. Each set of changes should be driven by identifying exactly which bottleneck is to be improved and how much a speedup is expected. Using this methodology rigorously provides a precise target of your effort. You need to verify that any particular change does improve performance. It is tempting to change something small that you are sure will give an "obvious" improvement, without bothering to measure the performance change for that modification (because "it's too much trouble to keep running tests"). But you could easily be wrong. Jon Bentley once discovered that eliminating code from some simple loops can actually slow them down.[4] If a change does not improve performance,
you should revert back to the previous version.
[4]
"Code Tuning in Context" by Jon Bentley, Dr. Dobb's Journal, May 1999. An empty loop in C ran slower than one that contained an integer increment operation.
The benchmark suite should not interfere with the application. Be on the lookout for artificial performance problems caused by the benchmarks themselves. This is very common if no thought is given to normal variation in usage. A typical situation might be benchmarking multiuser systems with lack of user simulation (e.g., user delays not simulated causing much higher throughput than would ever be seen; user data variation not simulated causing all tests to try to use the same data at the same time; activities artificially synchronized giving bursts of activity and inactivity; etc.). Be careful not to measure artificial situations, such as full caches with exactly the data needed for the test (e.g., running the test multiple times sequentially without clearing caches between runs). There is little point in performing tests that hit only the cache, unless this is the type of work the users will always perform.
When tuning, you need to alter any benchmarks that are quick (under five seconds) so that the code applicable to the benchmark is tested repeatedly in a loop to get a more consistent measure of where any problems lie. By comparing timings of the looped version with a single-run test, you can
sometimes identify whether caches and startup effects are altering times in any significant way. Optimizing code can introduce new bugs, so the application should be tested during the
Optimizations should also be completely documented. It is often useful to retain the previous code in comments for maintenance purposes, especially as some kinds of optimized code can be more difficult to understand (and therefore to maintain).
It is typically better (and easier) to tune multiuser applications in single-user mode first. Many multiuser applications can obtain 90% of their final tuned performance if you tune in single-user mode and then identify and tune just a few major multiuser bottlenecks (which are typically a sort of give-and-take between single-user performance and general system throughput). Occasionally, though, there will be serious conflicts that are revealed only during multiuser testing, such as transaction conflicts that can slow an application to a crawl. These may require a redesign or rearchitecting of the application. For this reason, some basic multiuser tests should be run as early as possible to flush out potential multiuser-specific performance problems.
Tuning distributed applications requires access to the data being transferred across the various parts of the application. At the lowest level, this can be a packet sniffer on the network or server machine. One step up from this is to wrap all the external communication points of the application so that you can record all data transfers. Relay servers are also useful. These are small applications that just re-route data between two communication points. Most useful of all is a trace or debug mode in the communications layer that allows you to examine the higher-level calls and communication between distributed parts.
1.7 What to Measure
The main measurement is always wall-clock time. You should use this measurement to specify almost all benchmarks, as it's the real-time interval that is most appreciated by the user. (There are certain situations, however, in which system throughput might be considered more important than the wall-clock time; e.g., servers, enterprise transaction systems, and batch or background systems.) The obvious way to measure wall-clock time is to get a timestamp using
System.currentTimeMillis( ) and then subtract this from a later timestamp to determine the elapsed time. This works well for elapsed time measurements that are not short.[5] Other types of
measurements have to be system-specific and often application-specific. You can measure:
[5]
System.currentTimeMillis( ) can take up to half a millisecond to execute. Any measurement including the two calls needed to measure the time difference should be over an interval greater than 100 milliseconds to ensure that the cost of the
System.currentTimeMillis( ) calls are less than 1% of the total measurement. I generally recommend that you do not make more than one time measurement (i.e., two calls to System.currentTimeMillis( )) per second.
• CPU time (the time allocated on the CPU for a particular procedure)
• The number of runnable processes waiting for the CPU (this gives you an idea of CPU contention)
• Paging of processes
• Memory sizes
• Disk throughput
• Disk scanning times
• Network traffic, throughput, and latency
• Transaction rates
• Other system values
You need to be careful when running tests that have small differences in timings. The first test is usually slightly slower than any other tests. Try doubling the test run so that each test is run twice within the VM (e.g., rename main( ) to maintest( ), and call maintest( ) twice from a new main( )).
There are almost always small variations between test runs, so always use averages to measure
differences and consider whether those differences are relevant by calculating the variance in the results.
For distributed applications , you need to break down measurements into times spent on each component, times spent preparing data for transfer and from transfer (e.g., marshalling and unmarshalling objects and writing to and reading from a buffer), and times spent in network
transfer. Each separate machine used on the networked system needs to be monitored during the test if any system parameters are to be included in the measurements. Timestamps must be
synchronized across the system (this can be done by measuring offsets from one reference machine at the beginning of tests). Taking measurements consistently from distributed systems can be challenging, and it is often easier to focus on one machine, or one communication layer, at a time. This is usually sufficient for most tuning.
1.8 Don't Tune What You Don't Need to Tune
The most efficient tuning you can do is not to alter what works well. As they say, "If it ain't broke, don't fix it." This may seem obvious, but the temptation to tweak something just because you have thought of an improvement has a tendency to override this obvious statement.
The second most efficient tuning is to discard work that doesn't need doing. It is not at all
uncommon for an application to be started with one set of specifications and to have some of the specifications change over time. Many times the initial specifications are much more generic than the final product. However, the earlier generic specifications often still have their stamps in the application. I frequently find routines, variables, objects, and subsystems that are still being maintained but are never used and never will be used, since some critical aspect of these resources is no longer supported. These redundant parts of the application can usually be chopped without any bad consequences, often resulting in a performance gain.
In general, you need to ask yourself exactly what the application is doing and why. Then question whether it needs to do it in that way, or even if it needs to do it at all. If you have third-party products and tools being used by the application, consider exactly what they are doing. Try to be aware of the main resources they use (from their documentation). For example, a zippy DLL (shared library) that is speeding up all your network transfers is using some resources to achieve that speedup. You should know that it is allocating larger and larger buffers before you start trying to hunt down the source of your mysteriously disappearing memory. Then you can realize that you need to use the more complicated interface to the DLL that restricts resource usage, rather than a simple and convenient interface. And you will have realized this before doing extensive (and useless) object profiling, because you would have been trying to determine why your application is being a memory hog.
When benchmarking third-party components, you need to apply a good simulation of exactly how you will use those products. Determine characteristics from your benchmarks and put the numbers into your overall model to determine if performance can be reached. Be aware that vendor
benchmarks are typically useless for a particular application. Break your application down into a hugely simplified version for a preliminary benchmark implementation to test third-party
1.9 Performance Checklist
• Specify the required performance.
o Ensure performance objectives are clear.
o Specify target response times for as much of the system as possible.
o Specify all variations in benchmarks, including expected response ranges (e.g., 80% of responses for X must fall within 3 seconds).
o Include benchmarks for the full range of scaling expected (e.g., low to high numbers of users, data, files, file sizes, objects, etc.).
o Specify and use a benchmark suite based on real user behavior. This is particularly important for multiuser benchmarks.
o Agree on all target times with users, customers, managers, etc., before tuning.
• Make your benchmarks long enough: over five seconds is a good target. o Use elapsed time (wall-clock time) for the primary time measurements. o Ensure the benchmark harness does not interfere with the performance of the
application.
o Run benchmarks before starting tuning, and again after each tuning exercise. o Take care that you are not measuring artificial situations, such as full caches
containing exactly the data needed for the test.
• Break down distributed application measurements into components, transfer layers, and network transfer times.
• Tune systematically: understand what affects the performance; define targets; tune; monitor and redefine targets when necessary.
o Approach tuning scientifically: measure performance; identify bottlenecks; hypothesize on causes; test hypothesis; make changes; measure improved performance.
o Determine which resources are limiting performance: CPU, memory, or I/O. o Accurately identify the causes of the performance problems before trying to tune
them.
o Use the strategy of identifying the main bottlenecks, fixing the easiest, then repeating.
o Don't tune what does not need tuning. Avoid "fixing" nonbottlenecked parts of the application.
o Measure that the tuning exercise has improved speed.
o Target one bottleneck at a time. The application running characteristics can change after each alteration.
o Improve a CPU limitation with faster code and better algorithms, and fewer short-lived objects.
o Improve a system-memory limitation by using fewer objects or smaller long-lived objects.
o Improve I/O limitations by targeted redesigns or speeding up I/O, perhaps by multithreading the I/O.
• Work with user expectations to provide the appearance of better performance.
o Hold back releasing tuning improvements until there is at least a 20% improvement in response times.
o Avoid giving users a false expectation that a task will be finished sooner than it will. o Reduce the variation in response times. Bear in mind that users perceive the mean
response time as the actual 90th percentile value of the response times. o Keep the user interface responsive at all times.
o Aim to always give user feedback. The interface should not be dead for more than two seconds when carrying out tasks.
o Provide user-selectable tuning parameters where this makes sense. o Use threads to separate out potentially blocking functions.
o Calculate "look-ahead" possibilities while the user response is awaited.
o Provide partial data for viewing as soon as possible, without waiting for all requested data to be received.
o Cache locally items that may be looked at again or recalculated.
• Quality-test the application after any optimizations have been made.
• Document optimizations fully in the code. Retain old code in comments.
Chapter 2. Profiling Tools
If you only have a hammer, you tend to see every problem as a nail.
—Abraham Maslow
Before you can tune your application, you need tools that will help you find the bottlenecks in the code. I have used many different tools for performance tuning, and so far I have found the
commercially available profiler s to be the most useful. You can easily find several of these, together with reviews of them, by searching the Web using java+optimi and java+profile, or checking the various computer magazines. These tools are usually available free for an evaluation period, and you can quickly tell which you prefer using. If your budget covers it, it is worth getting several profilers: they often have complementary features and provide different details about the running code. I have included a list of profilers in Chapter 15.
All profilers have some weaknesses, especially when you want to customize them to focus on particular aspects of the application. Another general problem with profilers is that they frequently fail to work in nonstandard environments. Nonstandard environments should be rare, considering Java's emphasis on standardization, but most profiling tools work at the VM level, and the JVMPI ( Java Virtual Machine Profiler Interface) was only beginning to be standardized in JDK 1.2, so incompatibilities do occur. Even after the JVMPI standard is finalized, I expect there will be some nonstandard VMs you may have to use, possibly a specialized VM of some sort—there are already many of these.
When tuning, I normally use one of the commercial profiling tools, and on occasion where the tools do not meet my needs, I fall back on a variation of one of the custom tools and information
extraction methods presented in this chapter. Where a particular VM offers extra APIs that tell you about some running characteristics of your application, these custom tools are essential to access those extra APIs. Using a professional profiler and the proprietary tools covered in this chapter, you will have enough information to figure out where problems lie and how to resolve them. When necessary, you can successfully tune without a professional profiler, since the Sun VM does contain a basic profiler, which I cover in this chapter. However, this option is not ideal for the most rapid tuning.
From JDK 1.2, Java specifies a VM-level interface, consisting of C function calls, which allows some external control over the VM. These calls provide monitoring and control over events in the VM, allowing an application to query the VM and to be notified about thread activity, object creation, garbage collection, method call stack, etc. These are the calls required to create a profiler. The interface is intended to standardize the calls to the VM made by a profiler, so any profiler works with any VM that supports the JVMPI standard. However, in JDK 1.2, the JVMPI is only experimental and subject to change.
• Network packet sniffers (both hardware and software types, e.g., netstat )
• Process and thread listing utilities (top , ps on Unix; the task manager and performance monitor on Windows)
• System performance measuring utilities (vmstat , iostat , sar , top on Unix; the task manager and performance monitor on Windows)
2.1 Measurements and Timings
When looking at timings, be aware that different tools affect the performance of applications in different ways. Any profiler slows down the application it is profiling. The degree of slowdown can vary from a few percent to a few hundred percent. Using System.currentTimeMillis( ) in the code to get timestamps is the only reliable way to determine the time taken by each part of the application. In addition, System.currentTimeMillis( ) is quick and has no effect on application timing (as long as you are not measuring too many intervals or ridiculously short intervals; see the discussion in Section 1.7 in Chapter 1).
Another variation on timing the application arises from the underlying operating system . The operating system can allocate different priorities for different processes, and these priorities determine the importance the operating system applies to a particular process. This in turn affects the amount of CPU time allocated to a particular process compared to other processes. Furthermore, these priorities can change over the lifetime of the process. It is usual for server operating systems to gradually decrease the priority of a process over that process's lifetime. This means that the process will have shorter periods of the CPU allocated to it before it is put back in the runnable queue. An adaptive VM (like Sun's HotSpot ) can give you the reverse situation, speeding up code shortly after it has started running (see Section 3.3).
Whether or not a process runs in the foreground can also be important. For example, on a machine with the workstation version of Windows (most varieties including NT, 95, 98, and 2000),
foreground processes are given maximum priority. This ensures that the window currently being worked on is maximally responsive. However, if you start a test and then put it in the background so that you can do something else while it runs, the measured times can be very different from the results you would get if you left that test running in the foreground. This applies even if you do not actually do anything else while the test is running in the background. Similarly, on server machines, certain processes may be allocated maximum priority (for example, Windows NT and 2000 server version, as well as most Unix server configured machines, allocate maximum priority to network I/O processes).
This means that to get pure absolute times, you need to run tests in the foreground on a machine with no other significant processes running, and use System.currentTimeMillis( ) to measure the elapsed times. Any other configuration implies some overhead added to timings, and you must be aware of this. As long as you are aware of any extra overhead, you can usually determine whether any particular measurement is relevant or not.
Most profiles provide useful relative timings, and you are usually better off ignoring the absolute times when looking at profile results. Be careful when comparing absolute times run under different conditions, e.g., with and without a profiler, in the foreground versus in the background, on a very lightly loaded server (for example, in the evening) compared to a moderately loaded one (during the day). All these types of comparisons can be misleading.
to starting for the first time on a system that has been running for a while, and these both give different timings compared to an application that has been run several times previously on the system. All these variations need to be considered, and a consistent test scenario used. Typically, you need to manage the caches in the application, perhaps explicitly emptying (or filling) them, for each test run to get repeatable results. The other caches are difficult to manipulate, and you should try to approximate the targeted running environment as closely as possible, rather than test each possible variation in the environment.
2.2 Garbage Collection
The Java runtime system normally includes a garbage collector.[1] Some of the commercial profilers
provide statistics showing what the garbage collector is doing. You can also use the -verbosegc option with the VM. This option prints out time and space values for objects reclaimed and space recycled as the reclamations occur. The printout includes explicit synchronous calls to the garbage collector (using System.gc( )) as well as asynchronous executions of the garbage collector, as occurs in normal operation when free memory available to the VM gets low.
[1]
Some embedded runtimes do not include a garbage collector. All objects may have to fit into memory without any garbage collection for these runtimes.
System.gc( ) does not necessarily force a synchronous garbage collection. Instead, the gc( ) call is really a hint to the runtime that now is a good time to run the garbage collector. The runtime decides whether to execute the garbage collection at that time and what type of garbage collection to run.
It is worth looking at some output from running with -verbosegc. The following code fragment creates lots of objects to force the garbage collector to work, and also includes some synchronous calls to the garbage collector:
package tuning.gc; public class Test {
public static void main(String[] args) {
int SIZE = 4000; StringBuffer s; java.util.Vector v;
//Create some objects so that the garbage collector //has something to do
for (int i = 0; i < SIZE; i++) {
s = new StringBuffer(50); v = new java.util.Vector(30);
s.append(i).append(i+1).append(i+2).append(i+3); }
s = null; v = null;
System.out.println("Starting explicit garbage collection"); long time = System.currentTimeMillis( );
System.gc( );
System.out.println("Garbage collection took " + (System.currentTimeMillis( )-time) + " millis");
int[] arr = new int[SIZE*10];
//null the variable so that the array can be garbage collected time = System.currentTimeMillis( );
arr = null;
System.out.println("Starting explicit garbage collection"); System.gc( );
(System.currentTimeMillis( )-time) + " millis"); }
}
When this code is run in Sun JDK 1.2 with the -verbosegc option,[2] you get: [2] Note that -verbosegc can also work with applets by using java-verbosegcsun.applet.AppletViewer<URL>.
<GC: need to expand mark bits to cover 16384 bytes>
<GC: managing allocation failure: need 1032 bytes, type=1, action=1> <GC: 0 milliseconds since last GC>
<GC: freed 18578 objects, 658392 bytes in 26 ms, 78% free (658872/838856)> <GC: init&scan: 1 ms, scan handles: 12 ms, sweep: 13 ms, compact: 0 ms> <GC: 0 register-marked objects, 1 stack-marked objects>
<GC: 1 register-marked handles, 31 stack-marked handles> <GC: refs: soft 0 (age >= 32), weak 0, final 2, phantom 0>
<GC: managing allocation failure: need 1032 bytes, type=1, action=1> <GC: 180 milliseconds since last GC>
<GC: compactHeap took 15 ms, swap time = 4 ms, blocks_moved=18838> <GC: 0 explicitly pinned objects, 2 conservatively pinned objects> <GC: last free block at 0x01A0889C of length 1888>
<GC: last free block is at end>
<GC: freed 18822 objects, 627504 bytes in 50 ms, 78% free (658920/838856)> <GC: init&scan: 2 ms, scan handles: 11 ms, sweep: 16 ms, compact: 21 ms> <GC: 0 register-marked objects, 2 stack-marked objects>
<GC: 0 register-marked handles, 33 stack-marked handles> <GC: refs: soft 0 (age >= 32), weak 0, final 0, phantom 0> Starting explicit garbage collection
<GC: compactHeap took 9 ms, swap time = 5 ms, blocks_moved=13453> <GC: 0 explicitly pinned objects, 5 conservatively pinned objects> <GC: last free block at 0x019D5534 of length 211656>
<GC: last free block is at end>
<GC: freed 13443 objects, 447752 bytes in 40 ms, 78% free (657752/838856)> <GC: init&scan: 1 ms, scan handles: 12 ms, sweep: 12 ms, compact: 15 ms> <GC: 0 register-marked objects, 6 stack-marked objects>
<GC: 0 register-marked handles, 111 stack-marked handles> <GC: refs: soft 0 (age >= 32), weak 0, final 0, phantom 0> Garbage collection took 151 millis
...
The actual details of the output are not standardized and likely to change between different VM versions as well as between VMs from different vendors. As a comparison, this is the output from the later garbage collector version using Sun JDK 1.3:
[GC 511K->96K(1984K), 0.0281726 secs] [GC 608K->97K(1984K), 0.0149952 secs] [GC 609K->97K(1984K), 0.0071464 secs] [GC 609K->97K(1984K), 0.0093515 secs] [GC 609K->97K(1984K), 0.0060427 secs] Starting explicit garbage collection
[Full GC 228K->96K(1984K), 0.0899268 secs] Garbage collection took 170 millis
Starting explicit garbage collection
[Full GC 253K->96K(1984K), 0.0884710 secs] Garbage collection took 180 millis
for one of the synchronous garbage collections, which is wrapped by print statements from the code fragment (i.e., those lines not starting with a < or [ sign). However, these times include the times taken to output the printed statements from the garbage collector and are therefore higher times than those for the garbage collection alone. To see the pure synchronous garbage collection times for this code fragment, you need to run the program without the -verbosegc option.
In the previous examples, the garbage collector kicks in either because it has been called by the code fragment or because creating an object from the code fragment (or the runtime initialization) encounters a lack of free memory from which to allocate space for that object: this is normally reported as "managing allocation failure."
Some garbage-collector versions appear to execute their garbage collections faster than others. But be aware that this time difference may be an artifact: it can be caused by the different number of printed statements when using the -verbosegc option. When run without the -verbosegc option, the times may be similar. The garbage collector from JDK 1.2 executes a more complex scavenging algorithm than earlier JDK versions to smooth out the effects of garbage collection running in the background. (The garbage-collection algorithm is discussed briefly in Chapter 3. It cannot be tuned directly, but garbage-collection statistics can give you important information about objects being reclaimed, which helps you tune your application.) From JDK 1.2, the VM also handles many types of references that never existed in VM versions before 1.2. Overall, Java 2 applications do seem to have faster object recycling in application contexts than previous JDK versions.
It is occasionally worthwhile to run your application using the -verbosegc option to see how often the garbage collector kicks in. At the same time, you should use all logging and tracing options available with your application, so that the output from the garbage collector is set in the context of your application activities. It would be nice to have a consistent way to summarize the information generated with this verbose option, but the output depends on both the application and the VM, and I have not found a consistent way of producing summary information.
2.3 Method Calls
The main focus of most profiling tools is to provide a profile of method calls. This gives you a good idea of where the bottlenecks in your code are and is probably the most important way to pinpoint where to target your efforts. By showing which methods and lines take the most time, a good profiling tool can save you time and effort in locating bottlenecks.
Most method profilers work by sampling the call stack at regular intervals and recording the methods on the stack.[3] This regular snapshot identifies the method currently being executed (the
method at the top of the stack) and all the methods below, to the program's entry point. By
accumulating the number of hits on each method, the resulting profile usually identifies where the program is spending most of its time. This profiling technique assumes that the sampled methods are representative, i.e., if 10% of stacks sampled show method foo( ) at the top of the stack, then the assumption is that method foo( ) takes 10% of the running time. However, this is a sampling technique , and so it i