Full Terms & Conditions of access and use can be found at
http://www.tandfonline.com/action/journalInformation?journalCode=cbie20
Download by: [Universitas Maritim Raja Ali Haji] Date: 19 January 2016, At: 19:42
ISSN: 0007-4918 (Print) 1472-7234 (Online) Journal homepage: http://www.tandfonline.com/loi/cbie20
Survey of recent developments
Hadi Soesastro & Raymond Atje
To cite this article: Hadi Soesastro & Raymond Atje (2005) Survey of recent developments, Bulletin of Indonesian Economic Studies, 41:1, 5-34, DOI: 10.1080/00074910500072641 To link to this article: http://dx.doi.org/10.1080/00074910500072641
Published online: 19 Oct 2010.
Submit your article to this journal
Article views: 98
View related articles
ISSN 0007-4918 print/ISSN 1472-7234 online/05/010005-30 © 2005 Indonesia Project ANU DOI: 10.1080/00074910500072641
ISSN 0007-4918 print/ISSN 1472-7234 online/05/010005-30 © 2005 Indonesia Project ANU DOI: 10.1080/00074910500072641
SURVEY OF RECENT DEVELOPMENTS
Hadi Soesastro
Centre for Strategic and International Studies, Jakarta, and Australian National University
Raymond Atje
Centre for Strategic and International Studies, Jakarta
SUMMARY
The composition of the incoming cabinet has been a disappointment: the presi-dent’s clear election victory seemed to give him the opportunity to appoint a more strongly reformist group of ministers. The new government says it intends to involve the private sector heavily in infrastructure provision, and that it recognises the need to improve the business environment, but there has been little concrete progress so far, and it has yet to show the will and capacity to do what is required. In late December Aceh province was devastated by an earthquake and a cata-strophic tsunami. About a quarter of a million Indonesians were killed and count-less others injured. Vast numbers have lost their livelihoods, and material damage is estimated at $3 billion, although the natural gas producing facilities remain intact. The international community showed itself to be favourably dis-posed to the incoming government, and committed generous disaster assistance. The economy grew increasingly rapidly in 2004, and investment spending has at last begun to record sustained high rates of growth. The budget outcome for the year is expected to be reasonably close to plan, despite the previous government’s failure to reduce the enormous waste resulting from electricity and fuel price sub-sidies. Monetary policy was tightened toward the end of the year in response to accelerating inflation. A deposit insurance agency to be established under newly enacted legislation is unlikely to be able to prevent banking collapses, or the trans-fer of the resulting losses to the general public; the legislation seems merely to cod-ify most of the actions taken on an ad hoc basis in 1999–98 when the banking system collapsed. Meanwhile, yet another banking scandal has led to the closure of a private bank, after a seemingly unwarranted delay by the central bank.
The government has announced its intention gradually to adjust electricity and fuel prices upwards. The Constitutional Court has annulled a new electricity law allowing greater private sector participation and competition in this sector, how-ever. Similar court actions now seem likely whenever the government enacts laws aiming to enhance efficiency through these means.
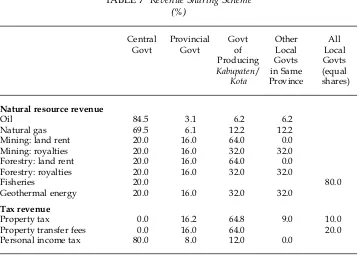
After less than four years of decentralisation, the underlying laws have been replaced. The new laws can be interpreted as an attempt to shift government authority back towards the centre, but there has also been an attempt to redress the regionally inequitable fiscal impact of current revenue sharing arrangements.
INTRODUCTION
The composition of the economic team of President Susilo Bambang Yudhoyono (SBY) has been something of a disappointment. The new Coordinating Minister for Economic Affairs, Aburizal Bakrie, is well known for the privileged position he enjoyed during and beyond the Soeharto era, and for the enormous costs the then government incurred as a result of the collapse of his Bank Nusa Nasional in 1998–99. The Minister of Finance, Jusuf Anwar, is an experienced bureaucrat, but may not have the political skills to make much headway in this most difficult portfolio. Sri Mulyani Indrawati and Mari Pangestu enter the cabinet with very strong economic credentials, but find themselves in the relatively less important planning and trade portfolios. The Minister of Labour, Fahmi Idris, is an experi-enced politician from Golkar, but all other economic portfolios are filled by largely unknown figures. Moreover, it is becoming clear that the incoming vice president, Jusuf Kalla, will be playing an important role in economic policy mak-ing, which is cause for concern given his perceived economic nationalist and pop-ulist leanings. Overall, this was widely regarded as a poor start for a president who received overwhelming support from voters in the October run-off election on the basis of hopes that he would be a reformist.
Popular expectations of the new government have clearly been excessive, not least as a result of promises made in SBY’s campaign speeches. In his inaugura-tion speech, he tried to wind back these expectainaugura-tions by stating that the govern-ment could not be expected to solve the country’s problems within 100 days. Nevertheless, he still hoped to create the impression that he would move quickly to deal with Indonesia’s many challenges, and so instructed his cabinet ministers immediately to formulate a 100-day program. The planning minister produced such an agenda by around mid-November, but the program was not made pub-lic, as by then the president had decided to de-emphasise this approach—perhaps in belated recognition that it was unrealistic. In any case, the program became an internal working document, and the vice president was made chair of a team to monitor its implementation.
The economic agenda consists of efforts to improve the investment climate (24 programs and 53 actions), to maintain macroeconomic stability (2 programs and 4 actions), and to raise public welfare and eradicate poverty (18 programs and 28 actions). This ambitious agenda was intended to signal clearly the importance the government attached to improving the investment climate. Unfortunately, how-ever, talk is cheap, and whatever attention the government gives to these pro-grams and actions can be easily undone by its actions or inaction elsewhere. For example, its decision to put off, yet again, the proper resolution of the long run-ning Cemex–Semen Gresik case (Kompas, 26/1/2005; Pangestu and Goeltom 2001: 164; Siregar 2001: 295) speaks volumes about the government’s willingness and ability to deliver on promises to improve the environment for doing business in Indonesia.
The end of the first 100 days, on 28 January, was an anti-climax. Performance cannot be objectively measured by outsiders, as details of the program have not been revealed. What the public and the business community want to hear are unambiguous statements about the direction of the country’s development for the next five years, and about the concrete actions that were intended, especially in addressing the issue of corruption. In this regard, a few arrests have been
made—including that of Abdullah Puteh, the governor of Aceh—but the process lacks credibility. Endemic corruption is unlikely to be stopped by legal action against a few corrupt officials, given that the courts and the legal bureaucracy are themselves ridden with corruption.
A new law, No. 25/2004 on National Development Planning, requires the gov-ernment to submit a Medium Term Development Plan (Rencana Pembangunan Jangka Menengah, RPJM) to the parliament within three months. The four prior-ities of the RPJM are:
• maintaining macroeconomic and fiscal sustainability, and continuing the reform of the financial sector;
• accelerating investment and exports;
• enhancing human resources through programs in education and health; and • developing infrastructure though opening up to private participation.
This fourth point is new, having been one of the main themes in the SBY/Kalla election campaign.
Details of the plan’s targets for 2005–09 were revealed in the economics co-ordinating minister’s remarks at the meeting of the CGI (Consultative Group on Indonesia) on 19 January. The government hopes to reduce unemployment, which was 9.5% in 2003, to 6.7% in 2009, and to cut poverty incidence by half, from 16.6% in 2004 to 8.2% in 2009. To achieve this, it argues that GDP growth must accelerate from 4.5% in 2003 to 7.2% in 2009, with an average annual growth rate of 6.6% over the next five years, and that the investment to GDP ratio will need to rise from 20.5% in 2004 to 28.4% in 2009 (Coordinating Ministry for Eco-nomic Affairs 2005a).
The growth, unemployment and poverty rate targets reflect SBY’s election campaign promises. There was some discussion at the time of the campaign about whether they were realistic, and they were generally perceived as little more than a wish list. But now the planning agency, Bappenas, appears to have been compelled to accept the targets as given, and all it has done is to estimate the investment it believes is needed to achieve them. This is a consequence of Indonesia’s new system of government, in which the president is directly elected. In the past, the president was elected by the People’s Consultative Assembly (MPR), and was given a mandate to implement the Broad Guidelines of State Pol-icy (Garis Besar Haluan Negara, GBHN) drafted by the MPR, which then formed the basis for the various Five Year Development Plans. Now that the president is directly elected by the people, the government’s development plan must, logi-cally, reflect the incoming president’s campaign platform.
RECENT DEVELOPMENTS The Tsunami
On the morning of 26 December 2004, an earthquake measuring 9.0 on the Richter scale rocked the northern part of Sumatra. It was followed by a massive tsunami that swept around the Indian Ocean, quickly reaching the coastal regions of Aceh province (known formally as Nanggroe Aceh Darussalam, NAD) and some parts of North Sumatra province. The tsunami inflicted catastrophic damage and losses on the local population, economy and administration. By February 2005 the
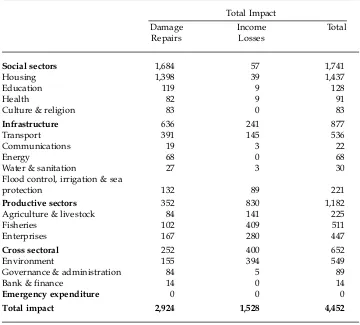
TABLE 1 Tsunami Damage and Projected Income Losses in Aceh ($ million)
Total Impact
Damage Income Total Repairs Losses
Social sectors 1,684 57 1,741
Housing 1,398 39 1,437
Education 119 9 128
Health 82 9 91
Culture & religion 83 0 83
Infrastructure 636 241 877
Transport 391 145 536
Communications 19 3 22
Energy 68 0 68
Water & sanitation 27 3 30 Flood control, irrigation & sea
protection 132 89 221
Productive sectors 352 830 1,182 Agriculture & livestock 84 141 225
Fisheries 102 409 511
Enterprises 167 280 447
Cross sectoral 252 400 652
Environment 155 394 549
Governance & administration 84 5 89
Bank & finance 14 0 14
Emergency expenditure 0 0 0
Total impact 2,924 1,528 4,452
Source: Bappenas (National Development Planning Agency) (2005).
ber of people dead and missing was estimated at 234,300—more than 5% of Aceh’s population of 4.4 million. Most of those missing were by then presumed dead. Tens of thousands more were displaced or made homeless, and had their livelihoods destroyed.
The World Bank office in Jakarta, in cooperation with Bappenas, has made a preliminary estimate of the cost of repairing or replacing all the assets that were damaged or destroyed (table 1), and of future income losses resulting from the disruption of economic activity. Total damage and income losses are put at about $4.5 billion, of which around two-thirds constitutes the cost of repairing damage, and the remainder is projected loss of income. It is further estimated that around 2.8 million people in Aceh have been affected by the disaster (World Bank 2005b).
Aceh province is on the north-western tip of Indonesia, and comprises 17 dis-tricts (kabupaten) and four municipalities (kota). Before the tsunami struck, 11 of the districts were classified as ‘least developed districts’ by the Ministry for the Development of Least Developed Regions. Given the extent of the tsunami’s
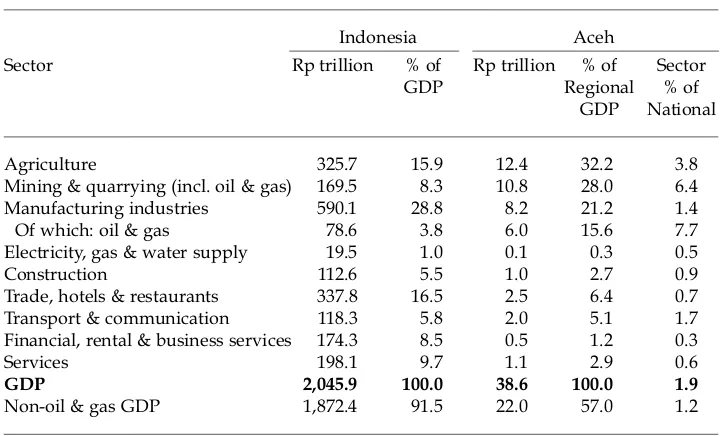
TABLE 2 GDP in Indonesia and Aceh (2003) (current prices)
Indonesia Aceh
Sector Rp trillion % of Rp trillion % of Sector GDP Regional % of
GDP National
Agriculture 325.7 15.9 12.4 32.2 3.8 Mining & quarrying (incl. oil & gas) 169.5 8.3 10.8 28.0 6.4 Manufacturing industries 590.1 28.8 8.2 21.2 1.4 Of which: oil & gas 78.6 3.8 6.0 15.6 7.7 Electricity, gas & water supply 19.5 1.0 0.1 0.3 0.5 Construction 112.6 5.5 1.0 2.7 0.9 Trade, hotels & restaurants 337.8 16.5 2.5 6.4 0.7 Transport & communication 118.3 5.8 2.0 5.1 1.7 Financial, rental & business services 174.3 8.5 0.5 1.2 0.3 Services 198.1 9.7 1.1 2.9 0.6
GDP 2,045.9 100.0 38.6 100.0 1.9
Non-oil & gas GDP 1,872.4 91.5 22.0 57.0 1.2
Source: CEIC Asia Database.
impact, however, it is likely that more kabupatenand kotawill be similarly classi-fied. Even before the tsunami, Aceh had been suffering from prolonged conflict over demands for secession, giving rise to many social problems. Education serv-ices in remote areas had been set back, with an estimated 900 schools in the con-flict-affected areas destroyed or damaged, and school attendance significantly lowered as a consequence. Meanwhile, health care had become less accessible because people were afraid to visit health facilities, for security reasons (World Bank 2005b). Many more schools have now been destroyed by the tsunami, and over 1,700 teachers are reported missing (Kompas, 19/1/2005).
Aceh’s GDP was around Rp 38.6 trillion in 2003, or approximately 1.8% of national GDP (table 2). The oil and gas and agricultural sectors dominate Aceh’s economy, accounting for 43% and 32%, respectively, of regional GDP. The oil and gas industry escaped the tsunami virtually unharmed. The most severely affected sector is fisheries, in terms of the number of worker casualties and capital stock (boats) destroyed. On the other hand, while North Sumatra province makes a larger contribution to the national economy (about 5.4% in 2003), the impact of the disaster there was relatively small. The most affected area in the province was its poorest district, Nias. Approximately 20% of its total land area was reported damaged, and there were about 220 casualties.
According to the World Bank, the cost of the tsunami to the national economy is likely to be moderate, with GDP growth in 2005 lowered by 0.1–0.4% (World Bank 2005b). The key industrial facilities in Aceh—producing liquid natural gas—escaped the tsunami largely unscathed, and any disruption to their activi-ties is likely to be temporary. Meanwhile, the government’s budget will not be
1
In particular, there has been controversy over whether there should be a strict limit on how long foreign military personnel may remain in Aceh to help tsunami victims and assist with reconstruction. The vice president’s assertion that there should be a limit of three months was quickly overturned by the government (Powell 2005).
affected significantly, since most of the funds needed for emergency relief and rehabilitation programs will come from external sources (assuming that all the pledged foreign assistance materialises). The Bank also argued that, in the longer run, the rebuilding of Aceh may actually stimulate GDP growth, especially through investment in such industries as cement and heavy equipment.
In contrast, the tsunami has devastated Aceh’s economy; total estimated dam-age and income losses are roughly equivalent to its annual GDP. The private sec-tor accounted for the bulk (78%) of total damage and income losses, with private housing damage accounting for almost half the total cost of damage to the province’s capital stock. The remaining losses were borne by the public sector (World Bank 2005b). While the oil and gas industry suffered no serious damage, most Acehnese obtain their incomes from agriculture, fisheries and commerce, all of which have been severely affected, with total damage costs and income losses estimated at around $1.2 billion.
The reconstruction of Aceh is a multi-year undertaking, which may be divided into a number of stages. The first phase is an emergency period, during which efforts will be focused on saving lives, dealing with injuries, and restoring basic infrastructure so as to provide local communities with access to clean water, basic health care and income earning opportunities. This may take perhaps six months. The next phase will be focused on restoring the economy: creating new jobs, rebuilding markets for people to buy and sell daily necessities and banks to facil-itate commerce, and restoring law and order. It may also be necessary to deal with potential conflicts among the local population over land titles, as the tsunami has destroyed ownership records and obliterated physical boundary markers. This may perhaps require another two years to complete. The third phase is to restore and rebuild economic and government systems, including transport and tele-communications and government and social institutions, perhaps requiring five years or more to complete.
The tsunami has deprived Aceh of much of its valuable human resources, in the form of teachers, lecturers and technicians of various kinds. This will undoubtedly have an adverse impact on its longer-term development, bearing in mind the time it takes to build up human capital through education and work experience. This makes a quick resolution of the secessionist issue even more important: Aceh will need to draw on the rest of Indonesia’s population to replace lost expertise, and the ability to do so will be limited in the face of contin-uing civil unrest. Should the conflict flare up again, the effort to rebuild Aceh will be seriously hampered.
A large amount has been pledged for Aceh’s reconstruction by foreign entities, both public and private, but the question of who should manage these funds has been of some concern. In particular, there has been resistance from certain groups to the direct involvement of foreign NGOs, firms, and military and other govern-ment agencies.1
It must be expected, however, that those who have contributed to the reconstruction program would want to have a say in how their money is
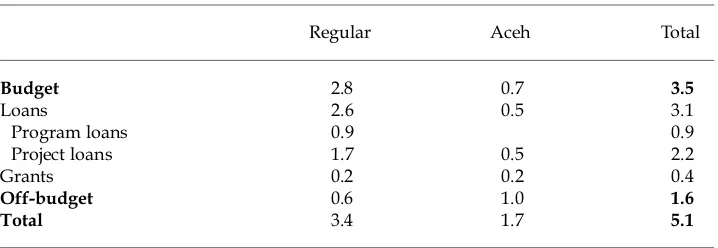
TABLE 3 Commitments by CGI to Indonesia, 2005 ($ billion)
Regular Aceh Total
Budget 2.8 0.7 3.5
Loans 2.6 0.5 3.1
Program loans 0.9 0.9
Project loans 1.7 0.5 2.2
Grants 0.2 0.2 0.4
Off-budget 0.6 1.0 1.6
Total 3.4 1.7 5.1
Source: Office of the Coordinating Minister for the Economy.
spent, and to have the process carefully monitored. Equally important is the fact that foreign expertise and technology can expedite emergency assistance and reconstruction work significantly, relative to what Indonesia could achieve alone.
The CGI Meeting
As expected, members of the CGI, which met on 19 and 20 January 2005, were eager to continue and extend their financing commitments to Indonesia under its new, seemingly reformist, government, and against the backdrop of the extra-ordinary outpouring of international concern for the countries devastated by the tsunami. The amount pledged under the regular arrangements totals $3.4 billion, of which $2.8 billion will be used to finance the budget deficit, and $0.6 billion will be disbursed directly to regional governments and NGOs (table 3). In addition, some $1.7 billion will be allocated to Aceh. Of this amount, $1.2 billion is in the form of on- and off-budget grants, and the remaining $0.5 billion is in project loans on very soft terms (i.e. zero or near zero interest). The total commitment to Indo-nesia for 2005 amounts to $5.1 billion. It has been reported that Germany, France and Italy will also provide debt swaps (the nature of which has not been speci-fied), in amounts to be determined after a full assessment of the disaster is made. The government expects to make principal repayments on its external debt in the amount of $5.5 billion in 2005. There will therefore be a net transfer from Indonesia to the CGI (excluding interest repayments) of $0.4 billion, while the stock of central government debt will be reduced by $2.9 billion ($5.5 billion minus $2.6 billion in new loans, shown in table 3). As of December 2004, the stock of sovereign external debt was $78.3 billion, of which 42.8% was owed to bilateral donors, 23.7% to multilateral agencies other than the IMF, and 12.4% to the IMF; 18.4% was in the form of export credits, while the remaining 2.7% encompassed uninsured commercial loans, leasing liabilities, and bonds (World Bank 2005a). The government revealed in the CGI meeting its intention to reduce the public debt to GDP ratio from 53% to 48% during 2005, and to stop foreign borrowing to finance budget deficits by 2009, in which case Indonesia would cease to be an ODA (official development assistance) recipient—as has already occurred with Thailand and Malaysia.
Any budget deficit would then have to be financed from domestic sources— primarily by the issue of bonds. Proceeds from privatisation are unlikely to remain a significant source of funds; there is little support for privatisation in the current domestic political economy climate, and pressure from the IMF to priva-tise is now negligible. Such considerations suggest that turning its back on devel-opment assistance may not be the optimal policy for Indonesia at its present stage of development, but successive governments since the Wahid administration (1999–2001) have adopted this as an objective in response to widespread negative sentiment about continued external borrowing by the central government. On the other hand, expenditure on wasteful subsidies driven by populist sentiment is twice as large as the projected budget deficit for 2005, so the ‘need’ for develop-ment assistance should not be overstated: the governdevelop-ment might well do better to focus on using its own resources more carefully, rather than continuing to rely on foreigners for additional funding. In any case, the public has yet to confront the choice between allowing the government to borrow to finance infrastructure and other development programs, on the one hand, and accepting much greater par-ticipation of the private sector (including large foreign private investors) in the financing and operation of various infrastructure projects, on the other.
In contrast with past practice, Indonesia chaired the CGI meeting, with the World Bank taking a back seat. This perhaps marks the beginning of a transfor-mation of the CGI process from a donor-led to an Indonesia-led one—fulfilling a desire expressed by Indonesian policy makers for some time (Bappenas 2003). More important than accession to the chairmanship, however, is the fact that the agenda of the meeting was determined and prepared by the Indonesian side. In the report that provided the basis for discussions in the meeting, prepared by the World Bank in consultation with government officials (World Bank 2005a), the government identified infrastructure and poverty eradication as its main con-cerns. Donors used the meeting to stress the importance of sustained economic reform efforts—in particular, combating corruption, which was seen as a key to improving the investment climate. Corruption and transparency were also the main issues in discussions on the management of aid for Aceh. In addition, donors emphasised the need for the government to produce clear guidelines on the privatisation of state-owned enterprises, having noted frequent policy changes in the past.
Two other features of the CGI meeting deserve mention (Basri 2005). The first was the dominance of the tsunami disaster in the discussion, which revealed a generous level of support from the international community to assist Indonesia in both relief operations and the rehabilitation and reconstruction of Aceh. This was also clearly evident during the earlier tsunami summit, held in Jakarta on 6 January, and attended by the prime ministers of Japan and Australia, among others. It is now up to Indonesia to demonstrate that it is capable of efficiently managing the large amount of financial assistance mobilised from public sources and private individuals all over the world.
Some economists, such as Rizal Ramli and Revrisond Baswir, have been vocal in criticising the government for its failure to exploit the goodwill of donors fully by pressing for a debt moratorium—or even debt forgiveness—in the CGI meet-ing and elsewhere, and there remains much confusion about this issue. The gov-ernment was indeed very cautious in its statements about the possibility of a debt
moratorium on the part of the Paris Club in its meeting in Paris on 12 January. Economics coordinating minister Aburizal Bakrie pointed out that if Indonesia accepted a debt moratorium, the amount of the grants and soft loans pledged to it might well be reduced by the amount of the debt repayments postponed, and that the government would still have to pay interest on the outstanding principal (Kompas, 7/2/2005). The minister also stated that the government would want an assurance that neither IMF conditionality nor the so-called ‘comparability treat-ment’ (a provision that any debt moratorium extended by public sector lenders through the Paris Club must be matched by a similar moratorium by private lenders through the London Club) would apply to Indonesia. In the event, Indo-nesia has so far (February 2005) availed itself only of the temporary debt mora-torium (for about 3 months) offered to tsunami-affected countries until a full assessment of the destruction has been made.
The second interesting aspect of the CGI meeting is the large amount of off-budget funding that is to be channelled directly to regional governments and NGOs—some $1 billion (about 60%) of the total assistance earmarked for Aceh, and $0.6 billion (21%) of regular commitments. This clearly shows a concern on the part of donors about the ability of the central government to use these funds transparently and to avoid their dissipation through corruption. The ability of NGOs to disburse aid efficiently and transparently still needs to be tested, but it is at least encouraging that the government has allowed this to happen.
MACROECONOMIC DEVELOPMENTS National Accounts
That macroeconomic stability pays off is suggested by various indicators of recent economic performance, which provide good reasons to be hopeful. To begin with, after declining a little in the first half of 2004, the rate of growth of quarterly GDP rebounded in the second semester to reach 6.7% year on year in the December quarter (table 4), well above the government’s target of 4.8% for the year, and by far the best result since the peak of the crisis in 1998. Non-oil and gas GDP grew even more impressively, by 8.0%.
It is important to bear in mind that the national accounts data are announced as preliminary estimates, subject to revision, so the latest releases should always be treated with caution. And indeed, in the latest data releases from the central statistics agency (BPS) there have been some quite significant revisions to previ-ous quarters’ output estimates. For example, on the production side, recorded growth rates for the large agriculture, livestock, forestry and fisheries (ALFF) sec-tor have been revised upward by 2.1–2.9 percentage points in the June and Sep-tember quarters of 2004, while those for the trade, hotels and restaurants sector have been revised downwards by as much as 2.5–3.9 percentage points over the first three quarters of the year. Quarterly growth rates for the manufacturing sec-tor for the period Q3 2003 to Q2 2004 have also seen significant upward revisions. On the expenditure side, there has been an astonishing upward revision of the September 2004 investment growth rate by 6.6 percentage points; the reported investment growth rate has now been very high for the last four quarters.
Given the magnitude of revisions to recent data, the apparent jump in GDP growth in the December quarter should be viewed with some scepticism. Taking
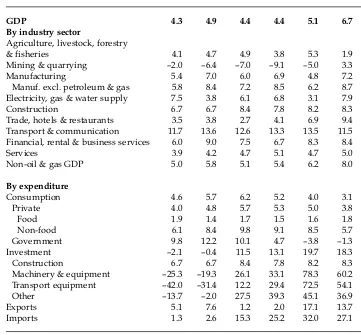
TABLE 4 Components of GDP Growth (2000 prices; % p.a. year on year)
Sep-03 Dec-03 Mar-04 Jun-04 Sep-04 Dec-04
GDP 4.3 4.9 4.4 4.4 5.1 6.7 By industry sector
Agriculture, livestock, forestry
& fisheries 4.1 4.7 4.9 3.8 5.3 1.9 Mining & quarrying –2.0 –6.4 –7.0 –9.1 –5.0 3.3 Manufacturing 5.4 7.0 6.0 6.9 4.8 7.2 Manuf. excl. petroleum & gas 5.8 8.4 7.2 8.5 6.2 8.7 Electricity, gas & water supply 7.5 3.8 6.1 6.8 3.1 7.9 Construction 6.7 6.7 8.4 7.8 8.2 8.3 Trade, hotels & restaurants 3.5 3.8 2.7 4.1 6.9 9.4 Transport & communication 11.7 13.6 12.6 13.3 13.5 11.5 Financial, rental & business services 6.0 9.0 7.5 6.7 8.3 8.4 Services 3.9 4.2 4.7 5.1 4.7 5.0 Non-oil & gas GDP 5.0 5.8 5.1 5.4 6.2 8.0
By expenditure
Consumption 4.6 5.7 6.2 5.2 4.0 3.1 Private 4.0 4.8 5.7 5.3 5.0 3.8 Food 1.9 1.4 1.7 1.5 1.6 1.8 Non-food 6.1 8.4 9.8 9.1 8.5 5.7 Government 9.8 12.2 10.1 4.7 –3.8 –1.3 Investment –2.1 –0.4 11.5 13.1 19.7 18.3 Construction 6.7 6.7 8.4 7.8 8.2 8.3 Machinery & equipment –25.3 –19.3 26.1 33.1 78.3 60.2 Transport equipment –42.0 –31.4 12.2 29.4 72.5 54.1 Other –13.7 –2.0 27.5 39.3 45.1 36.9 Exports 5.1 7.6 1.2 2.0 17.1 13.7 Imports 1.3 2.6 15.3 25.2 32.0 27.1
Source: CEIC Asia Database.
the data at face value, however, most of the major sectors now seem to be grow-ing robustly, with ALFF the exception, and with mingrow-ing and quarrygrow-ing (includ-ing oil and gas) return(includ-ing to positive growth after a long period of disappoint(includ-ing results. On the expenditure side, consumption—although by far the largest com-ponent of spending on GDP—accounted for only around 33% of overall GDP growth in the year to Q4 2004. This was partly the consequence of negative growth in government consumption in the second semester (compared with an extended period of high growth in late 2003 and early 2004), but household con-sumer spending has also been slowing a little now for three consecutive quarters, falling from 5.7% to just 3.8%. Rapid expansion of investment and export demand (18% and 14%, respectively) made strong contributions to total demand growth,
Q1-01 Q3-01 Q1-02 Q3-02 Q1-03 Q3-03 Q1-04 Q3-04 -40
0 40 80 120
Motorcycles
Cars
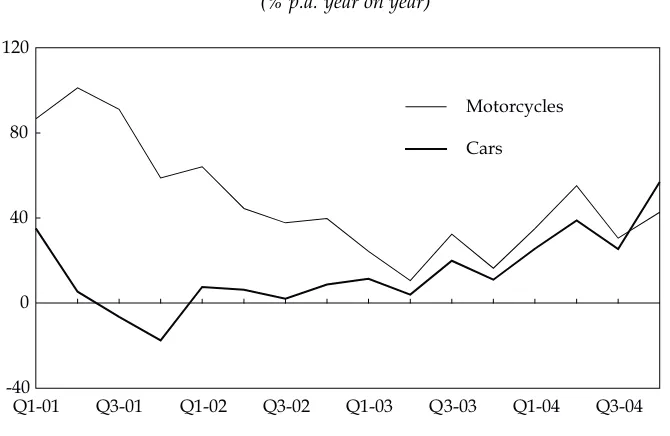
FIGURE 1 Growth of Motorcycle and Car Sales (% p.a. year on year)
Source: CEIC Asia Database.
although this was partially offset by even more rapid growth in imports, which grew by about 27%.
Consumption of non-food items remains robust, although the growth rate has slowed to 5.7% from 9.8% in the first quarter of 2004. Continued strong sales of cars and motor cycles have made a substantial contribution to growth in aggre-gate demand: such sales increased by 57% and 43% year on year, respectively, in Q4 2004, with sales growth for both types of vehicles up significantly throughout 2004 from far more subdued levels during much of 2003 (figure 1).
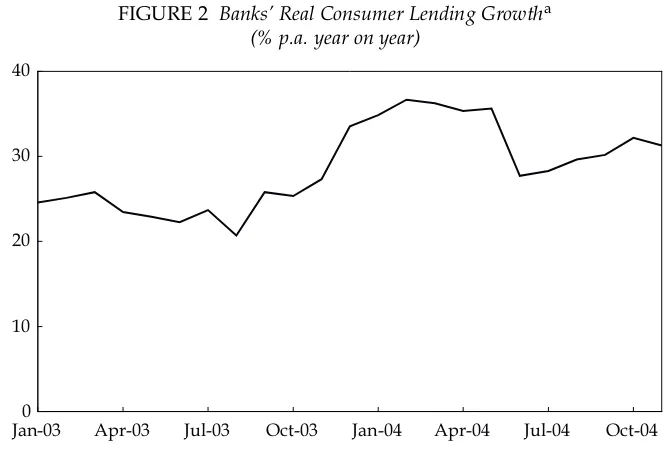
Vigorous growth of private consumption in recent years has been financed largely by plentiful loans from banks and non-bank financial institutions. Bank lending for consumption has been dominated by housing loans and credit card lending (Bank Indonesia 2004a: 20). Indeed, bank consumer credit has been grow-ing rapidly since 2000, recordgrow-ing an average year-on-year rate of well over 30% in real terms during 2004 (figure 2). Meanwhile, in the two years to September 2004, the average nominal interest rate charged by commercial banks on con-sumer loans fell from 20.1% to 17.0% p.a. Other financial institutions—multi-finance companies in particular—have concentrated on providing loans to consumers for the purchase of cars and motorcycles. Such borrowers often prefer multi-finance companies to banks because they have simpler procedures.
Meanwhile, investment activity gained strength in the third quarter of 2004, growing by 19.7% year on year, thus continuing a trend that began in Q1 2004 (table 4), although its growth rate slipped back slightly in the fourth quarter. As noted by Aswicahyono and Hill (2004), investment in plant and equipment has been growing at a much faster rate recently than construction; in the fourth
FIGURE 2 Banks’ Real Consumer Lending Growtha (% p.a. year on year)
Jan-030 Apr-03 Jul-03 Oct-03 Jan-04 Apr-04 Jul-04 Oct-04 10
20 30 40
aLending data are adjusted for changes in the CPI.
Source: CEIC Asia Database.
ter of 2004 the rate was 60% year on year, compared with a much more modest 8.3% in construction, although in absolute terms the latter still accounts for more than three-quarters of total investment. The reconstruction of Aceh may provide some stimulus to investment in construction-related industries.
Capital accounts data show that in the first nine months of 2004 foreign direct investment flows turned positive, to $619 million, in contrast to the negative flows in the same period of the previous year (and for most of the post-crisis period). Portfolio investment during the first nine months continued to be posi-tive, at $1,772 million. Meanwhile, the Investment Coordinating Board (BKPM) reports foreign investment approvals during this period of $8.0 billion—a 32% increase compared to the same nine months in the previous year, although still well below pre-crisis levels. Likewise, the level of overall investment (foreign plus domestic) remains well below that before the crisis. The ratio of investment to GDP continues to hover around 20%, compared with around 30% previously, the earlier level presumably being more or less sufficient to absorb new entrants to the labour force.
Meanwhile, the growth rate of goods and services exports jumped to far higher levels in the second semester (14–17%) than in the first (1–2%), according to the national accounts data. Balance of payments data suggest that this rapid expan-sion has been led by non-oil and gas exports—in particular, manufactures (which grew by 34% in the year to Q3 2004) and agricultural commodities (24.5%). It should be noted, however, that the significant increase in oil and gas exports was due mainly to the continued rise in prices, not volumes, which have tended to decline.
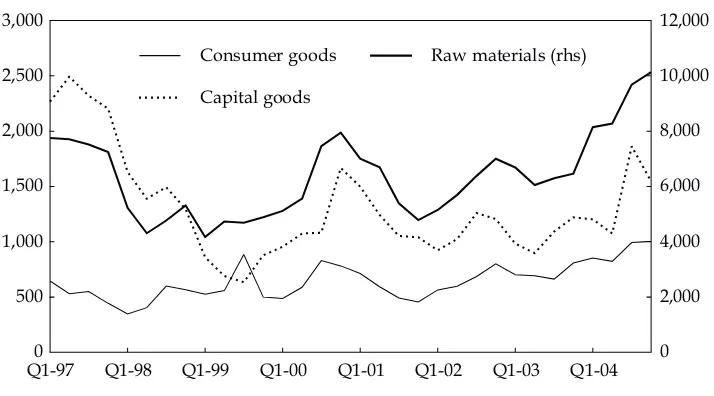
FIGURE 3 Imports by Main Components ($ million per quarter)
Q1-970 Q1-98 Q1-99 Q1-00 Q1-01 Q1-02 Q1-03 Q1-04 500
1,000 1,500 2,000 2,500 3,000
0 2,000 4,000 6,000 8,000 10,000 12,000
Consumer goods
Capital goods
Raw materials (rhs)
Source: CEIC Asia Database.
Recent trade data need to be interpreted with caution, however. In January 2004, several customs offices began to transmit import data, hitherto sent as hard copy, through an electronic data interchange (EDI) system. In May 2004, the 11 largest customs offices started to send export data electronically as well, but using a different system from that used for imports. The remaining 108 offices continued to send data in hard copy form. The reliability of the data sent through EDI is questionable, as BPS is still trying to overcome various problems, includ-ing the need to train its personnel to handle electronic data properly. This may partly explain the sharp increase in export growth in the third quarter.
Japan, the US, Singapore, China and Malaysia continued to be the main desti-nations for Indonesia’s exports, absorbing around 47.1% of non-oil and gas exports during the period January to November 2004. In the third quarter of 2004, exports to China and the US markets increased sharply, by 45% and 42% (year on year), respectively, while exports to Japan and Malaysia increased by 20% and 21%, respectively; exports to Singapore were stagnant.
By contrast with exports, the growth of goods and services imports has been running at very high levels throughout 2004, peaking at 32% year on year in the third quarter. Trade data show that imports amounted to $41.5 billion in the first 11 months of 2004, or around 40% higher than in the same period a year earlier. The upsurge was due mainly to the continued increase in oil prices and the rapid expansion in imports of raw materials, which account for by far the bulk of total imports (figure 3).
Fiscal Issues
A preliminary report on the outcome of the 2004 budget suggests that the actual budget deficit for that year was Rp 27.8 trillion (around 1.4% of GDP), a little
2
The introduction of less onerous reserve requirements for smaller banks provides a strange contrast with BI’s desire to bring about a consolidation of the banking system through mergers and acquisitions (Bank Indonesia 2005b).
higher than the government’s projection of Rp 26.3 trillion (table 5). The govern-ment is said to have managed to increase its revenue by around Rp 4.1 trillion, primarily from non-tax sources. On the other hand, expenditure also rose by a larger amount, resulting in the higher than planned deficit. The spending increase was due mainly to a sharp rise in fuel subsidies, about 16% above the government’s projection. However, this was largely caused, and roughly matched, by increases in revenues from oil and gas, because of the current policy of holding domestic fuel prices constant in the face of rising world prices. The government has recently announced its intention to increase the prices of some types of fuel by 40% in 2005, but it has yet to convince the public of the need for the price hike, so it cannot be assumed that it will have the political will to follow through on its announcement.
The effect of the earthquake and tsunami disaster on the 2004 budget is of course almost negligible, since it occurred just days before the end of the fiscal year. (The 2004 budget had apportioned Rp 2 trillion for emergency relief spend-ing in the event of natural disasters. Just Rp 50 billion was spent on emergency relief in Aceh and North Sumatra, while around Rp 1,620 billion had been spent elsewhere throughout the year. The 2005 budget also allocates Rp 2 trillion for natural disaster relief.) It is too early to know how the disaster will affect the 2005 budget. Some members of the parliament (DPR) have called for it to be revised, but the government has so far refused, arguing that it is too early to undertake such a revision. In any case, pledges of financial assistance from the international community seem likely to cover much, if not all, of the government’s increased spending on reconstruction.
Monetary Developments
From 1 July 2004 Bank Indonesia (BI) increased the minimum reserve require-ment from 5% to ratios ranging up to 8%, depending on the size of the bank in question. No explanation was given for introducing the distortion of requiring larger banks to have higher reserves.2
The policy change was part of a package intended ‘to improve macroeconomic stability’ (Bank Indonesia 2004b), and pre-sumably reflected concern about a rapid weakening of the rupiah against the dol-lar, by 11%, during February and June. It is unclear why BI chose to absorb excess liquidity by artificially increasing the demand for base money in this way, rather than simply relying on the established technique of reducing its supply through open market operations.
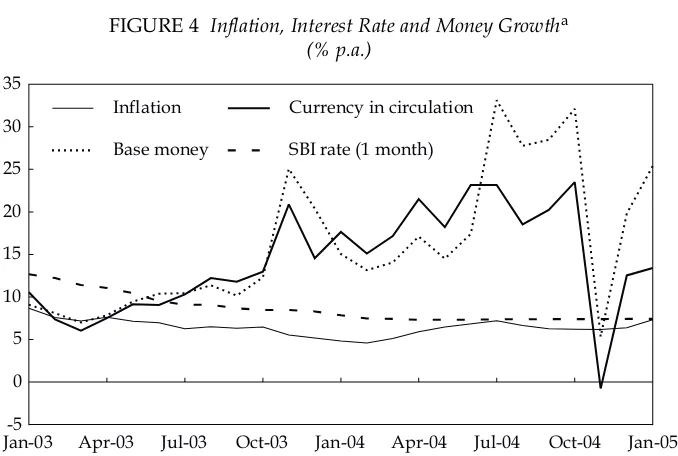
Notwithstanding this ostensible commitment to absorb excess liquidity, with the exception of the last two months of 2004 the central bank failed to keep mon-etary policy sufficiently tight to hold inflation down to the level achieved in Feb-ruary (just under 5%), much less reduce it further. It did, however, manage to hold it just below the upper bound (6.5%) of its target range for the year (figure 4). Base money grew rapidly during much of the second semester, but this was largely in response to the increased demand for it on the part of banks following the rise in their reserve requirements, and to this extent was not of itself
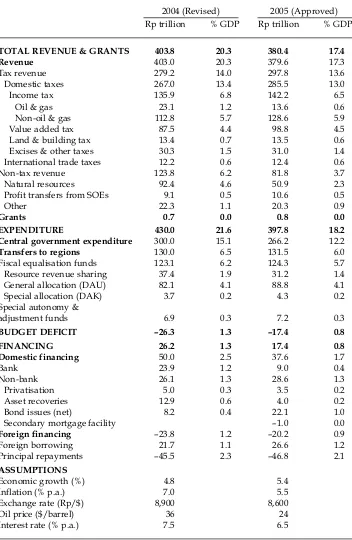
TABLE 5 Approved Budgets for 2004 and 2005
2004 (Revised) 2005 (Approved) Rp trillion % GDP Rp trillion % GDP
TOTAL REVENUE & GRANTS 403.8 20.3 380.4 17.4 Revenue 403.0 20.3 379.6 17.3 Tax revenue 279.2 14.0 297.8 13.6 Domestic taxes 267.0 13.4 285.5 13.0 Income tax 135.9 6.8 142.2 6.5 Oil & gas 23.1 1.2 13.6 0.6 Non-oil & gas 112.8 5.7 128.6 5.9 Value added tax 87.5 4.4 98.8 4.5 Land & building tax 13.4 0.7 13.5 0.6 Excises & other taxes 30.3 1.5 31.0 1.4 International trade taxes 12.2 0.6 12.4 0.6 Non-tax revenue 123.8 6.2 81.8 3.7 Natural resources 92.4 4.6 50.9 2.3 Profit transfers from SOEs 9.1 0.5 10.6 0.5
Other 22.3 1.1 20.3 0.9
Grants 0.7 0.0 0.8 0.0
EXPENDITURE 430.0 21.6 397.8 18.2 Central government expenditure 300.0 15.1 266.2 12.2
Transfers to regions 130.0 6.5 131.5 6.0 Fiscal equalisation funds 123.1 6.2 124.3 5.7 Resource revenue sharing 37.4 1.9 31.2 1.4 General allocation (DAU) 82.1 4.1 88.8 4.1 Special allocation (DAK) 3.7 0.2 4.3 0.2 Special autonomy &
adjustment funds 6.9 0.3 7.2 0.3
BUDGET DEFICIT –26.3 1.3 –17.4 0.8 FINANCING 26.2 1.3 17.4 0.8 Domestic financing 50.0 2.5 37.6 1.7
Bank 23.9 1.2 9.0 0.4
Non-bank 26.1 1.3 28.6 1.3
Privatisation 5.0 0.3 3.5 0.2 Asset recoveries 12.9 0.6 4.0 0.2 Bond issues (net) 8.2 0.4 22.1 1.0 Secondary mortgage facility –1.0 0.0
Foreign financing –23.8 1.2 –20.2 0.9 Foreign borrowing 21.7 1.1 26.6 1.2 Principal repayments –45.5 2.3 –46.8 2.1
ASSUMPTIONS
Economic growth (%) 4.8 5.4 Inflation (% p.a.) 7.0 5.5 Exchange rate (Rp/$) 8,900 8,600 Oil price ($/barrel) 36 24 Interest rate (% p.a.) 7.5 6.5
Source: Adapted from Law 35/2004 and Law 36/2004.
FIGURE 4 Inflation, Interest Rate and Money Growtha (% p.a.)
Jan-03-5 Apr-03 Jul-03 Oct-03 Jan-04 Apr-04 Jul-04 Oct-04 Jan-05 0
5 10 15 20 25 30 35
Inflation
Base money
Currency in circulation
SBI rate (1 month)
aCurrency in circulation is the major component of base money. Growth in the latter has
been severely distorted by changes during this period in the minimum required reserves that must be held by banks.
Source: CEIC Asia Database.
ary. Because recent base money growth has been significantly influenced by this policy shift, it is more helpful to focus on the growth of currency in circulation— the major component of base money—which was not affected in this way.
Currency grew at rates averaging around 20% for most of the year, and on an increasing trend. This is too high to be able to sustain a low rate of inflation, as BI has implicitly acknowledged by setting a target for base money growth in 2005 of between 11.5% and 12.5%, based on projected economic growth of 5.5% and infla-tion of 6–7%. This is in line with the approach to inflainfla-tion targeting suggested by McLeod (2003: 318–19). It appears, however, that this policy will soon be aban-doned, as BI announced simultaneously that it intends to phase out the use of the monetary base as its anchor for inflation targeting from mid-2005, and to rely instead on interest rates for that purpose (Bank Indonesia 2005a). One of the rea-sons given is that people have become increasingly accustomed to BI using the interest rate as its policy anchor (Koran Tempo, 11/1/2005). This is hardly surpris-ing, since that is what it has been doing all along, regardless of what it has been saying about its approach to inflation targeting. BI has never really been serious about using base money as the anchor, as is evident from the contrast between the smooth trajectory of the SBI (Bank Indonesia Certificate) rate over time and the far more volatile growth rate of base money. In other words, the supply of base money has always been set with a view to achieving a desired interest rate, not a desired rate of inflation.
The relatively satisfactory inflation outcome for 2004 was achieved in spite of potentially destabilising events in the fourth quarter, such as the second round of
3
The New Year celebration was subdued following the tragic events in Aceh and North Sumatra.
the presidential election in October, followed by the fasting month (Ramadhan) and Lebaran in November, and then Christmas celebrations in December.3
As is usually the case during Ramadhan, increases in the prices of food and clothing were the main contributors to inflation. In November, price rises for intercity transport services also contributed significantly, as people went home for the one-week Lebaran holiday. Prices in general continued to increase rapidly through December and January, however, such that the annualised monthly rate of infla-tion jumped from roughly zero in September to nearly 19% in January. In response to this end of year surge, perhaps, the central bank has tightened its monetary policy significantly in recent months, such that year-on-year growth of currency in circulation was only 13.4% in January. This has caused a very slight increase in SBI interest rates after many months of gradual decline.
Deposit Insurance
In September 2004, the DPR passed a new law, No. 24/2004, to establish a Deposit Insurance Agency (Lembaga Penjamin Simpanan, LPS), which has been seen as a prerequisite for removal of the blanket guarantee of bank deposits introduced early in 1998. The law will come into force in September 2005. Participation is mandatory for all banks operating in Indonesia (article 8.1), including foreign banks. The blanket guarantee will be phased out in stages, and within 18 months after the law becomes effective the agency will insure all deposits up to a value of Rp 100 million.
Article 2 of the law states that the agency is an independent, transparent and accountable body, but the likelihood of its being truly independent seems slight, since it is responsible to the president, and its commissioners will be appointed by the president on the recommendation of the finance minister (article 65). The more important question is whether the deposit coverage (Rp 100 million— about $11,000) is enough to prevent a bank run. The experience of November 1997, when 16 small banks were closed, and deposits up to about $6,000 indem-nified against loss, clearly suggests otherwise. The bulk of banking system deposits were in individual amounts much larger than $6,000. Their owners quickly began to withdraw their funds, since this guarantee was virtually mean-ingless to them. The result was a huge run on the banks that ended up costing the government about $50 billion (Frécaut 2004), perhaps 10 times the cost imposed by the recent tsunami.
Presumably the bulk of funds held by the banks today is in the form of deposits far greater than $11,000, so it is hard to see why the government imag-ines this new deposit insurance arrangement is capable of preventing a recur-rence of something similar. Indeed, it should be recalled that a run on Bank Central Asia took place in May 1998—some months after the blanket guarantee was in place. This episode suggests that even if all depositors are fully insured, bank runs cannot be assumed to be impossible. Thus it seems highly unlikely that the introduction of deposit insurance along the lines contemplated in the new law will protect the economy from bank runs in the future. Indeed, the new law seems to try to codify most of the actions that were taken on an ad hocbasis when the
4
The stated margins are between working capital loan rates and 1-month time deposit rates, averaged across all banks (source: CEIC Asia Database).
5
Five securities houses are now under investigation for their alleged involvement in the scandal.
6
Forcing bank owners to inject much larger amounts of equity might persuade at least some of them that they would prefer to employ their capital elsewhere. This, in turn, might
banking system collapsed in 1998, such that the new agency would simply become IBRA (the Indonesian Bank Restructuring Agency) with a new name if there is a further collapse in the future. The enormity of the losses sustained by the government using this approach to deal with systemic bank runs should give pause for serious concern.
Banking Scandals: No End in Sight
On the surface there seems to be continuing improvement in the performance of the banking sector overall, with strong lending growth and a narrowing margin between loan and deposit rates (from 8.8% in February to 7% in December).4
The average nominal lending rate for financing working capital fell from 14.1% at the end of the second quarter to 13.4% in December 2004. Lending was strong throughout the second semester, resulting in a 23% increase in loans outstanding for 2004 as a whole.
On the other hand, the sector seems unable to be rid of sporadic banking scan-dals (Kenward 2004: 26). The most recent involved Bank Global Internasional, a publicly listed private bank. The scandal involved fictitious lending activities val-ued at Rp 30 billion and fictitious investment valval-ued at approximately Rp 800 billion, which had the effect of boosting its capital adequacy ratio (CAR) artifi-cially. BI froze the operations of Bank Global in December, and then revoked its licence in January, after the bank’s true CAR plunged to minus 39%. The damage could have been contained had BI acted immediately following a warning by the Capital Market Supervisory Agency (Bapepam) in June 2004 about potentially fraudulent activities of Bank Global, following its failure to register its securities with the Indonesian Central Securities Depository (KSEI), as listed companies are required to do.5
It is troubling that BI took so long to respond to Bapepam’s warning, allowing the bank’s CAR to fall so far before it acted (Witular and Komandjaja 2004). As the prudential regulator, BI must or should have known what was happening to Bank Global’s CAR, properly measured. This and other bank scandal episodes clearly illustrate the danger of reliance on improved prudential regulation as one of the key protections against bank failures, although this is not to suggest that Indonesia should abandon prudential supervision altogether. What is important is to focus prudential regulation and supervision on what really matters, rather than imposing ever more controls (Fane 1998: 298–9). In New Zealand, for instance, the only prudential controls are minimum CARs, limits on lending to related firms, and strict disclosure rules. Fane suggests raising banks’ minimum CAR significantly to perhaps 20%, and backing this with tight rules on classifica-tion of doubtful loans and on making prompt and adequate provisions against them.6
In contrast to the Bank Global case, in which accumulated losses within
result in the sale of some of these banks to other banks, thus encouraging the consolida-tion of the banking sector as the government wishes.
the banking system once again have become a new fiscal burden for the govern-ment, a high minimum CAR requirement allows the prudential supervisor greater opportunity to detect any deterioration in banks’ capital, and to suspend their operations before capital turns negative.
TACKLING MAJOR CHALLENGES The Infrastructure Challenge
The magnitude of Indonesia’s infrastructure problems has been outlined by the World Bank (table 6), which suggests three main explanations for Indonesia’s poor infrastructure (World Bank 2005a). First, the economic crisis of 1997–98 dra-matically reduced the country’s financial capacity to maintain infrastructure and make new investments in it. The Bank estimated, for example, that only 3% of GDP was allocated for infrastructure maintenance and development in 2002, down sharply from 7% in 1996. Second, even before the crisis, infrastructure development was held back by poor institutional and regulatory frameworks, and by corruption. Third, local governments have been given control of infra-structure under regional autonomy, but they are not being provided with ade-quate funds for infrastructure development; in addition, there are overlaps between the various levels of government in the provision of infrastructure.
The Bank further estimated that Indonesia needs to invest at least 5% of GDP in infrastructure to achieve 6% growth, although this figure is not universally accepted. The economics coordinating minister has formed a Team on the Financ-ing of Infrastructure Development (Tim Pembiayaan Pembangunan Infrastruk-tur, TPPI), which has estimated that total infrastructure financing needs for the period 2005–09 amount to Rp 1,303 trillion (about $140 billion). This translates to roughly 10% of GDP annually—twice the amount estimated by the Bank—which seems rather unrealistic, as it would account for about half of total fixed capital formation each year.
It is interesting to consider how the government intends to finance such huge investments. The economics coordinating minister has pointed out that ‘the com-parison between needs and government funding potential shows a huge and infeasible financing gap—between Rp 400–600 trillion’ (Coordinating Ministry for Economic Affairs 2005b). Raden Pardede, head of the TPPI, has explained the basis for this estimate, asserting that only about 25% of the total infrastructure spending needs could be financed domestically through the budget, the banking system and local institutional investors (insurance companies, pension funds and mutual funds), while an additional 18% could be mobilised domestically by encouraging ‘cash rich’ corporations to invest in infrastructure. Only about 7% could be expected to come from multilateral agencies and bilateral donors, leav-ing the remainleav-ing gap of Rp 400–600 trillion to be financed by foreign private investors (Kompas, 12/1/2005).
The government’s hopes for mobilising domestic resources appear overly opti-mistic; it seems doubtful that even cash rich corporations would want such a large exposure to infrastructure, and the various kinds of financial institutions would
TABLE 6 Infrastructure Challenges
Water and Sanitation
• Water access is low—22% of the population does not have access to ‘improved’ water, and only 14% are connected to municipal water supplies.
• Sanitation services are lacking—only 1.3% of the population are reached by sewerage networks.
• Municipal water companies (PDAMs) are struggling—over two-thirds are loss-making; water unaccounted for is over 40%; and tariffs are well below cost.
Telecommunications
• Fixed line access is the lowest in the region—covering only 4% of the popula-tion.
• Massive investment is needed, but funding is a challenge—raising teledensity by just 1% will cost $330 million.
Power
• Access is low—currently, 43% of the population is without power (roughly 90 million people, including many of the poorest).
• Investment needs are high—an estimated $15–17 billion is needed before 2012 to provide an additional 9,700 megawatts of generation capacity, plus expanded transmission and distribution for 1.6 million connections annually.
Roads and Road Transport
• Spending has declined—from 22% of the national development budget in 1993 to 11% in 2000.
• Maintenance is lacking—the proportion of the road budget allocated for main-tenance fell from 30% in 1985 to below 10% in 2000.
• Congestion is a problem—significant capacity expansion is needed, but little has been added, and urbanisation trends will only worsen the problem (as sug-gested by the rapid growth in the number of vehicles on the roads).
Source: World Bank (2005a).
probably have similar reservations. Moreover, it may be unwise to direct such sub-stantial sums so quickly into infrastructure, because of capacity and administra-tive constraints, notwithstanding the obvious need for improvement in this area. At least as important as the financing problem is the need for policy reform in relation to the infrastructure sector. A clearer overall strategy is needed, together with much greater certainty in relation to the regulatory framework. Previous governments had already made a start with such reforms, with the enactment of a new telecommunications law in 1999, a new oil and gas law in 2001 (which affects investment in gas pipelines), and a new electricity law in 2002, all of which were designed to introduce competition to industries previously dominated, if not monopolised, by the state. These reform efforts received a serious setback in mid December 2004, however, when the recently established (and thus inexperi-enced) Constitutional Court annulled Electricity Law 20/2002, upholding the highly contentious complaint that it violated article 33 of the constitution, on state
7
It seems odd to apply the label ‘infrastructure’ to all these projects. The distinguishing feature of nearly all forms of genuine infrastructure is that they require the acquisition of large tracts of land on which to construct roads, railways, harbours, airports, and distribu-tion systems for water, gas, electricity and land-based telecommunicadistribu-tions services. It is the difficulty that would be faced by the private sector in such land acquisition that largely explains the historical tendency of governments to provide such infrastructure. There is no more reason to regard oil tankers and power generation stations as ‘infrastructure’ than trucks and sugar mills.
control of economic sectors critical to public wellbeing. This decision is discussed further in the Energy section below.
To emphasise the new government’s intention to open up the infrastructure sector to private investment, an infrastructure summit (Coordinating Ministry for Economic Affairs 2005b) was held in Jakarta on 17–18 January. It was organised by the Indonesian Chamber of Commerce and Industry (Kadin) and hosted jointly by the Coordinating Minister for Economic Affairs (the previous chair of Kadin) and the planning minister. Demand for places at the summit was oversub-scribed, indicating great interest on the part of domestic and international investors in infrastructure investment opportunities in SBY’s Indonesia. Investors seemed impressed by the ministers’ presentations, but expressed concern about continuing regulatory uncertainty. This concern was accentuated by the fact that, in preparation for the summit, the government had identified 14 new regulations that would be required in order to improve the investment climate in the infra-structure sector, yet by the time of the summit it could announce only one new one (Government Regulation 3/2005 on the terms for private participation in the electricity industry).
Investors also pointed to continuing problems such as counterproductive local government policies, corruption, and monopolistic practices on the part of state enterprises. The possibility of government guarantees to investors in infrastruc-ture was also raised. The finance minister, Jusuf Anwar, responded by saying that the government was willing to consider providing guarantees in accordance with the specific risks of the project in question, which would seem to conflict with much of the rationale for having private sector involvement (other than to pro-vide finance). Surprisingly, one private sector participant at the summit thought that the government should not give such guarantees, and that those involved should rely on available instruments—not to mention their own management skills—to deal with project risk; if this were not possible, the projects in question should be regarded as infeasible.
At the summit, the government offered 91 infrastructure projects to the private sector, involving a total investment estimated at $22.5 billion. The list of projects included toll roads (38); supply of drinking water (24); power generation (11); ports and airports (6); gas pipes (6); oil tankers and other downstream oil indus-try projects (5); and telecommunications (1).7
Tenders were to be opened for bid-ding in the first week of March 2005 but, as of the middle of February, only nine projects had been declared ready for tendering. The government is being exces-sively optimistic—indeed, it seems to have been carried away by this new enthu-siasm for private sector involvement in infrastructure—in planning for a second batch of over 40 even larger projects, with an estimated investment value of $57.5 billion in aggregate, to be offered in November 2005. Only the World Bank, the
8
For example, a recent draft regulation on upstream oil and gas activities stipulates that oil companies are to be subject to duties and other levies on imports, and also to regional taxes and levies. Although the draft states that the Ministry of Finance will reimburse any taxes (other than income tax) required to be paid by the contractor under a Cooperation Con-tract, the process of obtaining reimbursement from the ministry for tax and levy payments to regional governments will create higher transaction costs in the sector. The draft also introduces various fees that do not exist under current arrangements. For an extended dis-cussion of such issues, see McBeth (2005) and PwC (2004).
Asian Development Bank and Japan expressed an interest in investing consider-able sums in infrastructure at the summit, the two banks suggesting a combined total of $3–4 billion over an unspecified period, and Japan committing to $1 bil-lion of infrastructure investment in 2005.
Many of the projects have been offered prematurely. For example, several toll road projects are still in the pre-feasibility study stage; moreover, much of the land needed remains to be acquired, and this can take years in Indonesia. (A new law has been prepared that would give the government the right to seize land needed for infrastructure, but it is said that the draft has been awaiting the pres-ident’s approval for some time.) There is also the question of absorptive capacity already mentioned. Infrastructure investment of around $14–15 billion annually (based on the World Bank’s and the authors’ estimates of Indonesia’s require-ments) is no small amount, and Indonesia’s ability to absorb project assistance has been low and declining during the past few years.
Energy
Problems in the Energy Sector. A crisis is looming in the electricity industry. If sup-ply capacity continues to lag behind the growing demand, the power shortages now quite common in the Outer Islands are predicted to spread to more heavily industrialised Java by 2007, if not earlier. The investment requirements to meet this demand—given the current structure of electricity tariffs—are huge. The state electricity company, PLN (Perusahaan Listrik Negara), estimates that a total of $25.6 billion of investment will be necessary over the next five years (Business Indonesia, 30/12/2004). The sector has yet to recover fully from the difficulties caused by PLN’s deeply flawed power purchase agreements (PPAs) with a large number of independent power producers (IPPs), dating from the later years of the Soeharto era. The PPAs required PLN to purchase power from the IPPs (all associated with Soeharto family members and their cronies) at prices that by international standards were highly inflated. This, plus successive governments’ reluctance to increase prices to consumers—even though the rupiah equivalent of the prices it paid to the IPPs, specified in dollars, had increased dramatically dur-ing the 1997–98 crisis—ensured horrendous losses for PLN, severely limitdur-ing its ability to spend on maintenance and new transmission and distribution facilities. Attempts by subsequent governments to renegotiate the PPAs on more reason-able terms have considerably delayed further expansion of power generation capacity.
Problems of a different kind face the oil and gas industry. The climate for invest-ment and operations has worsened in the face of actual or proposed changes to various policies and regulations,8
and this has led to a continued gradual decline
in production of crude oil and condensate. Crude oil production averaged 1.41 mb/d (million barrels per day) in 2000, but fell to less than 1 mb/d at the begin-ning of 2004. Partly as a result of this, Indonesia has been a net oil importer since mid-2003 (Marks 2004: 165–6), and this has created a sense of insecurity, as Indone-sians have long believed that their country is awash with resources, including energy. The insecurity appears to have reinforced the widespread feeling that this ‘strategic’ sector should remain the exclusive preserve of the state.
Energy Pricing. In both the electricity and oil and gas sectors these problems are, to a considerable extent, the consequence of inappropriate pricing policies on the part of the government—policies intended to avoid popular disapprobation by holding back domestic price increases in the face of general price inflation and relative increases in world oil prices. In the electricity sector these policies encour-age wasteful consumption of electricity, while making it unprofitable to invest in power generation in the absence of large subsidies—the scope for which is severely constrained by the government’s precarious fiscal position. It is little wonder, then, that demand has been outstripping supply. In the oil sector (but much less so in gas), low prices again greatly reduce the incentive for both house-hold and industrial consumers to economise on the use of petroleum products, thus raising domestic consumption of fuels through increased imports and diver-sion of potential exports to the domestic market. In addition, these policies result in an enormous fiscal burden for the government, to which reference has already been made.
In recognition of these harsh economic realities the Megawati government introduced a policy of gradual upward adjustment of electricity tariffs, on a quar-terly basis, so that they would increasingly reflect the costs of power generation, transmission and distribution. Similarly, it introduced a formula for regular adjustment of domestic fuel prices in line with changes in world prices (except for kerosene prices to households, which were to be kept frozen). These policies were endorsed by the parliament, and regular price adjustments were made during 2002. But in January 2003 (with elections looming in 2004) the president discon-tinued the adjustment process for both electricity and fuel prices in response to public pressure. Since then, the prices of most domestic fuels and electricity tar-iffs have remained unchanged.
Immediately upon taking office, President Yudhoyono was confronted with the urgent need to reduce fuel subsidies, and the new cabinet decided within weeks to do so by raising domestic prices gradually from February 2005. But the president had second thoughts on this, as a result of which the new policy was to be introduced from the beginning of April 2005 (Kagda 2005) (although the prices of two products, unleaded gasoline (Pertamax) and bottled LPG, were raised at the end of 2004).
In the past, adjustment of fuel prices was driven largely by budgetary consid-erations: prices were determined by the government’s ability to provide budget subsidies. But straitened fiscal conditions are not the only reason for removing the subsidies. In particular, it is important to eliminate price distortions that cre-ate problems of supply in the longer term. The decisions of successive govern-ments to use the highly inefficient mechanism of distorting fuel prices to redistribute income in favour of the poor have frustrated the implementation of a rational national energy policy.
9
An alternative view is that administered price changes like these are merely relative price changes, and so are not inflationary at all, provided the money supply is not adjusted upwards in order to keep ‘core inflation’ steady (McLeod 2003: 314–18). This was the pol-icy of the central bank in the past, but more recently it has dropped the practice of focus-ing separately on ‘core’ and ‘headline’ inflation (Kenward 2004: 24).
This is the main argument put forward in a recent study of fuel subsidies (LSC 2004), in which various fuel price adjustment scenarios were considered. One involved keeping household kerosene prices at their current level (as required under Presidential Instruction 90/2002), while adjusting prices of other types of fuel to a ‘medium-term oil price’ of $32 per barrel, implying a weighted average price increase for all fuels of about 25%.The budgetary savings under this sce-nario were estimated at about Rp 25 trillion. The upward impact on the price level has been estimated by LPEM–FEUI (the Institute for Economic and Social Research in the University of Indonesia’s economics faculty) and the World Bank to be less than 2%.9
The LSC study argued that programs designed specifically to help the poor could be implemented at a cost far less than the budgetary savings available under this scenario, confirming the widely held view that general fuel price subsidies—which are enjoyed by rich and poor alike, and which subsidise the rich much more heavily than the poor—constitute a clearly inferior policy on both equity and efficiency grounds.
What is important, therefore, is for the government to develop an effective pub-lic information program to explain why the general pubpub-lic will be better off if domestic fuel prices are adjusted upwards. It may be more likely to meet with suc-cess in this regard if it can simultaneously introduce one or more programs directly targeted to benefit the poor, such as expansion and improvement of basic education and health services, and it now appears that the government is moving in this direction (Kagda 2005). This is another important area in which the leader-ship qualities of the new president will be able to be assessed in coming months.
Energy Laws. In addition to its efforts on energy pricing, the Megawati govern-ment also attempted to bring about improvegovern-ments in both the electricity and oil and gas sectors by the introduction of new laws—the Oil and Gas Law (No. 22/2001) and the previously mentioned Electricity Law (No. 20/2002). These laws attempted to provide a stronger legal basis for participation by pri-vate firms in both sectors. Each of these new laws has been challenged, however, since its enactment. With the establishment of the new Constitutional Court in 2003, various groups saw an opportunity to have the laws subjected to judicial review on the grounds that they violate article 33 of the constitution. This article requires that the state must control those sectors that affect the welfare of the pop-ulation at large, including public utilities and resources such as oil and gas. This requirement is extraordinarily vague, and is still widely interpreted in the spirit of its socialist origins in the 1940s.
The electricity law was brought to the Constitutional Court jointly by the labour union of PLN, a group of former PLN employees, and a number of NGOs, including an organisation called the Working Group on Power Sector Restructur-ing (WGPSR). These parties opposed the ‘unbundlRestructur-ing’ of PLN’s generation, transmission and distribution operations provided for in the 2002 law, which was intended to increase the efficiency of the electricity sector. The plaintiffs relied on