122
Factors Affecting Consumers’ Decision in Purchasing
MUI Halal-Certified Food Products
Qurroh Ayuniyyah
a,Didin Hafidhuddin
b,Hambari
ca)Ph.D. Candidate at Department of Economics, International Islamic University Malaysia, Email :[email protected] b)Professor, Bogor Agricultural University, Indonesia, Email : [email protected]
c)Ph.D. Candidate at Department of Fiqh and Usul Al-Fiqh, International Islamic University Malaysia, Email : [email protected]
Abstract
Objective - As the largest Muslim population in the world, Indonesia has a promising potential of halal food industry in terms of economic and market values. This research aims at analyzing factors affecting consumers’ decision in purchasing MUI halal-certified food products.
Method – This study employs survey method and descriptive analysis approach. Three hundred respondents are selected using non-probability convenience sampling technique and are analyzed using multiple regression. The criteria of the respondents are Muslim and have bought Indonesian halal-certified food products in the last one-month. While the dependent variable in this study is purchasing decision (Y), the four independent variables are cultural and religious factors (X1), social factor (X2), personal factor (X3) and psychological factor (X4).
Result - This study finds that the four independent factors significantly influence consumers’ decision in purchasing MUI halal-certified food products. However, social factor are negatively related with the consumers’ purchasing decision.
Conclusion - This study is expected to deliver the information on the halal food purchasing decisions from the perspective of the customers in order to provide recommendations to develop halal food industry in Indonesia.
Keywords: Halal Food Products, Purchasing Decision, and Consumers’ Behavior
Abstrak
Tujuan - Sebagai negara dengan populasi Muslim terbesar di dunia, Indonesia memiliki potensi industri makanan halal yang menjanjikan baik dari sisi ekonomi maupun nilai pasar. Penelitian ini bertujuan untuk menganalisis faktor-faktor yang memengaruhi keputusan pembelian konsumen terhadap produk makanan bersertifikat halal MUI.
Metode – Penelitian ini menggunakan metode survey dan pendekatan analisis deskriptif. Sebanyak tiga ratus responden dipilih dengan menggunakan teknik pengambilan non-probabilitas convenience. Kriteria responden yang dipilih adalah Muslim dan minimal pernah setidaknya sekali membeli produk makanan bersertifikat halal MUI dalam sebulan terakhir. Peubah dependent adalah keputusan pembelian konsumen (Y), sedangkan peubah independent adalah faktor agama dan budaya (X1), faktor social (X2), faktor personal (X3) dan faktor psikologis (X4).
Hasil - Penelitian ini menemukan bahwa keempat faktor peubah tersebut secara statistik signifikan di dalam memengaruhi keputusan pembelian konsumen terhadap faktor makanan bersertifikat halal MUI. Meskipun demikian faktor sosial memiliki hubungan negatif dengan keputusan pembelian tersebut. Kesimpulan - Penelitian ini diharapkan akan memberikan informasi mengenai keputusan pembelian produk makanan halal dari sisi kosumen sehingga dapat memberikan rekomendasi untuk mengembangkan industri makanan halal di Indonesia.
124
1. Introduction
As a comprehensive teaching, Islam is considered as life curriculum that becomes the main references and framework of life value system for mankind. In this context, Islam is not a mere moral and ethical base, but also an operational system that is applicable in human daily life. In other words, it encompasses all aspects of human life and is valid for all people in the world, anywhere and anytime (Hafidhuddin, 2008).
One of major concerns of Islamic teaching for its believers is to consume all products that are permissible (halal) and good (thayyib) according to the revelation specifically the Quran and the Prophet PBUH’s sayings. Khan (2003) explains halal is derived from the Arabic word - , which means permissible or lawful. The term of halal means “things and activities that are permitted by the .” This concept indicates that Muslims should base all their activities including consumption according to the Shariah.
As Islam obligates its believers to consume halal products, these products have become basic needs and even lifestyle particularly in Muslim major country including Indonesia. Pew Research Center (2010) reports that Indonesia constitutes the largest Muslim population in the world that shares 12.7 percent of the world’s Muslims followed by Pakistan (11 percent), India (10.9 percent) and Bangladesh (10 percent). This reflects Indonesia has a promising potential of halal industry, including halal food industry, in terms of economic and market value (Yasid et al, 2016).
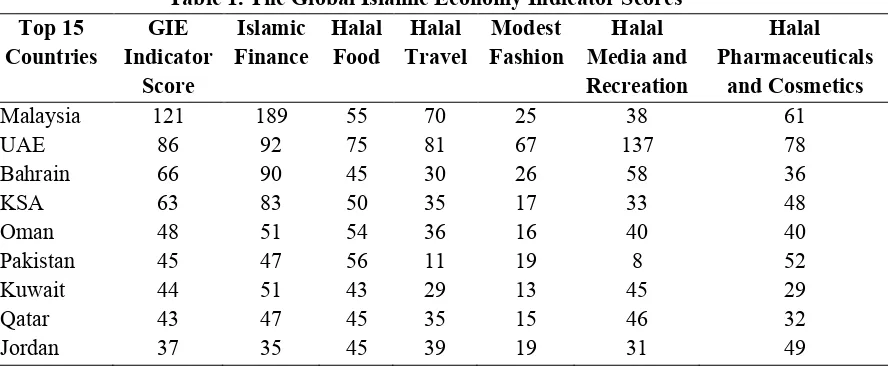
The Global Islamic Economy Report (2016/2017) reports that the global market size of food and lifestyle sector expenditure reached USD1.9 trillion in 2015 and is projected to increase by 8 percent in 2021. Besides, it also indicates that the global estimated revenues from halal certified foods and beverage products reached USD415 billion in 2015.
125
Indonesia 36 38 40 35 21 9 41
Singapore 32 22 39 44 26 75 56
Brunei 32 27 45 22 12 30 39
Sudan 28 30 33 23 5 17 23
Iran 28 30 29 36 10 20 27
Bangladesh 26 31 26 10 25 3 25
Source: Thomson Reuters (2017)
The report also shows Indonesia as the first top Muslim consumer food expenditure markets of USD154.9 billion in 2015 above Turkey, Pakistan, Egypt, Bangladesh, Iran, Saudi Arabia, Nigeria and Russia. Besides, Indonesia is among the top 15 countries that have highest scores of the Global Islamic Economy Indicator (GIEI) (vide Table 1).
According to Table 1, it is found that Indonesia occupies tenth place benefiting from better improvement in the halal travel indicator as compared to the previous period. In this case, Indonesia enhanced three places by virtue of a strong government drive to promote Indonesia as a halal travel destination. It is also found that halal pharmaceuticals and cosmetics shared the highest score of 41, while halal food shared the second highest score of 40. From this point of view, it can be concluded that the current performance of halal industry of food and beverage is relatively good among other indicators.
The halal certification and logo of products in Indonesia are managed by Lembaga Pengkajian
Pangan, Obat-obatan dan Kosmetika Majelis Ulama Indonesia or Indonesian Ulama Council (abbreviated as LPPOM MUI). The institution aims at investigating, researching, analyzing and
deciding whether or not food products, cosmetics and pharmaceuticals that circulate in the
market comply with the health and halal standard according to Islamic teaching. Besides,
LPPOM MUI also recognizes halal certificates issued by approved halal certification body only for product produced in the country where the halal certification body located, except for product produced in Europe can be used halal certificate by any approved halal certification body located in Europe (LPPOM MUI, 2017).
According to MUI (2009), the requirements of halal products are as follows. First, the products and its ingredients should be free from pork, pig and its derivatives. Second, they should also be free from wine and its derivatives. Third, halal meat refers to meat from animals, which are slaughtered based on Islamic procedure. Forth, the foods should be free from ingredients that are banned and free from carcasses, blood, substances derived from human organ, dirt, etc. Fifth, the storage, sale, processing, management and public means of transportation for the halal products must be free from pigs or other illicit goods.
126
cosmetics and medicines during 2011 to 2014 had been only 26.11 percent. In other words, the
majority of products in the market are still halal-uncertified (Direktorat Jendral Bimbingan
Masyarakat Islam, 2015). This condition should be improved in order to enhance the
performance of halal food industry at both national and global levels. The improvement can be
started from many aspects and should be done simultaneously, including from the perspective of
the government as regulator, the producers of halal food, the distributors as well as the
consumers.
This study, hence, attempts to analyze the MUI halal-certified food products from the point of
view of the consumers. Understanding the perception and behavior of the consumers is very important for betterment of the halal food industry in Indonesia. This paper comprises four sections including introduction as the first one. Section two elucidates research method followed by empirical findings and discussion in section three. Finally, chapter four concludes.
2. Research Method
Methodology is defined as a general approach to conduct this particular research topic. In this regard, it is a system of explicit rules and procedures upon which research is based and against which claims knowledge are comprehensively evaluated (Imaduddin, 2006). This chapter discusses the data and methodology employed in the research. It makes a brief elucidation about place and time of research, types and sources of data, population and sampling methods as well as the analytical tools. Given the availability of reliable data, the quantitative analysis is undertaken to verify our objective.
2.1. Types and Sources of Data
There are two sets of data used in this study. The first set of data is primary data while the second one is secondary data. Primary data is obtained through survey with the selected samples, while secondary data is obtained through literature survey and accessing the data of LPPOM MUI and other relevant sources.
2.2. Place and Time of Research
The research employs online survey so that the researchers can spread the questionnaires to the respondents across Indonesia and outside the country through social media. The survey was conducted during 1-3 May 2017.
2.3. Population and Sampling Method
127
Meanwhile sample is defined as the group of people selected to represent the population. This study selects 300 samples that are asked by using self-administered online questionnaires. This method helps researchers to collect data in an efficient timely manner and wider scope of demographic coverage.
Furthermore, this research employs non-probability convenience sampling method, where the samples are selected based on two basic criteria. These criteria are: (i) they are Muslim; and (ii) they buy MUI halal-certified food products for at least once in the last one-month.
2.4. Variables
Sumarwan (2011) highlights four elements in relation with consumers. First, consumers are users, buyers and decision makers. Second, they relate with goods, services, brands, packaging, quality and after sales service. Third, consumers have bargaining position and they look for information in order to compare brands. Forth, consumers also relate with perception, behavior, loyalty, satisfaction, motivation and lifestyle.
According to Solomon et al (2006), consumer behavior is “the study of the processes involved
when individuals or groups select, purchase, use or dispose of products, services, ideas or experiences to satisfy needs and desires”.Schiffman and Kanuk (2007) delineate that consumer behavior is “the behavior that consumers display in searching for, purchasing, using, evaluating, and disposing of products and services that they expect will satisfy their needs”
Similarly, Kuester (2012) defines consumer behavior as “the study of individuals, groups, or organizations and the processes they use to select, secure, use, and dispose of products, services,
experiences, or ideas to satisfy their needs and wants”. He also explains that consumer behavior
is concerned with the social and economic impacts that purchasing and consumption behavior has on both the consumer and wider society.
Kotler (2000) explains that there are four driving factors of consumer behavior including cultural factor, social factor, personal factor and psychological factor. The explanation of each factor is as follows.
2.4.1. Cultural Factor
128
factor is crucial as it can assist companies to deliver the best services and product in the market
size.
In relation with the social class, Kotler and Amstrong (2004) argue that the human societies naturally present social stratification and there even exists a caste system. Besides, they also represent the level of income, education and occupation.
2.4.2. Social Factor
Kotler (2000) explains that consumer behavior is also affected by the social factor such as reference group that consists people who can give direct and indirect effects. For instance, family, friendships groups, work and shopping groups can affect consumer behavior including buying or purchasing decision.
2.4.3. Personal Factor
Kotler (2000) argues that personal factors including consumer’s age and stage in the life cycle,
personal occupation, economic circumstances and lifestyle of person can affect consumer
behavior. These also are affected by personality and self-concept. Furthermore, Schiffman and
Kanuk (2007) opine that the personality, product quality, self-concept and self-power, the
product display methods are the main factors that influence on consumer behavior in the
services industry.
2.4.4. Psychological Factor
Psychological factors that affect consumer behavior are motivation, perception, learning
process, trust and attitudes. Swastha and Handoko (2000) are of the opinion that internal
psychological driving factors toward consumer behavior are motivation, observing process,
learning process, perception and behavior. Schiffman and Kanuk (2007) explain that motivation
is “the driving force with in individual that impels then to action”.
Besides the four factors as explained above, religious factor is also important in affecting Muslim consumers’ behavior. Johnstone as cited in Shafie and Othman (2006) defines religion is a system of beliefs and practices by which group of people interprets and responds to what they feel is supernatural and sacred. The permissibility of foods products hence is crucial for Muslim consumers. Sumarwan (2011) finds that Muslim consumers prefer to choose halal-certified products than unhalal-certified-halal product.
129
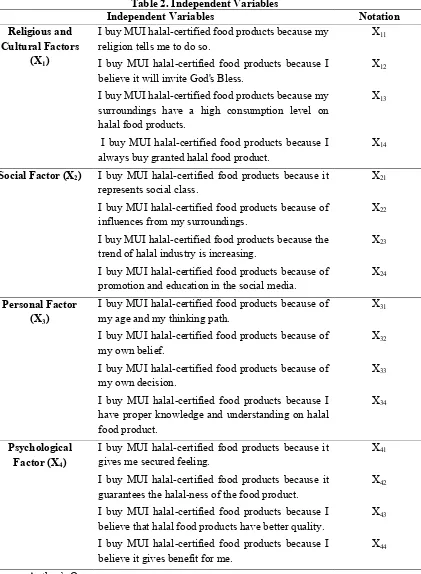
factors and psychological factors. The consumers’ decision on purchasing MUI halal-certified food products becomes the dependent variable. Table 2 and 3 below depict the independent and dependent variables used in this study.
Table 2. Independent Variables
Independent Variables Notation
Religious and Cultural Factors
(X1)
I buy MUI halal-certified food products because my religion tells me to do so.
X11
I buy MUI halal-certified food products because I believe it will invite God's Bless.
X12
I buy MUI halal-certified food products because my surroundings have a high consumption level on halal food products.
X13
I buy MUI halal-certified food products because I always buy granted halal food product.
X14
Social Factor (X2) I buy MUI halal-certified food products because it represents social class.
X21
I buy MUI halal-certified food products because of influences from my surroundings.
X22
I buy MUI halal-certified food products because the trend of halal industry is increasing.
X23
I buy MUI halal-certified food products because of promotion and education in the social media.
X24
Personal Factor (X3)
I buy MUI halal-certified food products because of my age and my thinking path.
X31
I buy MUI halal-certified food products because of my own belief.
X32
I buy MUI halal-certified food products because of my own decision.
X33
I buy MUI halal-certified food products because I have proper knowledge and understanding on halal food product. guarantees the halal-ness of the food product.
X42
I buy MUI halal-certified food products because I believe that halal food products have better quality.
X43
I buy MUI halal-certified food products because I believe it gives benefit for me.
X44
130
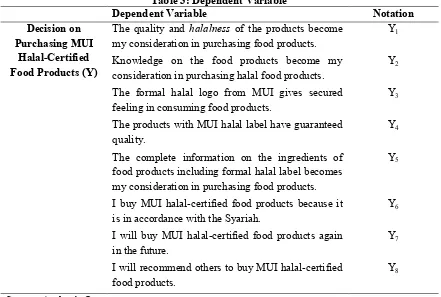
my consideration in purchasing food products.Y1
Knowledge on the food products become my consideration in purchasing halal food products.
Y2
The formal halal logo from MUI gives secured feeling in consuming food products.
Y3
The products with MUI halal label have guaranteed quality.
Y4
The complete information on the ingredients of food products including formal halal label becomes my consideration in purchasing food products.
Y5
I buy MUI halal-certified food products because it is in accordance with the Syariah.
Y6
I will buy MUI halal-certified food products again in the future.
Y7
I will recommend others to buy MUI halal-certified food products. characteristic of dependent and independent factors depicted in the aforementioned Table 2 and table 3.
Likert scale shows consumers’ response on available choices that are made in order started from lower to higher agreement. These scales consist of strongly disagree, disagree, neutral, agree and strongly agree. Ambali and Bakar (2014), Salman and Siddiqui (2011) and Yasid et al (2016) employ the same scales in order to obtain the respondents’ agreement on a certain characteristic of aforementioned dependent and independent variables. These five scales are depicted in the following Table 4.
131
After the respondents score all sub-factors under independent and dependent variables in Table 2 and 3 based on their intensity of agreement, the scores are summed in order to obtain the interval value for each variable. Thus, this process marks each variable to have one value. Mathematically, the latent variables are obtained through equations that are as follows.
∑ (1)
∑ (2)
Where n = 1 for religious and cultural factors, n=2 for social factor, n=3 for personal factor and n=4 for psychological factor.
In the applied econometric analysis, one of the assumptions of the classical linear regression model, including multiple regressions model, is that the model employed must be correctly specified or otherwise we face the problem of model specification error or model specification bias (Gujarati and Porter, 2009). Basically, a model represents the simplicity and abstraction from reality. Therefore, the economic model should be exact in order to represent the population. The explanatory or independent variables have to be correctly selected in order to obtain the correct model. This can be achieved through understanding the theoretical basis; hence the strong relationship can be found between the model and the underlying theory.
According to Hendry and Richard, as cited in Gujarati and Porter (2009), there are several criteria of a model chosen for empirical analysis:
1. Be data admissible; that is, predictions made from the model must be logically possible. 2. Be consistent with the theory; that is, it must make good economic sense.
3. Have weakly exogenous; that is, the explanatory variables must be uncorrelated with the error term.
4. Exhibit parameter consistency; that is, the values of parameters should be stable. Otherwise, forecasting will be difficult.
5. Exhibit data coherency; that is, the residuals estimated from the model must be purely random (technically, white noise).
6. Be encompassing; that is, the model should encompass or include the entire rival model in the sense that it is capable of explaining the results.
132
When insignificant variables are comprised in the model, the estimated value will be generally inefficient (Gujarati and Porter, 2009). Both incorrect models of specification might generate spurious results that, economically, would render the findings meaningless.
In this study, the model is designed to measure the relationship between several independent or predictor variables and a dependent or criterion variable. To do so, this study employs multiple regressions. It is basically an extension of simple linear regression. In this case, this study attempts to analyze the relationship between consumers’ decision in purchasing MUI halal -certified food products (Y) as the dependent variable with several predictors namely religious and cultural factors (X1), social factor (X2), personal factor (X3) and psychological factor (X4) as mentioned in Table 2 and Table 3. In general, the estimated equation is as follows.
(3)
Where (i= 0, 1, 2, 3 and 4) are the parameters to be estimated that are assumed to be positive; is disturbance term at a certain time period. Each parameter reflects that for is expected to be a positive value of consumers’ purchasing decision when other independent variables, namely religious and cultural factors (X1), social factor (X2), personal factor (X3) and psychological factor (X4) are zero. Moreover, implies an increase in consumers’ decision due to an increase in religious and cultural factors, holding other variables constant. Besides, given as a positive sign, indicating the percentage change in consumers’ decision per unit of a percentage change in social factor under assumption, the remaining variables are constant. Likewise, a positive sign of and also signifies the percentage change in the consumers’ decision due to the change in personal and psychological factors, ceteris paribus.
There are eight assumptions that must be fulfilled in multiple regressions that are as follows. First, the dependent variable must be measured on a continuous scale. In other words, it is either an interval or ratio variable. This study transforms the dependent variable from Likert scale into ratio variable by summing up all the values existing in the consumers’ purchasing decision as explained in equation (1).
Seconds, the model must have two or more independent variables, which can be either continuous or categorical (an ordinal or nominal) variable. In this study, the Likert scales obtained from respondents are summed and hence, the variables are transformed into ratio variables as mentioned in equation (2). Third, the model should have independence of observations or independence of residuals.
133
variables collectively. Fifth, the data needs to show homoscedasticity, which is where the variances along the line of best fit remain similar as we move along the line.
Sixth, the data must not show multicollinearity. Ghazali (2001) explains multicollinearity happens when two or more independent variables tare highly correlated with each other. This can be recognized from the tolerance value and Variance Inflation Factor (VIF). If the tolerance value and VIF approximately equal to 1, it can be concluded that the model is free from multicollinearity.
Seventh, there should be no significant outliers, high leverage points or highly influential points. Eighth, the residuals (errors) are approximately normally distributed.
In terms of hypothetical tests, multiple regressions model employs F test, t test and coefficient of determination to measure the goodness of fit of the model. Ghazali (2001) explains F test is used to see the simultaneous effect of independent variables to dependent variable. If the significance level is less than 0.05, then we can conclude that all independent variables simultaneously have statistical significance in affecting dependent variables, vice versa.
Meanwhile t test is use to see the partial effect of each variable towards dependent variable. Similarly, if the significance level is less than 0.05, then we can conclude that each independent variable partially have statistical significance in affecting dependent variables, vice versa. Ghazali (2001) also explains coefficient of determination or R Square is used to see the ability of the model to explain the variances of the dependent variable.
3. Results and Analysis
3.1. Descriptive Analysis
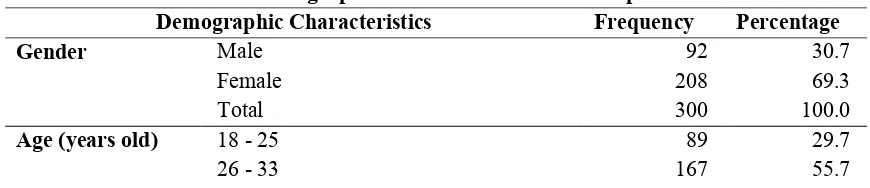
Table 5 below depicts demographic information of the respondents. According to the table, it is shown that most of the respondents are female (69.3 percent). With respect to their age, more than half of the respondents are between 26 to 33 years old. Meanwhile only 1.6 percent of the respondents are above 50 years old. This indicates that majority of the respondents are in the productive age.
Table 5. Demographic Characteristics of the Respondents
Demographic Characteristics Frequency Percentage
Gender Male 92 30.7
Female 208 69.3
Total 300 100.0
Age (years old) 18 - 25 89 29.7
134
Employee at private company 56 18.7
Employee at state owned enterprise 11 3.7
Civil servant 30 10.0
In terms of occupation, the top three jobs of the respondents are students, employee at private company and housewife with the percentage reaches 28.3 percent, 18.7 percent and 17.3 percent respectively. Regarding the marital status, almost 60 percent of the respondents are married while the remaining 40 percent are not married and divorced. Majority of them live in Java Island, followed by outside Java Island, DKI Jakarta and others.
It is interesting to note that the monthly incomes of the respondents are diverse. About 41
135
Based on the information depicted in the table above, hence, it can be concluded that most of the respondents are female and in productive age, having various occupations including students, employee at private company and housewife, live in Java Island and earn between USD0-USD400 and more than USD1000.
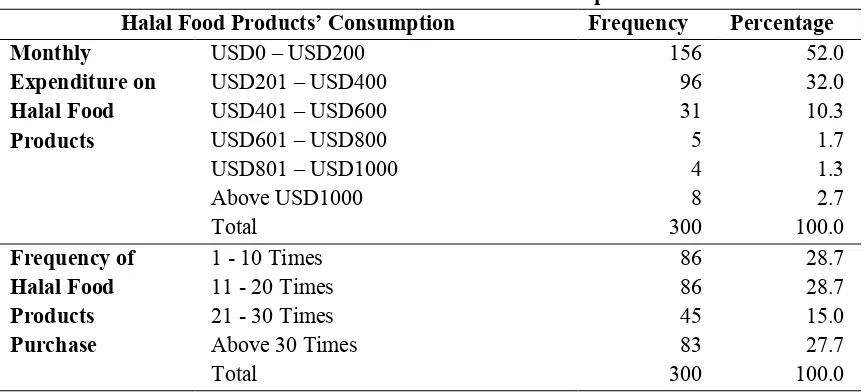
Table 6. Halal Food Products’ Consumption
Halal Food Products’ Consumption Frequency Percentage
Monthly
Table 6 above shows the consumption on halal food products of the respondents. Based on the table, 52 percent of the respondents spend up to USD200 per month on halal food products followed by 32 percent of the respondents who spend between USD201 to USD400 for halal food products consumptions. These figures relate to the monthly income of majority of the respondents that equal to between USD0 to USD400. In terms of the frequency of buying halal food products in the last one-month, majority of the respondents choose 1-10 times and 11-20 times.
136
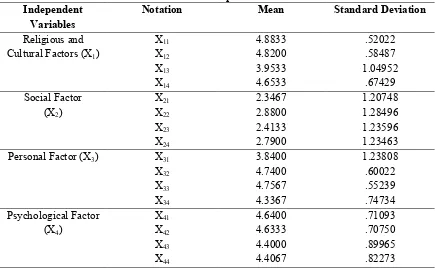
Table 7. Mean of Independent Variables Independent
Variables
Notation Mean Standard Deviation
Religious and statements related to their purchasing decision on MUI-halal certified food products.
Table 8. Mean of Dependent Variables
137
Table 9. Model Summary
R R Square Adjusted
R Square
Std. Error of the Estimate
Durbin-Watson (d)
.822 .676 .673 2.35324 2.062
Source: Authors’ own
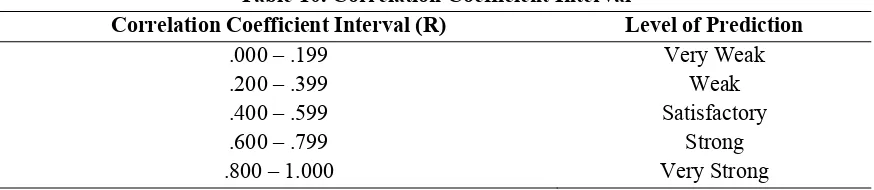
The multiple correlation coefficient (R) can be considered to be one measure of the quality of the prediction of the dependent variable namely consumers’ purchasing decision on MUI halal -certified food products. From Table 9, it can be found that the multiple correlation coefficient (R) equals to .822 indicating a very strong level of prediction, as this value is between .800 – 1.00 (vide Table 10).
Table 10. Correlation Coefficient Interval
Correlation Coefficient Interval (R) Level of Prediction
.000 – .199 Very Weak
.200 – .399 Weak
.400 – .599 Satisfactory
.600 – .799 Strong
.800 – 1.000 Very Strong
Source: Sugiyono (2006)
The coefficient of determination (R Square) is the proportion of variance in the dependent variable that can be explained by the independent variables. According to Table 9, the results of the regression indicate the five predictors explain 67.6 percent of the variance (R2=.676) while the remaining 32.4 percent is explained by the other variables outside the model. This is also confirmed by the Adjusted R Square that equals to .673.
138
Religious Social Factor ,528 1,894
Social Factor ,940 1,064
Personal Factor ,678 1,475
Psychological Factor ,520 1,922
Source: Authors’ own
The above Table 11 presents the results of multicollinearity tests. A tolerance of less than 10 percent and a VIF of 10 and above indicates a multicollinearity problem. According to the table column (1) and (2), it can be concluded that the model is free from the problem of multicollinearity.
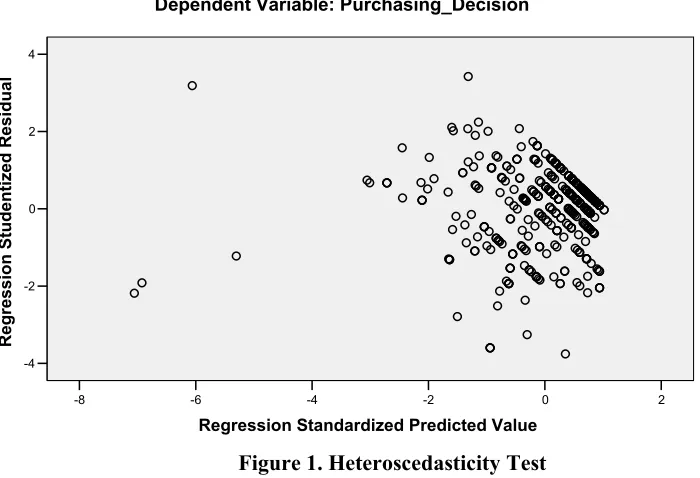
To test heteroscedasticity, the scatterplot of absolute value of residuals and regression standardized predicted value detect the presence of the problem of heteroscedasticity. If the plot of absolute value of residuals data shows a particular trend, it can be concluded that the model contains heteroscedastic data, vice versa. The following Figure 1 shows that the scatterplot does not show any trend indicating that the model is homoscedastic.
Figure 1. Heteroscedasticity Test
139
model is a good fit of the data. Furthermore, the F-test also shows that all the independent variables are simultaneously statistically significant in influencing dependent variables.
Table 12. ANOVA
Model Sum of
Square
Df Mean Square F Significance
Regression 4961.653 4 1240.413 223.992 .000
Residual 2381.235 430 5.538
Total 7342.887 434
Source: Authors’ own
From Table 9, Table 11, Table 12 and Figure 1, it can be concluded that the model generally does not violate the classical assumptions as mentioned in previous section. In other words, the Gauss-Markov theorem apply indicating that the estimators are the Best Linear Unbiased Estimators (BLUE) and their variance is the lowest of all other unbiased estimators.
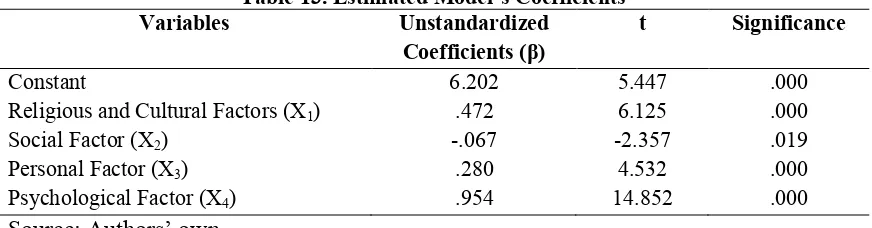
Table 13. Estimated Model’s Coefficients
Variables Unstandardized
Coefficients (β)
t Significance
Constant 6.202 5.447 .000
Religious and Cultural Factors (X1) .472 6.125 .000
Social Factor (X2) -.067 -2.357 .019
Personal Factor (X3) .280 4.532 .000
Psychological Factor (X4) .954 14.852 .000
Source: Authors’ own
Table 13 above shows the estimated model’s coefficients. It is interesting to note that religious and cultural factors are partially statistically significant in influencing consumers’ purchasing decision (β = .232, p<.05), as do the remaining three factors including social factor (β = -.067, p<.050), personal factor (β = .151, p<.05) and psychological factor (β = .565, p<.05).
140
The general form of the equation to predict consumers’ purchasing decision (Y) from religious and cultural (X1), social (X2), personal (X3) and psychological (X4) factors derived from the aforementioned Table 12 is as follows.
(4)
Equation (4) can explain several meaning that are as follows.
1. The value of 6.202 is a positive constant of consumers’ purchasing decision when other independent variables, namely religious and cultural factors (X1), social factor (X2), personal factor (X3) and psychological factor (X4) are zero.
2. The coefficient of religious and cultural factors (X1) equal to +.472, which means if religious
and cultural factors increase by 1 unit, the consumers’ decision will also increase by .472, holding other variables constant.
3. The coefficient of social factor (X2) equals to -.067 implying that an increase 1 unit in social
factor will decrease consumers’ purchasing decision by .067, holding other variables constant.
4. The coefficient of personal factor (X3) equals to +.280 implying that an increase 1 unit in personal factor will be followed by an increase in consumers’ purchasing decision by .280, holding other variables constant.
5. The coefficient of psychological factor (X4) equals to +.954 suggesting that if psychological
factor increases by 1 unit, consumers’ purchasing decision will also increase by .954, holding other variables constant.
From the above results, the study shows positive relationship between the religious and cultural factors, personal factor and psychological factor and the consumers’ decision in purchasing MUI halal-certified food products. According to t-value, it appears that psychological factor is a dominant factor on the consumers’ purchasing decision. This factor consists of such sub-indicators as perception, belief and motivation. The finding is in line with Nasythi (2016).
141
It is surprising to observe that the multiple regressions also find the negative relationship between social factor and consumers’ purchasing decision. Our finding might suggest that the respondents are likely to disagree that social class, trend of halal industry, influence from surrounding and promotion through social media influence their purchasing decision on MUI-certified halal food products.
4. Conclusion and Recommendations
This study attempts to analyze factors affecting consumers’ decision in purchasing MUI halal -certified food products by surveying three hundred respondents all over Indonesia. This study finds that all the independent variables including religious and cultural, social, personal and psychological factors are statistically significant in influencing consumers’ decision in purchasing MUI halal-certified food products. However, the social factor has negative relationship with the dependent variable, while the remaining three factors are positively related with the consumers’ purchasing decision.
There are two recommendations can be drawn from the findings of this study. Firstly, religious and cultural factors, personal factor and psychological factor are positively related with the consumers’ purchasing decision on halal-certified food products. It reflects consumers have good awareness on halal-certified food products. This suggests that the producers should provide more halal-certified food products, as the consumers are aware on this matter. Secondly, the government should support the development of halal food industry from many aspects including regulation support, administration support and financial support. This suggests economic policy actions should include the improvement of national halal industry as a fundamental strategy for development of the country.
However, this study has several limitations. Therefore, there are several suggestions for further research. Firstly, the present study employs quite small sample size. Therefore, further research should employ a larger sample size by surveying more respondents. Larger sample size will improve the robustness of the results.
Secondly, the current study applies the multiple regression method to measure the significance of the independent variables on the dependent variables. It might be useful if future research employs such different method as factor analysis.
142
References
Abdul Aziz, Y. & Vui Chok, N. (2013). The Role of Halal Awareness, Halal Certification, and Marketing Components in Determining Halal Purchase Intention Among Non-Muslim in Malaysia: A Structural Equation Modeling Approach. Journal of International Food & Agribusiness Marketing25(1), 1-23.
Abdul, M., Ismail, H., Hashim, H., & Johari, J. (2009). Consumer Decision Making Process in Shopping for Halal Food in Malaysia. China-USA Business Review8(9), 40-47.
Astuty, S. A. (2016). Analysis Factors that Affect Muslim Housewives in Choosing the Packaging of Food Products Labeled Halal MUI in the Bogor City. Undergraduate Thesis. Faculty of Economics and Management, Bogor Agricultural University.
Ghozali, I. (2001). Aplikasi Analisis Multivariate dengan program SPSS. Jakarta: Bina Akasara
Gujarati, D. N. & Porter, D. C. (2009). Basic Econometrics (5th edn.). Singapore: McGraw-Hill.
Hafidhuddin, D. (2008). Zakat dalam Perekonomian Modern (7th edn.). Jakarta: Gema Insani Pers.
Hamdan, H., Mat Issa, Z., Abu, N., & Jusoff, K. (2013). Purchasing Decisions among Muslim Consumers of Processed Halal Food Products. Journal of International Food & Agribusiness Marketing 19, 54-61.
Hussain, I., Rahman, S. Zaheer, A., & Saleem, S. (2016). Integrating Factors Influencing Consumers’ Halal Products Purchase: Application of Theory of Reasoned Action. Journal of International Food & Agribusiness Marketing 28, 35-38.
Imaduddin, M. (2006). Determinants of Banking Credit Default in Indonesia: A Comparative Analysis. MA Dissertation. Markfield Institute of Higher Education, United Kingdom.
Khan, M.A. (2003). Islamic Economics and Finance: A Glossary (2nd edn). London: Routledge.
Kotler, P. (2000). Marketing Management (10th edn). Upper Saddle River: Prentice Hall, Inc.
Kotler, P. & Amstrong, G. (2004). Principles of Marketing (10th edn). New Jersey: Prentice Hall, Inc.
Kuester, S. (2012). MKT 301: Strategic Marketing & Marketing in Specific Industry Contexts, University of Mannheim, 110.
LPPOM MUI. (2017). Retrieved from www.e-lppommui.org
143
Nasythi, L. N. (2016). Faktor-Faktor yang Memengaruhi Perilaku Konsumen dalam Keputusan Pembelian Produk Mie Instant Berlabel Halal. Undergraduate Thesis. Fakultas Ekonomi dan Bisnis Islam, Universitas Islam Negeri Sunan Kalijaga Yogyakarta.
Schiffman, L. G. & Kanuk, L. L. (2007). Consumer Behavior (9th edn). New Jersey: Prentice Hall.
Shafie, S. & Othman, M. N. (2006). Halal Certification: International Marketing Issues and Challenges. Paper presented at the IFSA VII World Congress Berlin, Germany.
Solomon, M. (2006). Consumer Behavior: A European Perspective (3rd edn). Harlow: Prentice Hall.
Sugiyono. (2006). Metode Penelitian Kuantitatif, Kualitatif, dan R&D. Bandung: Alfabeta.
Sumarwan, U. (2011). Perilaku Konsumen Teori dan Penerapan dalam Pemasaran. Jakarta: PT. Ghalia Indonesia.
Swastha, D. B. & Handoko, T. H. (2000). Manajemen Pemasaran Analisa Perilaku Konsumen (1st edn). Yogyakarta: BPFE-Yogyakarta.
Thomson Reuters. (2017). State of the Global Islamic Economy Report 2016/17. Retrieved from https://ceif.iba.edu.pk/pdf/ThomsonReuters-stateoftheGlobalIslamicEconomyReport201617.pdf
Wacharajirasophon, M. U. (2016). Factors Influencing Consumer Intention to Purchase Halal Food Among Muslims in Thailand. MSc Thesis. International Islamic University Malaysia.
Widodo, T. (2015). Pengaruh Labelisasi Halal dan Harga terhadap Keputusan Pembelian Konsumen pada Produk Indomie. Undergraduate Thesis. Fakultas Ekonomi dan Bisnis, Universitas Muhammadiyyah Surakarta.
Yasid, Farhan, F. & Andriansyah, Y. (2016). Factors Affecting Muslim Students Awareness of Halal Products in Yogyakarta, Indonesia. International Review of Management and Marketing 2016, 6(S4), 27-31.