Buffalo Cheese Whey Proteins, Identification
of a 24 kDa Protein and Characterization of
Their Hydrolysates:
In Vitro
Gastrointestinal
Digestion
Juliana C. Bassan1, Antonio J. Goulart1, Ana L. M. Nasser1, Thaís M. S. Bezerra2, Saulo
S. Garrido2, Cynthia B. Rustiguel3, Luis H. S. Guimarães3, Rubens Monti1*
1Faculdade de Ciências Farmacêuticas, UNESP Univ EstadualPaulista, Departamento de Alimentos e Nutrição, Araraquara - SP, Brazil.,2Instituto de Química, UNESP Univ EstadualPaulista, Departamento de Bioquímica e Química Tecnológica, Araraquara - SP, Brazil.,3Universidade de São Paulo, Departamento de Biologia, Ribeirão Preto - SP, Brazil
Abstract
Milk whey proteins are well known for their high biological value and versatile functional properties, characteristics that allow its wide use in the food and pharmaceutical industries. In this work, a 24 kDa protein from buffalo cheese whey was analyzed by mass spectrome-try and presented homology withBos taurusbeta-lactoglobulin. In addition, the proteins present in buffalo cheese whey were hydrolyzed with pepsin and with different combina-tions of trypsin, chymotrypsin and carboxypeptidase-A. When the TNBS method was used the obtained hydrolysates presented DH of 55 and 62% for H1 and H2, respectively. Other-wise for the OPA method the DH was 27 and 43% for H1 and H2, respectively. The total antioxidant activities of the H1 and H2 samples with and without previous enzymatic hydro-lysis, determined by DPPH using diphenyl-p-picrylhydrazyl radical, was 4.9 and 12 mM of Trolox equivalents (TE) for H2 and H2Dint, respectively. The increased concentrations for H1 and H2 samples were approximately 99% and 75%, respectively. Thein vitro gastroin-testinal digestion efficiency for the samples that were first hydrolyzed was higher compared with samples not submitted to previous hydrolysis. Afterin vitrogastrointestinal digestion, several amino acids were released in higher concentrations, and most of which were essen-tial amino acids. These results suggest that buffalo cheese whey is a better source of bio-available amino acids than bovine cheese whey.
Introduction
Cheese whey, which is a byproduct of cheese production, is a greenish-yellow solution com-posed of water, lactose, proteins and minerals [1–2] that represents 85–90% of the milk volume [3]. Dairy experts from around the world have sought to use whey because it contains highly nutritious components that should not be wasted and because it is a potent environmental OPEN ACCESS
Citation:Bassan JC, Goulart AJ, Nasser ALM, Bezerra TMS, Garrido SS, Rustiguel CB, et al. (2015) Buffalo Cheese Whey Proteins, Identification of a 24 kDa Protein and Characterization of Their
Copyright:© 2015 Bassan et al. This is an open access article distributed under the terms of the
Creative Commons Attribution License, which permits unrestricted use, distribution, and reproduction in any medium, provided the original author and source are credited.
Data Availability Statement:All relevant data are available from Figshare:http://dx.doi.org/10.6084/m9. figshare.1482092.
pollutant [4]. Milk whey proteins are well known for their high biological value and versatile functional properties, characteristics that allow its wide use in the food [5] and pharmaceutical [6] industries. These compact and globular proteins are responsible for 20% of the total protein contained in milk and, unlike casein, remain soluble at pH 4.6 [7]. The main proteins present in cheese whey areβ-lactoglobulin (3.2 g.L-1, 18.3 kDa),α-lactalbumin (1.2 g.L-1, 14.2 kDa),
serum albumin (0.4 g.L-1, 66.0 kDa), immunoglobulin (0.8 g.L-1, 146–1030 kDa), and lactofer-rin (0.2 g. L-1, 80 kDa), among others [2,8]. Current technologies allow the separation, isolation and purification of proteins from whey, usually through a combination of methods, such as fil-tration techniques associated with chromatography [5]. A wide variety of products, such as concentrates (35–80% protein), protein isolates (minimum protein content of 90%), protein fractions (α-lactalbumin,β-lactoglobulin and lactoferrin) and hydrolysates [4], which are
clas-sified as GRAS for use in food products [9,4], are available on the market. The physical, chemi-cal and functional properties of macromolecules such as proteins can be modified and
improved by enzymatic hydrolysis, particularly the absorption capacity, without affecting their nutritional value [10], while reducing allergenic processes [11]. Protein hydrolysates of cheese whey are a source of bioactive peptides [12] with opioid, antihypertensive, antithrombotic, antioxidant, immunomodulatory and antimicrobial activities [13–17] and of essential amino acids [18–19], which are often used as protein supplementation for infants and athletes and for parenteral administration [20]. There are few reports in the literature concerning bioactive peptides obtained by the hydrolysis of whey proteins, suggesting that further studies are required to fully understand this byproduct [21].
Genetic variants have being identified in buffaloes that are present in different fractions of milk proteins, affecting the composition and technological properties of these fractions [22]. In addition, studies performed in different parts of the world show that different buffalo breeds present both variants ofα-lactalbumin andβ-lactoglobulin [23–24]. Although bovine cheese
whey proteins have been extensively studied, studies regarding buffalo milk proteins are quite scarce [25].
In this article, we present a methodology to hydrolyze the proteins from Murrah buffalo cheese whey, and a study of the hydrolysis products. We also describe the amino acid sequenc-ing of a discovered variant protein ofβ-lactoglobulin.
Materials and Methods
In all cases, the experiments were performed in triplicate, and the experimental error was never greater than 5%.
Reagents
Pepsin, trypsin, chymotrypsin, carboxypeptidase-A, bile salts, pancreatin, (±)-6-hydroxy-2,5,7,8-tetramethylchromane-2-carboxylic acid (Trolox) and 2,2 diphenyl-1-picrylhydrazyl (DPPH) were purchased from Sigma-Aldrich Co. Renin fromAspergillus nigervar.awamori
(Chr. Hansen Ind. Com. Ltd) was acquired in the local market. Other reagents were of analyti-cal grade.
The productin of buffalo cheese whey
The buffalo cheese whey was prepared by adding 0.6% (v/v) renin fromA.nigerand 0.5% (v/v) 0.5 mol. L-1CaCl2to buffalo milk at 35°C for 1 h. After casein precipitation, the whey was fil-tered in gauze [26] and dialyzed in cellulose membrane (12 kDa, Sigma) under constant mag-netic stirring at 8°C. Periodic water exchange for lactose removal was also performed [27]. Fat funders had no role in study design, data collection
and analysis, decision to publish, or preparation of the manuscript.
was removed by adsorption in kaolin (20 g. L-1w/v), with subsequent centrifugation at 7400 x
gat 4°C for 30 min. The treated whey was stored at -18°C until further use.
Total protein, lactose and fat determination
The concentrations of protein, lactose and fat were determined following the methodologies of Bradford [28], Miller [29] and Gerber [30], respectively. Absorptivities were 0.0208 (μg prot.
mL-1)-1. cm-1and 247.23 mol. L-1. cm-1, using bovine serum albumin (BSA) and lactose as standards, respectively.
PAGE and SDS-PAGE analysis of buffalo chees whey proteins
Ten percent PAGE [31] and 12% SDS-PAGE [32] analyses were performed to obtain the whey proteins profiles and to monitor and analyze the hydrolysis of these proteins. Protein bands from PAGE and from SDS-PAGE were stained with silver [33] and with Brilliant Blue G-Col-loidal (Sigma), respectively. For the SDS-PAGE analysis, a GE Healthcare Life Sciences molar mass standard composed of phosphorylase b (97 kDa), bovine serum albumin (66 kDa), oval-bumin (45 kDa), carbonic anhydrase (30 kDa), trypsin inhibitor (20.1 kDa) andα-lactalbumin
(14.4 kDa) was used.
Molar mass determination of the variant protein from the buffalo cheese
whey
The molar mass of the new protein was determined from the SDS-PAGE (Fig 1A and 1B) using the Least Square Method, according to the formula:
Xn
Cited constants above are the function constantsg(x) =a1x+a2, there is, the function modeling the experiment.
Isolation and characterization of the 24 kDa protein from the buffalo
cheese whey
Proteins were 10-fold concentrated by lyophilization and submitted to 12% SDS-PAGE as pre-viously described. After the running, the gel was processed to visualize the proteins of interest and to serve as a guide for cutting slices containing the 24 kDa protein.
The gel slices were dried and submitted to digestion using 0.5μg of trypsin (Promega) in 0.1
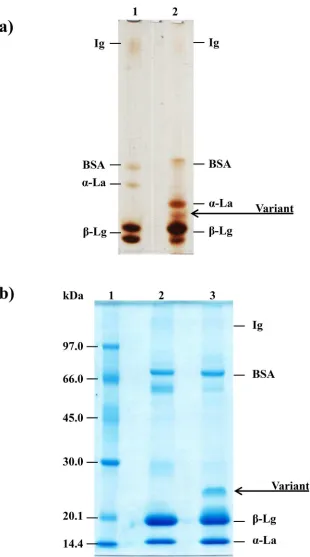
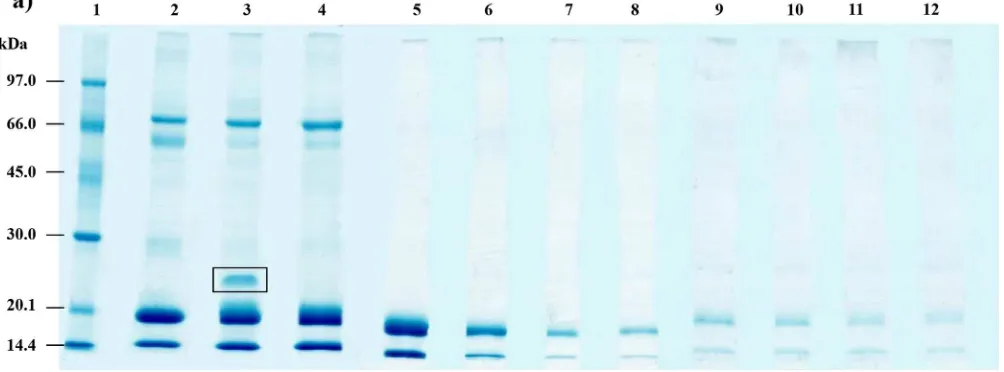
Fig 1. Electrophoretic profile of the buffalo cheese whey.a) Ten percent PAGE silver stained protein profile of treated bovine (1) and buffalo (2) whey. b) Twelve percent SDS-PAGE of the bovine and buffalo milk whey proteins. (1) Molar mass standards; (2) bovine milk whey; (3) buffalo milk whey. Ig: immunoglobulin; BSA: bovine serum albumin;α-La: alpha-lactalbumin;β-Lg: beta-lactoglobulin.
MS profiles were analyzed using the MASCOT software (Matrix Science, London, UK) and the Swiss Prot and NCBInr databases.
Enzymatic hydrolysis of cheese whey proteins
After removing the fat and lactose, the whey (10 mL) was hydrolyzed with pepsin (429 U, pH 3.0; 50°C), trypsin (432 U), chymotrypsin (18.3 U) and carboxypeptidase-A (16.7 U). Trypsin, chymotrypsin and carboxypeptidase-A were added to the whey at 50°C and pH 9.5 by two dif-ferent methods (M1 and M2). In the M1, the enzymes were simultaneously added, and the time of hydrolysis was 180 min, producing the H1 hydrolysate, whereas in the M2, these same enzymes were added to the whey with a 10 min interval between each addition, at the same pH and temperature, with a 24 hours reaction, producing the H2 hydrolysate. The end of the hydrolysis was determined by SDS-PAGE and by HPLC analysis, performed with samples col-lected at different reaction times and that were incubated in a boiling bath to denature the enzymes used.
Antioxidant activity of the buffalo cheese whey hydrolysates
Briefly, 1 mL mmol. L-1DPPH•solution in methanol 80% was mixed with 0.5 mL of samples
and standard. The mixture was kept at room temperature for 30 min; then the absorbance at 517 nm was measured in a BioTek Synergy H1 reader (BioTek Instruments, USA). Trolox (0– 150μmol. L-1) was used as standard. The results were expressed as a Trolox Equivalent (TE)
perμmol. L-1[34].
Quantification of the degree of hydrolysis (DH) using OPA and TNBS
The OPA assay was carried out with a modification of the Spellman et al. method [35], adding 0.02 mL of sample or standard to 2.4 mL of OPA/NAC reagent without SDS (the modification of the method). The OPA/NAC reagent was prepared mixing 10 mL OPA (50 mmol. L-1), 10 mL NAC (50 mmol. L-1) and 80 mL borate buffer (0.1 mol. L-1) pH 9.5. After 10 min the absor-bance of this solution was measured at 340 nm. A standard curve was prepared usingL -isoleu-cine (0–2 mg. mL-1). DH values were calculated using Eqs1and2.
DH%¼100n
N ð1Þ
n¼DABSMd
εP ð2Þ
Where N is the the total number of peptide bonds per protein molecule andnis the average number of peptide bonds hydrolyzed. TheΔABS is the difference in the absorbance of the
hydrolyzed and unhydrolized whey. The component d is the dilution factor,εis the molar extinction coefficient (mol. L-1. cm-1) and P the protein concentration of the sample (g. L-1). The average molecular mass of proteins in the whey (M) was 26.6 kDa and the peptide bonds per protein molecule (N) was 204.
used as standard and the hydrolysis was calculated using the following formula (Eq 3):
DHð%Þ ¼100ðAN2 AN1Þ
Npb ð3Þ
Where AN1is the amino nitrogen content of the protein substrate before hydrolysis (mg. g-1) and AN2is the amino nitrogen content of the protein substrate after hydrolysis (mg. g-1). The nitrogen content of the peptide bonds in the whey (Npb) was 123.3 mg. g-1[37]. The values of AN were obtained using the following formula (Eq 4):
AN¼ ABS1
ðεPÞ ð4Þ
Where ABS is the absorbance of the sample,εis the molar extinction coefficient forL -Leu-cine (mg. L-1) and P is the protein concentration of the sample (g. L-1).
Simulation of the
in vitro
gastric and intestinal enzymatic digestion
(determination of the dialyzability)
The simulation of gastric and intestinal enzymatic digestion was performed according to Luten et al. [38]. In this procedure, 95 mL of integral proteins (non-hydrolyzed whey-NH) and hydrolysates H1 and H2 were adjusted to pH 2.0 with 6 mol. L-1HCl, followed by the addition of 2 mL of Milli-Q water and 3 mL of pepsin (1.98x10⁵U in 0.1 mol. L-1HCl) at 37°C for 2 h, simulating gastric digestion. Then the mixture was placed at 4°C for 10 min to minimize pepsin activity. The peptic digest sample was separated into three aliquots (20 mL each); the aliquots were transferred to beakers containing cellulose membranes filled with 0.5 mol. L-1NaHCO3at 37°C for the dialysis of molecules with molar masses smaller than 12.4 kDa. When pH 7.0 was reached, 5 mL of 0.1 mol. L-1NaHCO3containing 20 mg of pancreatin + 125 mg of bile salts were added, and the mixture was kept in contact with the membrane for 2 h, simulating intesti-nal digestion. For determination of the amount of NaHCO3required to simulate intestinal pH two aliquots (20 mL each) of the peptic digest were separated to determine the titratable acidity using 0.5 mol. L-1NaOH until reaching pH 7.5 and 0.5 mol. L-1of gram-equivalent.
Peptides and amino acids from the hydrolysis products and enzymatic
digest analyses
H1 and H2 hydrolysates and the dialysates from the dialyzability experiments (solutions inside the membrane) were filtered using a GV Millex 0.45μm unit (Millipore) and analyzed by
HPLC (Varian ProStar or Shimadzu LC 10A), which was equipped with a reverse phase col-umn Nucleosil C18 (25 x 0.46 inch, 5μm particle size, 300 Å pore size). The eluents of the
mobile phase were as follows: A) water and 0.045% trifluoracetic acid (TFA) and B) acetonitrile (ACN) and 0.036% TFA, with a 5–95% linear gradient of eluent B, a flow rate of 1.0 mL. min-1 for 30 min and with UV detection at 220 nm.
and to provide the elution time of each amino acid and the conversion factor between the peak area and the concentration of each sample. The molar ratio of amino acids was established, assuming the concentration of the amino acid closest to the mean for all residues as one unit.
Results and Discussion
Protein, lactose and fat levels in buffalo cheese whey
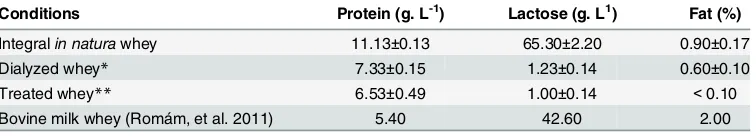
The protein concentrations were obtained after dialysis, which removed interfering compo-nents, such as oligopeptides and amino acid residues released during the enzymatic coagulation of milk. Lactose and fat concentrations decreased by 98.5% and by more than 90%, respectively, after dialysis and filtration with kaolin (Table 1). The removal of these compounds is important for determination of protein concentration with as little as possible interfering.
Results reported by Romám et al. [39] for bovine cheese whey showed lower protein and lac-tose concentrations compared with buffalo cheese whey, with the exception of the fat concen-tration. These different protein, lactose and fat levels are most likely related to the analytical methods used and to the fact that the samples are from different species of mammals and, therefore, have different environmental and genetic factors that are involved, as described in the literature [40–41]. The results show that buffalo whey can be considered an excellent source of high biological value protein that can be used in the food industry.
Comparison between cheese whey proteins from buffalo and bovine by
PAGE and by SDS-PAGE
Ten percent PAGE of bovine and buffalo cheese whey proteins shows a slight difference in the migration of the protein bands equivalent to bovine serum albumin (BSA) andα-lactalbumin
(α-La), as shown inFig 1A. The PAGE also shows an extra protein (variant) band in the buffalo cheese whey in the region between theα-La andβ-Lg fractions. There are few published data
concerning the protein profile of buffalo cheese whey; however, a recent study performed by Buffonni et al. [25] using RP-HPLC showed the presence of two protein peaks corresponding toα-La. In another study, Chianese et al. [23] used isoelectric focusing showed thatα-La has
two genetic variants (α-La A andα-La B).
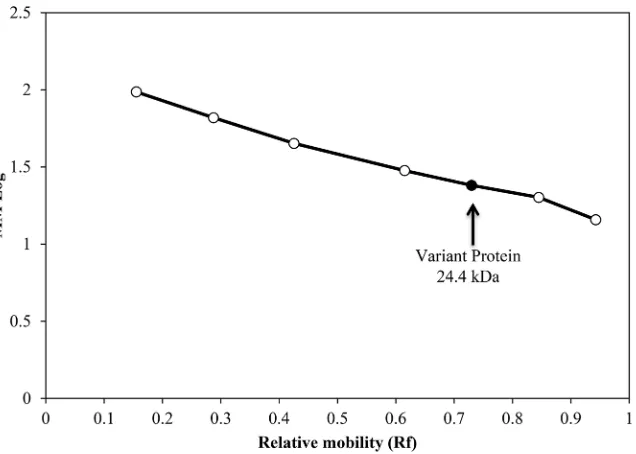
Twelve percent SDS-PAGE confirmed the presence of a protein band in buffalo whey with molecular weight ranging from 20.1 to 30.0 kDa and with relative electrophoretic mobility (Rf) of 0.73 (Fig 1B) that is absent in bovine whey. The determined molar mass of the variant pro-tein was confirmed to be 24kDa by the Least Square Method, determining the molar mass loga-rithm using the protein Rf (0.73) and, subsequently, the molar mass (Fig 2).
Regarding other proteins, cheese whey from buffalo milk is highly similar to bovine cheese whey, having proteins with molecular weights between 97 and 66 kDa (immunoglobulins and serum albumin, respectively) and between 20.1 and 14.4 kDa (β-lactoglobulin andα
-Table 1. Protein, lactose and fat concentrations of thein naturaand treated buffalo milk whey.
Conditions Protein (g. L-1) Lactose (g. L1) Fat (%)
Integralin naturawhey 11.13±0.13 65.30±2.20 0.90±0.17
Dialyzed whey* 7.33±0.15 1.23±0.14 0.60±0.10
Treated whey** 6.53±0.49 1.00±0.14 <0.10
Bovine milk whey (Romám, et al. 2011) 5.40 42.60 2.00
*reduction of lactose
**dialyzed, defatted and centrifuged
lactalbumin, respectively). A protein with molecular mass of approximately 30 kDa is also pres-ent in both species; however, this protein is most obvious in bovine whey.
Mass spectrometry analysis
Our results indicate the presence of a variant protein in the buffalo cheese whey, which can be different in the various breeds. According to the MS/MS profiles, five tryptic peptides were obtained from the 24 kDa protein. These peptides were aligned with theβ-Lg sequence from Bos tauruswith 37% of total coverage and high scores (Fig 3). On the other hand, another pep-tide (VGINYWLAHK) with 7% of coverage forα-La was also obtained with a reduced score.
The peptide data associated to the difference found in the molecular masses (SDS-PAGE and data bank) indicates the existence of a variantβ-Lg in the buffalo cheese whey. Similarly,
Chia-nese et al. [23] found two variants for 0078-La (α-La A andα-La B). These observations rein-force the necessity of new studies concerning this field to clarify the function and importance of these new proteins.
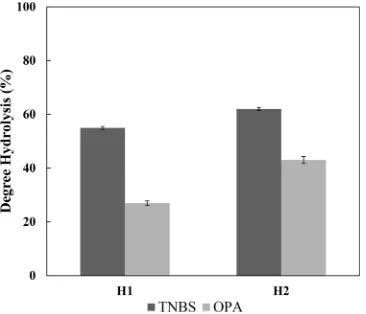
Determination of the DH for buffalo cheese whey hydrolysates
The TNBS reacts specifically with primary amino groups to form a trinitrophenyl (TNP) deriv-ative that can be quantified using a colorimetric method [42]. However, this method is
Fig 2. Determination of the variant protein molecular weight by Least Square Method.Calibration curve for the determination of the toxin molecular weight by SDS-PAGE (12%). Marker proteins used for calibration were phosphorylase b (97 kDa), bovine serum albumin (66 kDa), ovalbumin (45 kDa), carbonic anhydrase (30 kDa), trypsin inhibitor (20.1 kDa) andα-lactalbumin (14.4 kDa). (●) calibration curve; () variant protein.
doi:10.1371/journal.pone.0139550.g002
frequently used to quantify the extension of reactions between reducing sugars and free amino groups of proteins (Maillard reaction), where a condensation takes place involving mainly the lysineε-NH2and also the terminalα-NH2[43]. In this sense, the reaction between TNBS and
lysineε-NH2is a wide known process, responsible for a background that increases the values of the DH. A comparative study of the TNP-derivatives absorbance was carry out by Sashidhar and collaborators [44], where the derivative lysine had twice the absorbance of the TNP-glutamic acid, showing that TNBS reacts equally with bothα-amino andε-amino groups of
amino acids. This effect was observed in determination of the DH for the buffalo cheese whey hydrolysates (Fig 4), where the values obtained with TNBS assay were higher by a factor of 2 and 1.44, for H1 and H2 respectively.
Another method is based on the specific reaction between OPA and primary amino groups in the presence of a thiol, forming isoindoles 1-alkylthio-2-alkyl-substituted that can be quanti-fied at 340 nm [35]. The N-acetyl-L-cysteine can be used as thiol in this assay; however, a side reaction between NAC and cysteine residues can underestimate the DH in whey protein hydro-lysates because the cysteine residues compete with NAC for position 1 in the isoindole. Once this cysteine residue is linked its quantification is not possible, since the peptides and amino acids of the sample should interact with OPA using the primary amino groups instead of thiol groups [45]. The determination of the DH for buffalo cheese whey hydrolysates using OPA presented lower values comparing with TNBS, being 27 and 43% for H1 and H2, respectively. Fig 4. Determination of the hydrolysis degree for buffalo cheese whey hydrolysates.The values of DH were obtained by TNBS and OPA methods for hydrolysis using the M1 and M2 methods.
SDS-PAGE and HPLC of hydrolysis products
The profile of H1 at different reaction times is showed inFig 5A. The protein profiles of bovine and buffalo non-hydrolyzed cheese whey proteins (lanes 2–3), were used to compare the hydrolysis development by the enzymes pepsin, trypsin, chymotrypsin and carboxypeptidase-A. The disappearance of the variant protein band present in the buffalo cheese whey (lanes 4–5), and the albumin (buffalo whey), indicates its hydrolysis by pepsin during the first 20 min of the reaction at pH 3.0 and at 50°C. A gradual decrease in the color intensity of the protein bands clearly indicates the efficiency of the hydrolysis by M1 method (lanes 6 to 12). These results also show the resistance ofα-La andβ-Lg to hydrolysis after 180 min under the chosen
experimental conditions (pH 9.5 and 50°C). The SDS-PAGE of the sample with a high degree Fig 5. SDS-PAGE patterns for the H1 and H2 hydrolysates.In the both figures the Lane 1: molecular mass standards; Lane 2: treated bovine milk whey; Lane 3: treated buffalo milk whey. The lanes 4–12 are showing hydrolysates produced using the M1 method (Fig 5a) with incubation between 0–180 min,
whereas the lanes 4–16 are showing hydrolysates produced using the M2 method (Fig 5b) with incubation between 0–1440 min.
of hydrolysis (H2) at different reaction times is shown inFig 5B. Lanes 1 to 4 are the same as in
Fig 5A(same hydrolysis conditions). When using the M2 method, we also observed that the bulk of proteins in the buffalo cheese whey were hydrolyzed after 24 hours of reaction (lanes 9–16), whereasα-La andβ-Lg showed some resistance to the hydrolysis (lanes 5–8).
The non-hydrolyzed (NH) buffalo cheese whey proteins were analyzed by HPLC (Fig 6A), presenting few peaks (tR17.0–18.4 min) as expected, because the proteins present in the buffalo whey were intact in relation to their polypeptide chains. These peaks were reduced with the enzymatic hydrolysis, and the number of peaks considerably increased after 180 min of hydro-lysis for M1 method (Fig 6B), indicating the release of peptides (tR7.0–16.1 min); however, the hydrolysis using the M2 method (Fig 6C) was more efficient, because some peptides detected disappeared after 24 hours of reaction, increasing the release of amino acids. The HPLC results for the final hydrolysis products of M1 and M2 confirmed the SDS-PAGE results.
Antioxidant capacity
Nowadays, the antioxidant activity of natural products has been studied, among them com-pounds originating from fruits and vegetables. It has also been known that peptides released during the enzymatic hydrolysis of proteins are able to modulate certain specific biological functions such as anti-hypertensive activity, opioids, antimicrobial and antioxidant. Cheese whey proteins and their hydrolysates (peptides) are potential sources of compounds with anti-oxidant activity [46–48].
Enzymatic digestion of cheese whey proteins enables the disruption of tertiary structure of the proteins making the most exposed and accessible amino acid residues to react with free rad-icals [49]. It is known that cysteine (Cys) is an amino acid that has strong antioxidant activity, being able to donate hydrogen of its thiol group [50]. Furthermore, Cys is essential for the syn-thesis of glutathione, an important intracellular antioxidant [18]. However, other amino acid residues as Tyr, Trp, Met, Phe, His, Ile, Leu and Pro are also able to scavenge free radicals and act as antioxidants [47,51].
In this study hydrolysates prepared using M2 method showed antioxidant activity for the both H2 (first hydrolysis) and H2Dint (after gastric and intestinal digestion—dialyzability). These sam-ples showed 4.9 and 12 mmol. L-1Trolox equivalents, respectively, being able to sequester DPPH•.
When a higher degree of hydrolysis was achieved, as shown inTable 2, there was a release of amino acids such as Met, Leu, Phe, His, Pro, Tyr, that have the capacity to scavenge free radi-cals, as previously reported in other studies [47,51].
Another study [52] evaluated the antioxidant activity of free amino acids, showingin vitro
that Tyr and Met have high antioxidant character. Thus, a higher antioxidant activity found in the sample H2Dint is possibly due to the presence of higher concentrations of Tyr, Phe, Leu and Val. In addition, HPLC analysis of the sample H2 showed the presence of several peaks which correspond to peptide bonds, releasing peptides (Fig 6C), which may also be contribut-ing to the antioxidant activity obtained.
[53]. The antioxidant activity of whey proteins hydrolysates depends directly on the molar mass of the peptide, being the smallest ones (0.1–2.8 kDa) those with strong ability to scavenge free radicals.
Fig 6. The HPLC chromatographic of the buffalo cheese whey hydrolysates.a) non-hydrolyzed (NH), b) with a medium degree of hydrolysis (H1), and c) with a high degree of hydrolysis (H2). Reverse phase chromatography using column Kromasil C18 (250 x 4.6 mm)Φ= 5μm, 300Ǻporosity with a 5–95% linear gradient (solvent A: water with 0.045% TFA and solvent B: acetonitrile containing 0.036% TFA, 30 min), a flow rate of 1.0 mL min-1and with detection at 220 nm.
Table 2. Relative concentration (nmol. L-1) of the amino acids from buffalo milk whey before and after dialyzability.
Hydrolysis 11 Dialyzability
NH H1 H2
Amino acid NH H1 H2 GD DExt. DInt. ΣAA2 GD DExt. DInt. ΣAA2 GD DExt. DInt. ΣAA2
Thr3 0 0 0 50.561 0 389.537 389.537 386.135 1298.012 423.932 1721.944 426.081 1134.739 398.165 1532.904
Val3 0 0 0 32.910 1128.851 240.016 1368.867 228.764 685.277 216.818 902.095 248.826 534.503 191.458 725.961
Met3 0 94.972 107.605 151.603 431.575 110.527 542.102 240.577 187.565 68.692 256.257 273.693 151.407 75.154 226.561
Ile3 0 0 201.231 0 0 0 0 0 330.304 0 330.304 0 0 0 0
Leu3 0 792.580 783.473 221.215 0 1270.930 1270.930 1242.176 1486.901 1141.124 2628.025 1295.509 1822.587 1050.825 2873.412
Phe3 0 319.426 325.491 326.258 586.791 456.192 1042.983 538.699 659.497 462.148 1121.645 674.240 648.039 484.046 1132.085
His3 0 184.623 604.147 592.122 486.849 225.905 712.754 1081.911 302.686 60.797 363.483 1170.781 236.211 309.935 546.146
Lys3 0 392.204 368.867 103.645 1355.253 834.458 2189.711 237.900 1168.512 693.039 1861.551 301.897 1212.762 725.096 1937.858
Asp4 0 25.692 42.094 41.356 156.505 36.537 193.042 451.747 199.156 111.345 310.501 514.480 138.848 96.877 235.725
Ser4 0 0 0 24.198 0 0 0 222.233 0 0 0 212.067 0 0 0
Glu4 0 0 0 77.682 260.957 73.925 334.882 623.413 597.372 237.544 834.916 691.035 487.047 251.237 738.284
Pro4 0 1751.295 2306.616 0 21.802 0 21.802 55.303 49.514 0 49.514 152.670 31.927 0 31.927
Gly4 0 65.190 87.162 31.687 164.689 37.076 201.765 299.986 164.738 119.370 284.108 350.020 165.579 120.686 286.265
Ala4 0 0 0 40.558 1172.120 133.314 1305.434 474.570 626.602 229.531 856.133 531.357 579.769 243.989 823.758
Cys4 0 0 0 0 333.820 0 333.820 0 0 0 0 0 0 0 0
Tyr4 0 0 0 229.201 541.631 388.603 930.234 669.422 733.201 482.645 1215.846 624.271 738.280 485.299 1223.579
Arg4 0 10.634 6.793 15.681 421.154 251.463 672.617 41.826 514.483 301.067 815.550 54.350 504.479 302.606 807.085
Total 0 3636.616 4833.479 1938.677 7061.997 4448.483 11510.480 6794.662 9003.820 4548.052 13551.872 7521.277 8386.177 4735.373 13121.550
1 Hydrolysis with pepsin, trypsin, chymotrypsin and carboxypeptidase-A
2 Total of released amino acids by dialyzability (Dext + Dint) NH = non-hydrolyzed; H1 = low degree of hydrolysis; H2 = high degree of hydrolysis; GD = gastric digest; Dext = external intestinal digest, samples collected inside of the membrane; Dint = internal intestinal digest, samples collected outside of the membrane
3 Essential amino acids 4 Non-essential amino acids
doi:10.1371/journal.pone.0139550.t002
Buffalo
Cheese
Whey
Hydrolysa
tes
Production
ONE
|DOI:10.137
1/journal.p
one.0139550
October
14,
2015
Amino acids released before and after gastric and intestinal enzymatic
digestion
A greater variety of amino acids was obtained after gastric and intestinal enzymatic digestion when compared with NH, H1 and H2 samples (Table 2). M1 method released nine types of amino acids in the H1 sample, five of which are essential (methionine, leucine, phenylalanine, histidine and lysine), whereas ten types were detected in the H2 sample, six of which are essen-tial (methionine, leucine, isoleucine, phenylalanine, histidine and lysine), as shown inTable 2. These results confirmed that amino acids and many peptides were released after enzymatic hydrolysis for H1 and H2 samples in relation to NH (Fig 6B and 6C).
Samples NH, H1 and H2 subjected toin vitrogastric and intestinal enzymatic digestion showed a 593.7% increase in the concentration of amino acids released for the NH sample when compared with gastric digestion only (pepsin action), whereas the increases for H1 and H2 samples were approximately 99% and 75%, respectively.
Under the study conditions and after a 2h dialyzability period, we demonstrated that diffu-sion through the semipermeable membrane was 38.6% for the NHDint, 33.6% for the H1Dint and 36.1% for the H2Dint.
This work demonstrated that thein vitrodigestion of integral buffalo cheese whey proteins (NH) was effective in releasing at least 14 amino acids. Seven of the released amino acids are essential; the highest concentrations were of valine, leucine, phenylalanine and lysine, which were diffused through the membrane in the percentages 17.5%, 38.1%, 43.7% and 100%, respectively.
Tyrosine and arginine also showed significant diffusion rates (41.8% and 37.4%, respec-tively). The diffusion rates of the other amino acids were below 32%, showing that enzymatic digestion was effective in releasing essential amino acids and that buffalo cheese whey may become an important source of these compounds. Notably, the detection of amino acids by the method employed directly depends on their net charges, which change according to test condi-tions due to the different pH ranges employed.
Residues of isoleucine, tryptophan, asparagine and glutamine were not detected in any of the digestion steps.
concentrations and diffusion percentages, are involved in regulating processes such as gene expression.In vitrostudies indicate that dietary supplementation with glutamine and arginine increased the expression of genes with antioxidant properties, reducing the expression of pro-inflammatory genes. Another regulatory function attributed to amino acids is the synthesis and secretion of hormones, such as tyrosine and phenylalanine, which are precursors of the synthesis of epinephrine, norepinephrine, dopamine and thyroid hormones [56]. There is also a well-established immunological function related to the amino acids glutamine and arginine, methionine and cysteine, among others [56–57].
The hydrolysis of the proteins before gastrointestinal digestion favored the greater qualitative and quantitative release of amino acids. This finding was also observed in recent studies per-formed in our laboratory with bovine milk whey [26]. In relation to this same work, the amount of released amino acids from buffalo milk whey is much higher than the amount released from bovine milk whey. Our findings are interesting from a nutritional perspective because the use of whole proteins as a supplement produces the same effect as a pre-hydrolyzed supplement.
Conclusions
In this study the protein profile of the buffalo cheese whey was analyzed in comparison with the bovine milk whey. The profiles are highly similar, except for one protein that is not present in the bovine milk whey. This protein, with 24 kDa, was analyzed by mass spectrometry, and the obtained peptides showed greater homology forβ-lactoglobulin, being possibly a variant of this protein. Enzymatic hydrolysis, followed byin vitrogastrointestinal digestion, increased the release of amino acids, most of which essential amino acids, in higher concentrations when compared with bovine milk whey and able to scavenge free radicals. Buffalo cheese whey was found to be a successful alternative source of essential amino acids while presenting high bio-logical value proteins. Moreover, these amino acids are bioavailable to perform their respective physiological functions.
Acknowledgments
The authors thank Conselho Nacional de Desenvolvimento Científico e Tecnológico (CNPq) and Fundação de Amparo à Pesquisa do Estado de São Paulo (FAPESP) (J. C. Bassan), Coorde-nação de Aperfeiçoamento de Pessoal de Nível Superior (CAPES) (T. M. S. Bezerra) and Pro-grama Nacional de Pós-Doutorado (PNPD-CAPES) (A. J. Goulart) for financial and research support. Rubens Monti is a Research Fellow of CNPq. The authors also thank Programa de Apoio ao Desenvolvimento Científico da Faculdade de Ciências Farmacêuticas (PADC-FCF-UNESP), Búfalo Dourado (Fazenda Santa Elisa, Dourado, SP, Brazil) for the donation of the buffalo milk, and André Roberto Bassan for molecular mass calculus using Least Square Method.
Author Contributions
Conceived and designed the experiments: JCB AJG ALMN TMSB SSG CBR LHSG RM. Per-formed the experiments: JCB ALMN TMSB SSG CBR LHSG RM. Analyzed the data: JCB AJG ALMN TMSB SSG CBR LHSG RM. Contributed reagents/materials/analysis tools: RM CBR LHSG SSG. Wrote the paper: JCB AJG TMSB RM.
References
2. Foucquier J, Chantoiseau E, Le Feunteun S, Flick D, Gaucel S, Perrot N. Toward an integrated model-ing of the dairy product transformations, a review of the existmodel-ing mathematical models. Food Hydrocoll. 2012; 27: 1–13.
3. Sánchez J, Hernández E, Auleda JM, Raventós M. Freeze concentration of whey in a falling-film based pilot plant: process and characterization. J Food Eng. 2011; 103: 147–55.
4. El-Salam MHA, El-Shibiny S, Salem A. Factors affecting the functional properties of whey protein
prod-ucts: a review. Food Rev Int. 2009; 25: 251–70.
5. Jara F, Pilosof AMR. Partitioning ofα-lactalbumin andβ-lactoglobulin in whey protein concentrate/
hydroxypropylmethylcellulose aqueous two-phase systems. Food Hydrocoll. 2011; 25: 374–80.
6. Tavares GT, Malcata FX. Whey proteins as source of bioactive peptides against hypertension. In: Her-nández-Ledesma B, Chia-Chien H, editors. Bioactive food peptides in health and disease. Rijeka: InTech; 2013. p. 75–114.
7. Asghar A, Anjum FM, Allen JC. Utilization of dairy byproduct proteins, surfactants and enzymes in fro-zen dough. Crit Rev Food Sci Nutr. 2011; 51: 374–82. doi:10.1080/10408391003605482PMID: 21432700
8. Livney YD. Milk proteins as vehicles for bioactives. Curr Opin Colloid Interface Sci. 2010; 15: 73–83. 9. Sinha R, Radha C, Prakash J, Kaul P. Whey protein hydrolysate: functional properties, nutritional
qual-ity and utilization in beverage formulation. Food Chem. 2007; 101: 1484–91.
10. Conesa C, Fitzgerald RJ. Total solids content and degree of hydrolysis influence proteolytic inactivation kinetics following whey protein hydrolysate manufacture. J Agric Food Chem. 2013; 61: 10135–44. doi:10.1021/jf401837aPMID:24047254
11. Espinosa AD, Morawick RO. Effect of additives on subcritical water hydrolysis of whey protein isolate. J Agric Food Chem. 2012; 60: 5250–6. doi:10.1021/jf300581rPMID:22515418
12. Leksrisompong PP, Miracle RE, Drake M. Characterization of flavor of whey protein hydrolysates. J Agric Food Chem. 2010; 58: 6318–27. doi:10.1021/jf100009uPMID:20415487
13. Phelan M, Kerins D. The potential role of milk-derived peptides in cardiovascular disease. Food Funct. 2011; 2: 153–67. doi:10.1039/c1fo10017cPMID:21779574
14. Nagpal R, Behare P, Rana R, Kumar A, Kumar M, Arora S, et al. Bioactive peptides derived from milk proteins and their health beneficial potentials: an update. Food Funct. 2011; 2: 18–27. doi:10.1039/ c0fo00016gPMID:21773582
15. Tavares TG, Amorim M, Gomes D, Pintado ME, Pereira CD, Malcata FX. Manufacture of bioactive pep-tide-rich concentrates from whey: characterization of pilot process. J Food Eng. 2012; 110: 547–52.
16. Athira S, Mann B, Saini P, Sharma R, Kumar R, Singh AK. Production and characterisation of whey pro-tein hydrolysate having antioxidant activity from cheese whey. J Sci Food Agric. 2014; doi:10.1002/ jsfa.7032
17. Hafeez Z, Cakir-Kiefer C, Roux E, Perrin C, Miclo L, Dary-Mourot A. Strategies of producing bioactive peptides from milk proteins to functionalize fermented milk products. Food Res Int. 2014; 63: 71–80.
18. Ha E, Zemel MB. Functional properties of whey, whey components, and essential amino acids: mecha-nisms underlying health benefits for active people. J Nutr Biochem. 2003; 14: 251–8. PMID:12832028 19. Jakubowicz D, Froy O. Biochemical and metabolic mechanisms by which dietary whey protein may
combat obesity and Type 2 diabetes. J Nutr Biochem. 2013; 24: 1–5. doi:10.1016/j.jnutbio.2012.07. 008PMID:22995389
20. Rutherfurd SM. Methodology for determination degree of hydrolysis of protein in hydrolysates: a review. J AOAC Int. 2010; 93: 1515–22. PMID:21140664
21. El-Salam MHA, El-Shibiny S. A comprehensive review on the composition and properties of buffalo milk. Dairy Sci Technol. 2011; 91: 663–99.
22. Bonfatti V, Giantin M, Rostellato R, Dacasto M, Carnier P. Separation and quantification of water buffalo milk protein fractions and genetic variants by RP-HPLC. Food Chem. 2013; 136: 364–7. doi:10.1016/j. foodchem.2012.09.002PMID:23122071
23. Chianese L, Caira S, Lilla S, Pizzolongo F, Ferranti P, Pugliano G, et al. Primary structure of water buf-falo a-lactalbumin variants A and B. J Dairy Res. 2004; 71: 14–9. PMID:15068061
24. Vohra V, Bhattacharya TK, Dayal S, Kumar P, Sharma A. Genetic variants of beta-lactoglobulin gene and its association with milk composition traits in riverine buffalo. J Dairy Res. 2006; 73: 499–503.
PMID:16987433
26. Goulart AJ, Bassan JC, Barbosa OA, Marques DP, Silveira CB, Santos AF, et al. Transport of amino acids from milk whey by Caco-2 cell monolayer after hydrolytic action of gastrointestinal enzymes. Food Res Int. 2014; 63: 62–70.
27. McPhie P. Dialysis. Method Enzymol. 1971; 16: 23–32.
28. Bradford MM. A rapid and sensitive method for the quantitation of microgram quantities of protein utiliz-ing the principle of protein-dye bindutiliz-ing. Anal Biochem. 1976; 72: 248–54. PMID:942051
29. Miller GL. Use of dinitrosalicylic acid reagent for determination of reducing sugar. Anal Chem. 1959; 31: 426–8.
30. British Standards Institution. Determination of fat content of milk and milk products (Gerber Method). London: British Standards Institution; 1989. 12p.
31. Davis BJ. Disk electrophoresis: Method and application to human serum proteins. Ann NY Acad Sci.
1964; 121: 404–27. PMID:14240539
32. Laemmli UK. Cleavage of structural proteins during the assembly of head of bacteriophage T4. Nature. 1970; 227: 680–5. PMID:5432063
33. Blum H, Beier H, Gross HJ. Improved silver staining of plant proteins, RNA and DNA in polyacrylamide gels. Electrophoresis. 1987; 8: 93–9.
34. Wang X, Li X, Chen D. Evaluation of antioxidant activity of isoferulic acidin vitro. Nat Prod Commun. 2011: 6: 1285–8. PMID:21941899
35. Spellman D, McEvoy E, O’Cuinn G, FitzGerald RJ. Proteinase and exopeptidase hydrolysis of whey protein: Comparison of the TNBS, OPA and pH stat methods for quantification of degree of hydrolysis. Int Dairy J. 2003; 13: 447–53.
36. Spadaro ACC, Draghetta W, del Lama SN, Camargo A, Greene LJ. A convenient manual
trinitrobenze-nesulfonic acid method for monitoring amino acids and peptides in chromatographic column effluents. Anal Biochem. 1979; 96: 317–21. PMID:474960
37. Adler-Nissen J. Determination of the degree of hydrolysis of food protein hydrolysates by trinitrobenze-nesulfonic acid. J Agric Food Chem. 1979; 27: 1256–62. PMID:544653
38. Luten J, Crews H, Flynn A, Dael PV, Kastenmayer P, Hurrel R, et al. Interlaboratory trial on the determi-nation of thein vitroiron dialyzability from food. J Sci Food Agric. 1996; 72: 415–24.
39. Román A, Wang J, Csanádi J, Hodúr C, Vatai G. Experimental investigation of the sweet whey concen-tration by nanofilconcen-tration. Food Bioproc Tech. 2011; 4: 702–9.
40. Huppertz T, Kelly AL. Properties and constituents of cow’s milk. In: Tamime AY, editor. Milk processing and quality management. Oxford: Wiley-Blackwell; 2009. p. 23–47.
41. Mills S, Ross RP, Hill C, Fitzgerald GF, Stanton C. Milk intelligence: Mining milk for bioactive sub-stances associated with human health. Int Dairy J. 2011; 21: 377–401.
42. Cayot P, Tainturier G. The quantification of protein amino groups by the trinitrobenzenesulfonic acid method: a reexamination. Anal Biochem. 1997; 249(2): 184–200. PMID:9212870
43. Martins SI, Jongen WM, Van Boekel MA. A review of Maillard reaction in food and implications to kinetic modelling. Trends Food Sci Tech. 2000; 11(9): 364–73.
44. Sashidhar RB, Capoor AK, Ramana D. Quantitation of-amino group using amino acids as reference
standards by trinitrobenzene sulfonic acid: A simple spectrophotometric method for the estimation of hapten to carrier protein ratio. J Immunol Methods. 1994; 167(1): 121–7.
45. Ishida Y, Fujiwara M, Kinoshita T, Nimura N. Method of amino acid analysis. U.S. Patent n. 4,670,403, 2 jun. 1987.
46. Contreras MM, Hernández-Ledesma B, Amigo L, Martín-Álvarez PJ, Recio I. Production of antioxidant hydrolyzates from a whey protein concentrate with thermolysin: Optimization by response surface methodology. LWT-Food Sci Technol. 2011; 44: 9–15.
47. Power O, Jakeman P, FitzGerald RJ. Antioxidative peptides: enzymatic production, in vitro and in vivo antioxidant activity and potential applications of milk-derived antioxidative peptides. Amino Acids, 2013; 44: 797–820. doi:10.1007/s00726-012-1393-9PMID:22968663
48. O’Keeffe MB, FitzGerald RJ. Antioxidant effects of enzymatic hydrolysates of whey protein concentrate on cultured human endothelial cells. Int Dairy J. 2014; 36: 128–35.
49. Dryáková A, Pihlanto A, Marnila P,C^urda L, Korhonen HJT. Antioxidant properties of whey protein
hydrolysates as measured by three methods. Eur Food Res Technol. 2010; 230: 865–74.
52. Garrett AR, Weagel EG, Martinez AD, Heaton M, Robison RA, O’Neill KL. A novel method for predicting antioxidant activity based on amino acid structure. Food Chem. 2014; 158: 490–6. doi:10.1016/j. foodchem.2014.02.102PMID:24731374
53. Peng X, Xiong YL, Kong B. Antioxidant activity of peptide fractions from whey protein hydrolysates as measured by electron spin resonance. Food Chem. 2009; 113: 196–201.
54. Leenders K, Loon LJCV. Leucine as a pharmaconutrient to prevent and treat sarcopenia and type 2
dia-betes. Nutrition Rev. 2011; 69: 675–89.
55. Tessari P, Cecchet D, Cosma A, Puricelli L, Millioni R, Vedovato M, Tiengo A. Insulin resistance of amino acid and protein metabolism in type 2 diabetes. Clinical Nutr. 2011; 30: 267–72.
56. Wu G. Amino acids: metabolism, functions and nutrition. Amino Acids, 2009; 37: 1–17. doi:10.1007/ s00726-009-0269-0PMID:19301095