ENDANGERED SPECIES RESEARCH Endang Species Res
Vol. 21: 241–253, 2013
doi: 10.3354/esr00521 Published online October 9
© Inter-Research 2013 · www.int-res.com *Email: [email protected]
Defining olive ridley turtle Lepidochelys olivacea
management units in Australia and assessing the
potential impact of mortality in ghost nets
Michael P. Jensen
1,*, Colin J. Limpus
2, Scott D. Whiting
3, 4, Michael Guinea
5,
Robert I. T. Prince
4, Kiki E. M. Dethmers
6, Ida Bagus Windia Adnyana
7,
Rod Kennett
8, Nancy N. FitzSimmons
91Marine Mammal & Turtle Division, Southwest Fisheries Science Center, National Marine Fisheries Service, NOAA, 8901 La Jolla Shores Drive, La Jolla, California 92037, USA
2Queensland Department of Environment and Heritage Protection (DEHP), Threatened Species Unit, PO Box 2454 City, Brisbane, Queensland 4001, Australia
3Department of Natural Resources, Environment, the Arts and Sport, PO Box 496, Palmerston, Northern Territory 0832, Australia
4Marine Science Program, Department of Parks and Wildlife (DPaW), Locked Bag 104, Bentley Delivery Centre, Western Australia 6983, Australia
5School of Environmental and Life Science, Faculty of Engineering, Health, Science and the Environment, Charles Darwin University, Darwin, Northern Territory 0909, Australia
6North Australia Marine Research Alliance, Arafura Timor Research Facility, Brinkin, Northern Territory 0810, Australia 7Udayana University, FKH − UNUD, Kampus Bukit Jimbaran 8000, Bali, Indonesia
8North Australian Indigenous Land and Sea Management Alliance, Charles Darwin University, Northern Territory 0815, Australia
9Environmental Futures Centre, Griffith University, Queensland 4222, Australia
ABSTRACT: In Australia, the olive ridley sea turtle Lepidochelys olivaceahas received little re -search attention and monitoring. The Australian populations are relatively small and their distri-bution is limited to remote areas in the northern part of the country. Previous global genetic stud-ies of olive ridley populations showed that the Australian breeding population at the McCluer Group of islands, Northern Territory, is genetically distinct from other olive ridley populations breeding in the Indo-Pacific. However, nothing is known about the genetic stock structure among Australian olive ridley rookeries found across northern Australia. High predation of eggs by feral pigs, dogs and monitor lizards Varanusspp. is believed to have severely impacted the number of nesting females at some rookeries. Of particular concern is the small nesting population on the western Cape York Peninsula, and without immediate conservation action this population could face extinction. The results presented here establish that there are at least 2 independent manage-ment units (stocks) of olive ridley turtles nesting in Australia and emphasise the importance of conserving the genetically distinct small breeding population nesting along the western Cape York Peninsula. In addition, results from 44 turtles caught in ghost nets across the Gulf of Carpen-taria revealed that 45% of the haplotypes (32% of all ghost net samples) had not been observed at any rookery in Australia or SE Asia. This research highlights the need for better information on olive ridley population structure in the region and for urgent conservation action for the western Cape York population.
INTRODUCTION
Although the olive ridley sea turtle Lepidochelys olivaceais one of the most abundant species of sea turtles in the world, it is under threat in many re -gions, with smaller populations in the western Pacific showing some of the strongest declining trends (Abreu-Grobois & Plotkin 2008). This species has a circumtropical global distribution and is best known for its mass nesting events, called arribadas, which occur at only a few locations in India, Mexico and Costa Rica (Pritchard & Plotkin 1995, Hamann et al. 2003, Plotkin 2007, Pritchard 2007a). Less is known about the populations at the numerous locations where this turtle nests in low density, often at remote beaches around the world (Pritchard & Plotkin 1995, Bernardo & Plotkin 2007, Plotkin 2007). This is partic-ularly true for the western Pacific and SE Asia where information about their distribution and abundance is limited (Bernardo & Plotkin 2007, Plotkin 2007, Pritchard 2007b). In this region, olive ridley turtles are known to nest in Myanmar and Brunei (each with ~300 nests per year; Thorbjarnarson et al. 2000), Indonesia (~800 to 1000 nests per year; Limpus 1997, I. B. W. Adnyana & C. Hitipeuw pers. comm.), Papua New Guinea (Ulaiwi 1997), Malaysia and Thailand (each with < 50 nests per year; Chan 2001), Vietnam (tens of nests per year; Hamann et al. 2006) and Aus-tralia (few thousand females per year; Whiting et al. 2007b, Limpus 2008).
Olive ridleys used to be abundant in Myanmar, Thailand and Peninsular Malaysia, but several de -cades of intense egg harvest have driven this species to low numbers in most parts of the region (Limpus 1997). Olive ridley turtles generally migrate long dis-tances and forage both in shallow coastal waters and in the open sea (Polovina et al. 2004, Morreale et al. 2007, da Silva et al. 2011). For example, olive ridley turtles are frequently caught accidently in Hawaiian longline fisheries operating in the central Pacific, thousands of kilometres from major nesting areas (Moore et al. 2009). In contrast, Australian olive rid-ley turtles forage over the Australian continental shelf and appear to have narrower dispersal ranges, based on bycatch data from a coastal fishery (Guinea & Chatto 1992) and from satellite tagging of post-nesting females (McMahon et al. 2007, Whiting et al. 2007a). Our knowledge of olive ridley populations and how they use the marine environment has in -creased recently due to additional field studies of smaller populations (da Silva et al. 2007, Whiting et al. 2007b), the application of satellite tagging (Mc -Mahon et al. 2007, Whiting et al. 2007a, da Silva et al.
2011, Maxwell et al. 2011) and genetic studies (Bowen et al. 1997, Shanker et al. 2004, López-Castro & Rocha-Olivares 2005, Jensen et al. 2006).
For marine turtles and many other species, molecu-lar markers have provided a rapid assessment of many aspects of population biology. They have been used extensively in marine turtle research to investi-gate population structure (Bowen et al. 1992, Encal-ada et al. 1996, Dethmers et al. 2006), the origin of turtles in mixed foraging areas (Bowen et al. 1996, Velez-Zuazo et al. 2008, Dethmers et al. 2010), global phylogeography (Bowen et al. 1992, 1997, Dutton et al. 1999), and mating systems (FitzSimmons 1998, Ireland et al. 2003, Jensen et al. 2006). In particular, the control region of the mitochondrial DNA (mtDNA) has proven useful for identifying genetic stock structure and in mixed stock analysis of forag-ing animals (Bowen 1995, Lee 2008). Two important applications of molecular markers that are directly relevant to the conservation and management of sea turtle species are (1) the identification of genetic stocks or management units (MUs) (Moritz 1994) and (2) the ability to determine the origin of turtles at feeding grounds, in fisheries bycatch or in harvests. (Jensen et al. 2013).
Previous genetic studies of olive ridley rookeries investigated the broader global phylogeography and historical colonisation patterns leading to the current distribution of the species and only looked at fine scale (≤2000 km) population structure in India and Mexico (Bowen et al. 1997, Shanker et al. 2004, López-Castro & Rocha-Olivares 2005). These studies indicate that the Indo-Pacific rookeries in India, Sri Lanka, Malaysia, Australia, Mexico and Costa Rica are distinct from each other and from Atlantic popu-lations (Bowen et al. 1997, Shanker et al. 2004). In the eastern Pacific, olive ridley turtles appear to form 1 large panmictic population with no genetic differ-ences observed among turtles nesting in Costa Rica and several rookeries in Mexico along a coastline stretching approximately 3000 km (Bowen et al. 1997). However, there is some evidence of differenti-ation of the most northern rookeries in Baja Califor-nia, Mexico (López-Castro & Rocha-Olivares 2005). While studies of population structure within regions have rapidly advanced for other species of marine turtles in recent years, including green turtles Chelo-nia mydas (Chassin-Noria et al. 2004, Bass et al. 2006, Dethmers et al. 2006), hawksbill turtles Eret -mochelys imbricata(Bass 1999, Browne et al. 2010, LeRoux et al. 2012), flatback turtles Natator depres-sus(Pittard 2010), loggerhead turtles Caretta caretta (Shamblin et al. 2011) and leatherback turtles
Der-Au
th
o
r
co
p
mochelys coriacea(Dutton et al. 2013), the finer-scale population structure of olive ridley turtles has re -ceived little attention. This lack of information is hin-dering not only sound management decisions for the species, but also the ability to conduct mixed-stock analyses of turtles in foraging areas or those caught as bycatch in fisheries.
In Australia, olive ridley nesting is scattered across many rookeries throughout the Northern Territory (Chatto & Baker 2008), with an estimated few thou-sand females nesting annually (Pritchard & Plotkin 1995, Whiting et al. 2007b). In 1999, the Australian Government upgraded the threatened status of olive ridley turtles from Vulnerable to Endangered, indica-ting recognition of the risk of extinction within Aus-tralian waters. While the number of nesting females in Australia is relatively small compared to popula-tions in other regions (e.g. India, Mexico and Costa Rica) (Hamann et al. 2003, Plotkin 2007), it appears to be the largest in SE Asia and the eastern Indian Ocean. Low density nesting is found along 350 km of the western coast of Cape York Peninsula, Queens-land, between Rutland Plains (15° 43’ S) and Cape York (10° 42’ S), with an estimated tens of turtles per season at any one beach (Limpus 2008). There are only 3 records of olive ridley clutches laid in Western Australia (Prince et al. 2010). Throughout their distri-bution in Australia, olive ridley eggs are subject to high levels of predation by feral pigs, dogs, monitor lizards Varanus spp. and Indigenous harvest at sev-eral locations (Whiting et al. 2007b, Chatto & Baker 2008, Limpus 2008), and all other life stages face additional threats once turtles enter the marine habi-tat. This is of particular concern for the western Cape York rookery, as there are low numbers of nesting turtles and a history of high levels of egg and hatch-ling predation (C. J. Limpus unpubl. data).
One of the significant threats to foraging or migrat-ing olive ridley turtles in northern Australia is the oc-currence of large quantities of lost and discarded fish-ing gear, known as ‘ghost nets’ (Kiesslfish-ing 2003, Gunn et al. 2010, Wilcox et al. 2013). These nets are lost or discarded by open-ocean fisheries or from coastal waters near towns in the Arafura and Timor Seas and SE Asia and, as they drift, they entangle and kill sev-eral marine species including olive ridley turtles (White 2006, Drysdale et al. 2009, Gunn et al. 2010). Some of these nets can be several kilometres long and form a ball floating at the surface that provides a structure for attachment by a variety of marine organ-isms and thus attracts many grazers and browsers in-cluding juvenile and adult turtles. While unquanti-fied, the number of turtles killed in ghost nets within
the Gulf of Carpentaria (GoC) appears to be hundreds and possibly thousands annually (Limpus 2008). Given the estimate of only a few thousand nesting olive ridley females annually, the Australian rookeries are unlikely to withstand an annual mortality of many hundreds of turtles over the long term (Limpus 2008). In this study we used mtDNA control region se -quences to examine the genetic relationships among 3 olive ridley rookeries in Australia and compared those rookeries to global populations. Secondly, we examined the composition of mtDNA haplotypes from turtles caught in ghost nets to investigate their population origin and to help set conservation priori-ties for this species.
MATERIALS AND METHODS
Sample collection
Tissue samples were collected from 102 nesting olive ridley females at 3 Australian rookeries: the Tiwi Islands (n = 64) and the McCluer Group islands (n = 11) in the Northern Territory and Flinders Beach (n = 27) on the western Cape York Peninsula (CYP) in Queensland (Fig. 1). Samples were taken from turtles nesting at 4 islands in the McCluer Group, from Cape Van Diemen, Melville Island, in the Tiwi Island Group and along the 24 km Flinders Beach, at Ma -poon on the CYP (see Table 1). Samples were pre-served in absolute alcohol or in 20% dimethyl sulfox-ide (DMSO) in a saturated NaCl solution. In addition, to investigate the origins of olive ridley turtles caught in ghost nets, available samples from turtles recov-ered from ghost nets were collected along the west-ern edge of the GoC by the Dhimurru rangers (n = 21) and by the Mapoon Indigenous Land Council along the eastern GoC (n = 23) (see Table 1). The size of measured turtles from the ghost nets ranged from 30 to 78 cm (curved carapace length) and the turtles were classified as either alive, dead or decomposed. Unpublished sequences from rookeries in Indonesia were kindly made available for comparison with unknown ghost net haplotypes and for use in the phylogenetic analysis (I. B. W. Adnyana unpubl. data).
Characterisation of mtDNA haplotypes
DNA was extracted from tissue samples using a salting-out procedure. First, tissue was digested by Proteinase K (0.55 mg ml−1) at 55°C overnight in
Au
th
o
r
co
p
lysis buffer (300 µl; 40 mM Tris/HCl, 20 mM EDTA, 100 mM NaCl, pH 7.2) and 15 µl of 10% sodium do -decyl sulphate (SDS). This was followed by precipita-tion of the fracprecipita-tionate with ammonium acetate (150 µl; 7.5 M) and ethanol precipitation (100%, 2× volume) of the DNA from the supernatant. DNA pellets were dried and resuspended in 50 µl ddH2O. Extractions
were checked for DNA quality and quantity by run-ning 4 µl through a 1.2% agarose gel and visualising with SYBR® Safe (Invitrogen) stain under UV light. Samples were amplified via polymerase chain reac-tions (PCR) using the primers LTEi9 (5’-AGC GAA TAA TCA AAA GAG AAG G-3’) and H950 (5’-GTC TCG GAT TTA GGG GTT TA-3’) (Abreu-Grobois et al. 2006). These primers amplify an ~880 bp frag-ment of the mtDNA control region. For the genetic ana lysis, sequences were truncated to ~780 bp to en -sure good quality sequence. This region overlaps the 470 bp segment used by Bowen et al. (1997) in a pre-vious study that included 7 of the same samples from the McCluer Group. PCRs were set up in 25 µl reac-tions containing 1× reaction buffer, 0.25 mM of each deoxynucleoside triphosphate, 1.5 mM MgCl2, 10 µM
of each primer, 1.25 U of Taqpolymerase and ~40 ng of template DNA. The PCRs were carried out on an Eppendorf Mastercycler® ep thermocycler using an initial denaturing step at 94°C for 5 min, followed by 35 cycles of 45 s at 94°C (denaturing), 45 s at 52°C (annealing) and 45 s at 72°C (extension), and a final extension step of 5 min at 72°C. PCR products were
analysed for quality and quantity on agarose gels (as above), and all successfully amplified samples were purified prior to sequencing using a polyethylene glycol (PEG) procedure described by T. Glenn (www. mcdb. lsa. umich. edu/ labs/ olsen/ files/ PCR. pdf).
Sequencing of the forward and re -verse reactions was carried out by Macrogen (Korea). Sequences were aligned using Clustal W (Thompson et al. 1994) as implemented within the software Geneious (V5.6.5) (Drum-mond et al. 2011). Haplotypes were matched against published haplotypes by doing a BLAST search on GenBank (www. ncbi. nlm. nih. gov/ genbank/) and against available unpublished sequenc -es from Australasia. All sequenc-es were identified by the original name from published shorter sequences and/ or given a new coding identification for Indo-Pacific olive ridley turtles using the prefix Lo (e.g. Lo1, Lo2, etc.) and submitted to GenBank.
Molecular analysis
Genetic diversity was calculated as haplotype (h) and nucleotide (π; Nei 1987) diversities using the soft-ware Arlequin (v. 3.5) (Excoffier & Lischer 2010). Haplotype diversity takes into account the number of haplotypes in a population and their frequency within that population. Nucleotide diversity additionally considers the mean number of nucleotide differences (mutations) among all pairs of haplotypes in the pop-ulation. Higher levels of nucleotide diversity indicate higher levels of haplotype divergence within a popu-lation. Estimates for both measures of diversity vary between 0 and 1. The genetic distance among mtDNA haplotypes was calculated as a corrected percent se-quence divergence among haplotypes in the program MEGA (version 5.03) (Tamura et al. 2007). The pro-gram Modeltest 3.0 (Posada & Crandall 1998) was used to find the best model for nucleotide substitution, and this identified the model HKY85 + G (α= 0.1256) (Hasegawa et al. 1985) as appropriate for olive ridleys. The HKY85 + G model was then used to cor-rect for multiple substitutions per site and different substitution rates between transitions and transver-sions. Genetic differentiation among sampling loca-tions was tested using 2 different measures of popula-Fig. 1. (d) The 3 olive ridley rookeries in Australia sampled for this study, (s)
the origins of the additional sequences used from nesting sites in SE Java/Bali and the Birdshead Peninsula, Papua in Indonesia, and (h) sites for ghost net samples in the eastern and western Gulf of Carpentaria (GoC). Ellipse encloses
Tiwi Island/McCluer Group management unit
Au
th
o
r
co
p
[image:4.612.36.353.81.282.2]tion differentiation; a conventional FSTtest based only
on haplotype frequencies (Slatkin 1995), and the se-quence-based φSTtest. Both the FSTand φSTtests were
performed using Arlequin (v. 3.5). Testing for differ-ences in haplotype frequencies from ghost nets be-tween the western and the eastern GoC was done us-ing the program CHIRXC (Zaykin & Pudovkin 1993). This program applies a randomised chi-square test to detect significant shifts in haplotype frequencies be-tween the 2 sample locations.
A rarefaction curve was created using the rare -faction calculator (www. biology. ualberta. ca/ jbrzusto/ rarefact. php) to assess haplotype richness at the rookeries relative to sampling effort. This curve is a plot of the number of haplotypes as a function of the number of samples.
A network of haplotype relationships was con-structed based on statistical parsimony using the soft-ware TCS 1.13 (Templeton et al. 1992, Clement et al. 2000). Finally, the phylogenetic relationships among haplotypes was calculated based on 470 bp of shared sequences from this study and from olive ridley tur-tles in Surinam, Brazil, Guinea Bissau, Pacific Costa Rica, Malaysia, Sri Lanka (Bowen et al. 1997), India (Shanker et al. 2004) and 2 regions in Indonesia (Birdshead Peninsula, West Papua and SE Java/Bali) (I. B. W. Adnyana unpubl. data). Four sequences from Lepidochelys kempiiwere used as an out-group in the analysis (Bowen et al. 1997). A maximum likeli-hood tree was built using PAUP 4.0 (Swofford 2002). Node support was assessed with nonparametric bootstrap analysis (1000 replicates).
RESULTS
Overall we identified 24 haplotypes across the 780 bp fragment. These haplotypes were character -ised by 17 transitions, 2 transversions and 2 indels. All haplotypes were new and submitted to GenBank (accession numbers JN391445 to JN39 1465, KC 207828 to KC207830).
Rookery diversity
Sequencing of the mtDNA from 102 nesting turtles revealed eight 780 bp haplotypes (Table 1). In 5 of these haplotypes, the 470 bp segment corresponded to 4 previously identified shorter haplotypes (Haplo-types M, G, H, J) presented by Bowen et al. (1997) and Shanker et al. (2004). Of these 4 shorter haplo-types, 2 were previously identified from the McCluer
T
able 1.
Lepidochelys olivacea.
mtDNA contr
ol r
egion haplotype fr
equencies of 3 olive
ridley r
ookeries fr
om nor
ther
n Australia (Flinders Beach [FB], the McCluer Islands
gr
oup [MG] and T
iwi Islands [TI]) and fr
om tur
tles caught in ghost nets in the easter
n (E GoC) and wester
n (W GoC) Gulf of Carp
entaria
obtained in the cur
rent study
.
Equiv-alents between overlapping longer (Lo1
–
27, 780
bp) and shor
ter (J
–
M
, 470 bp) sequences ar
e shown as well as sample size (n), num
ber of haplotypes found (
H)
, and mean
(±
SD) haplotype diversity (
h)
and nucleotide diversity (
π
). Superscripts indicate haplotypes that coincide with sequences identified fr
om r
ookeries in
aBir
dshead Peninsula,
Papua, Indonesia or
bSE Java/Bali, Indonesia
Site n Hh π Lo1 a Lo2 Lo3 Lo4 Lo5 Lo6 Lo7 a Lo8 Lo9 Lo10 Lo11 Lo12 Lo13 Lo14 a,b Lo15 Lo16 a Lo17 a,b Lo18 Lo19 a Lo20 Lo21 Lo22 b Lo23 a,b Lo27 J G – H – – – – – – – – – – J – – ––– –– – M Rookeries FB 27 5 0.7493 0.0033 9 2 9 – – – – – – – – – – – 6 – – – – – – – – 1 (± 0.0413) (± 0.0019) MG 11 3 0.5636 0.0019 7 3 – – – – – – – – – – – – 1 – – ––– –– – – (± 0.1340) (± 0.0014) TI 64 6 0.3874 0.0012 51 7131 – – – – – – – – – – – – – – – 1 – – – (± 0.0705) (± 0.0009)
Ghost nets E GoC
Group (G and J), 2 from Sri Lanka (J and H), 1 from Malaysia (J), 1 from India (J) and 1 from Costa Rica (M) (Bowen et al. 1997, Shanker et al. 2004). Of the longer haplotypes we found, Lo1 was the most com-mon haplotype (66%) and it was found at all 3 rook-eries sampled. Lo2 was also found at all 3 rookrook-eries but at low frequency at Flinders Beach (7%) and the Tiwi Islands (11%), and a higher frequency at the McCluer Group (27%). Lo3 was found at a low fre-quency (< 2%) at the Tiwi Islands rookery and at a higher frequency (33%) at the Flinders Beach rook-ery. Lo4 and Lo5 were only found at the Tiwi Islands rookery and only at low frequencies (< 4% and < 2%, respectively). Lo15 was found at the McCluer Group (10%, 1 individual) and Flinders Beach (22%) rook-eries. One haplotype, Lo27, was only found at Flinders Beach at a low frequency (4%).
Genetic diversity in the sampled rookeries was low to moderate. Haplotype diversity varied between 0.39 and 0.75, and estimates of nucleotide diversity were low and ranged from 0.0012 to 0.0033 (Table 1). The low level of nucleotide diversity was reflected in the shallow divergence among the 7 haplotypes, with se-quence divergence ranging from 0.1 to 0.8%. Con-struction of a haplotype network showed that these rookery haplotypes varied by 1 to 8 mutations (Fig. 2).
Population differentiation
The neighbouring Tiwi Islands and McCluer Group rookeries, which are separated by just 200 km, were not genetically differentiated using either the con-ventional FST(FST= 0.0056, p = 0.307) or the se
quence-based φST(φST= 0.004, p = 0.303) distance estimates.
In contrast the Flinders Beach and Tiwi Islands rook-eries, which are 1200 km apart, were genetically dif-ferentiated under both methods of analysis (FST =
0.244, p < 0.001 and φST = 0.168, p = 0.0009). The
Flinders Beach and McCluer Group rookeries, which are 1000 km apart, were significantly differentiated when using FST(FST= 0.109, p = 0.039) but not when
using φST (φST = 0.017, p = 0.274). However, when
combining the 2 neighbouring (and genetically indis-tinguishable) Tiwi and McCluer rookeries, they were highly differentiated from Flinders Beach under both methods of analysis (FST= 0.236, p < 0.001 and φST=
0.157, p < 0.0007).
Genetic composition of captures by ghost nets
The genetic composition of turtles caught in ghost nets varied between the eastern GoC (n = 23) and western GoC (n = 21). The genetic diversity in the eastern GoC ghost net samples was similar or slightly higher than that of the rookery samples for haplotype (h= 0.73) and nucleotide (π= 0.0039) diversity, while the western GoC showed a much greater genetic diversity than the rookery samples for both haplo-type (h= 0.97) and nucleotide (π= 0.0048) diversity) (Table 1). A total of 17 mtDNA haplotypes were iden-tified among western GoC samples in comparison to the 9 haplotypes found in the eastern GoC samples (Table 1). The randomised chi-square test indicated low but significant variation in the haplotype fre-quencies of turtles sampled from the 2 regions (p = 0.035). The common rookery haplotype Lo1 was also the most common haplotype found in the eastern GoC (52%) and the western GoC (19%) ghost net samples. An addi-tional 3 Australian rookery haplotypes were identified among the western GoC samples (Lo2, Lo4 and Lo21), but at low frequency. Eight haplotypes from the ghost net samples matched unpub-lished haplotypes recently identified at 2 rookeries in Indonesia (Table 1, Figs. 1 & 3) (I. B. W. Adnyana unpubl. data), 7 of which were not found among the Australian rookeries. The remain-ing 9 haplotypes found across the 2 ghost net locations were each present at low frequency (< 7%), but together made up 32% of the total ghost net sample and are ‘orphan’ haplotypes that have not been found in any nesting Fig. 2. Lepidochelys olivacea.Haplotype network based on maximum
parsi-mony of 780 bp of the mtDNA control region. Vertical and horizontal bars represent 1 extra mutational step connecting 2 haplotypes. Pie charts repre-sent the distribution of the haplotypes at either 1 of the 3 Australian rookeries (grey) or samples from ghost nets (black). The size of the circles represents
the relative frequency of the haplotypes out of the total sample
Au
th
o
r
co
p
population to date. These orphan haplotypes showed slightly more divergence (sequence divergence range from 0.1 to 1.0%) than the Australian rookery sam-ples (sequence divergence range from 0.1 to 0.8%). The haplotype network indicated greater complexity among ghost net samples than that found within the rookery samples (Fig. 2). To consider whether the orphan haplotypes may be due to low sample size in our nesting samples we created a rare faction curve (Fig. 4). The visibly asymptotic curve for the North-ern Territory indicates that the most of the diversity
in the population is represented within the sample, but the curve for Cape York is still increasing, although starting to level off. This suggests that increased sampling could reveal additional haplotypes at low frequency in Cape York. It is unlikely, however, that this would account for the large number of orphan haplotypes found in the ghost net samples.
Phylogeography
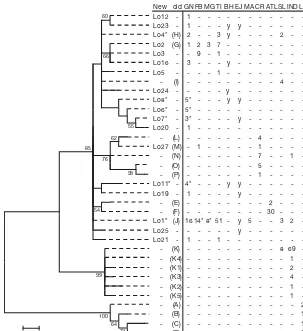
There were 2 ambiguous loops in the haplotype network (Fig. 2) that were resolved using Pfenninger & Posada’s (2002) criteria. Overall, the haplotype network reflected the low divergence among all nest-ing samples. The common Haplo-type Lo1 (J) is also found in Indone-sia, India, Sri Lanka and Malaysia. This haplotype is central in the net-work and is likely an ancestral haplotype from which other ha -plotypes in the Indo-Pacific were de rived, thus suggesting that this haplotype was central to the (re) -colonisation of the Atlantic and Pacific Oceans. Most of the haplo-types found in samples from ghost nets form their own cluster of closely related haplotypes that include the orphan haplotypes that have not been identified at any rookery to date. The phylogenetic tree showed poor bootstrap support for most branches due to the low sequence divergence among olive ridley haplotypes (Fig. 3). There were, however, some clear patterns in the tree. The K haplotypes found only in India and Sri Lanka had high support as a distinct and divergent clade relative to all other olive ridley haplotypes. There was some support (> 60% bootstrap) for the grouping of eastern Pacific haplotypes (L, M, N, O, P). It is worth noting that 1 turtle from Flinders Beach had Haplotype Lo27, which is identical to the eastern Pacific Haplotype M for the 470 bp fragment. A similar scenario was found in India, where an eastern Pacific haplotype (N) was found 71
64 100 99
93 55
62
76
54 60
66
85
0.005
New old GN FB MG TI BH EJ MA CR ATLSL IND LK
Lo12 - 1 - - -
-Lo23 - 1 - - - y y - - -
-Lo4* (H) 2 - - 3 y - - - - 2 -
-Lo2 (G) 1 2 3 7 - - - -Lo3 - - 9 - 1 - - - -Lo16 - 3 - - - y - - - -Lo5 - - - - 1 - - -
-- (I) - - - 4 -
-Lo24 - - - y - - - -Lo8* - 5* - - - y y - - - -Lo6* - 5* - - - -Lo7* - 3* - - - - y - - - -Lo20 - 1 - - - -- (L) - - - 4 - - -
-Lo27 (M) - 1 - - - 1 - - -
-- (N) - - - 7 - - 1
-- (O) - - - 5 - - -
-- (P) - - - 1 - - -
-Lo11* - 4* - - - y y - - - -Lo19 - 1 - - - - y - - - -- (E) - - - 2 - -
-- (F) - - - 30 - -
-Lo1* (J) 16 14* 8* 51 - y 5 - - 3 2 -Lo25 - - - y - - - -Lo21 - 1 - - 1 - - -
-- (K) - - - 8 69 -- (K4) - - - 1
-- (K1) - - - 2
-- (K3) - - - 4
-- (K2) - - - 1
-- (K5) - - - 1
-- (A) - - - 2
- (B) - - - 1
- (C) - - - 1
[image:7.612.55.358.81.412.2]- (D) - - - 5
Fig. 3. Lepidochelys olivacea.Evolutionary relationships of haplotypes based on 470 bp mtDNA sequence. The evolutionary history was inferred using the maximum likelihood method. The percentage of replicate trees in which the associated taxa clustered together in the bootstrap test (1000 replicates) is shown next to the branches (only values above 50% are shown). Haplotypes and their frequencies are shown for samples collected in the ghost nets (GN), and at rookeries at Flinders Beach (FB), McCluer Group (MG) Islands, Tiwi Is-lands (TI) (this study), Birdshead Peninsula (BH) and East Java (EJ) (I. B. W. Adnyana pers. comm.), Malaysia (MA), Costa Rica (CR), Atlantic Ocean (ATL), Sri Lanka (SL) (Bowen et al. 1997) and India (IND) (Shanker et al. 2004). L. kempii(LK) was used as an outgroup (Bowen et al. 1997). y (for BH and EJ): haplotypes found in those rookeries but no frequency data is available. Haplo-types marked with an asterisk are different at the 780 bp but identical at the 470 bp used for the tree: Lo1 = Lo15, Lo7 = Lo9, Lo6 = Lo10 and Lo13, Lo8 =
Lo14, Lo18 and Lo22, Lo4 = Lo26, and Lo11 = Lo17 (see Table 1)
Au
th
o
r
co
p
at low frequency (Shanker et al. 2004). Future long sequencing of East Pacific olive ridleys with Hap-lotype M and N could help determine if they are identical for the longer fragment. There was little genetic distance between Atlantic and Pacific hap-lotypes, but some support (52% bootstrap) group-ing the Atlantic haplotypes (E and F). There was also low support (61% bootstrap) for a clade con-taining a mix of haplotypes from throughout SE Asia (including Australia) and many of the ‘orphan’ haplotypes from the ghost net samples.
DISCUSSION
This study indicates that the critically small olive ridley population nesting along western Cape York is genetically isolated from the larger population in the Northern Territory that nests around the Tiwi Islands and the McCluer Group (Limpus 2008), and should thus be regarded as a separate MU. The genetic results are also consistent with the notion that insufficient numbers of turtles from the Northern Territory nest along western Cape York and that connectivity is so low that it is unlikely for the former to recolonise the area in the event of population extirpation. Additionally, it appears that entanglement of olive ridley turtles by ghost nets is impacting not only the Australian rookeries, but also more distant rookeries in the region.
Genetic diversity and phylogeography
Genetic diversity within Australian rookeries is moderate, with closely related haplotypes that ap -pear to have diverged from 2 common haplotypes (Lo1 [J] and Lo4 [H]), similar to observations of divergent haplotypes from Atlantic and eastern Pacific rookeries. All haplotypes observed in the rookery and ghost net samples come from the line-age of Indo-Pacific and Atlantic haplotypes that are separated from the previously observed K clade of India, which is thought to be the ancestral source for the contemporary distribution of olive ridley turtle populations (Bowen et al. 1997, Shanker et al. 2004). Haplotype J, which we have identified as 2 haplo-types, Lo1 and Lo15 (using 780 bp), has been observed at rookeries in India (Shanker et al. 2004), Sri Lanka, Malaysia (Bowen et al. 1997), Indonesia (I. B. W. Adnyana unpubl. data), the Tiwi Islands, the McCluer islands and western Cape York (Fig. 3), and in stranded turtles caught in ghost nets. The splitting of the common J haplotype when using longer sequences was helpful in characterising pop-ulation boundaries of the Australian poppop-ulations and will prove useful once additional samples are sequenced from throughout the region. Tests for genetic divergence between rookeries in Australia and Sri Lanka verify the separation of these popula-tions (Sri Lanka and Northern Territory FST= 0.508;
[image:8.612.65.531.77.309.2]Sri Lanka and western Cape York FST = 0.281). Fig. 4. Lepidochelys olivacea.Rarefaction curve of samples collected from the 2 genetic stocks (Cape York and the Northern
Territory). The 2 curves plot the number of haplotypes as a function of the number of samples
Au
th
o
r
co
p
Unfortunately, sample sizes from Malaysia were too small for comparisons, but all 5 samples had the J haplotype (Bowen et al. 1997). Comparisons with green turtles, which share the same nesting regions, suggest that populations in neighbouring countries will be genetically distinct (Dethmers et al. 2006, Jensen 2010), but the geographic spread of olive ridley haplotypes in the Atlantic and eastern Pacific (Bowen et al. 1997, Shanker et al. 2004, Castro & Rocha-Olivares 2005) suggests that the divergent haplotypes in Australia will be observed at other rookeries within the region. Previous analy-ses suggest that there has been a range expansion in olive ridley turtles between Sri Lanka and Aus-tralia, and long-distance colonisation, likely from west to east across the Indian Ocean (Shanker et al. 2004), which is consistent with the observed new rookery haplotypes that have little genetic diver-gence. Similar to the findings of Shanker et al. (2004) in India, the presence of an eastern Pacific haplotype in Australia supports the hypothesis that infrequent, long-distance dispersal of this species occurred at some time in the past.
Estimates of genetic divergence and diversity have provided insights into marine turtle colonisa-tion histories (Shanker et al. 2004, López-Castro & Rocha-Olivares 2005), including within the study area (Dethmers et al. 2006). The Arafura Sea-GoC areas of the Australian-New Guinea continental shelf were terrestrial habitat during the Pleistocene lower sea levels. Colonisation by nesting marine turtles was only possible following sea level rises towards the end of the last ice age, with flooding of the western Arafura Sea into the GoC sometime after 12 000 yr BP (Yokoyama et al. 2001). Gillieson (2005) summarised sand dune geomorphology for the coastal areas of western CYP near Mapoon, con-cluding that postglacial sea level rise in northern Australia ceased by about 5500 yr BP and was asso-ciated with widespread coastal dune formation and periodic reworking of Pleistocene sand masses. In green turtles, colonisation of beaches in the western and southern GoC from the west, and subsequent genetic divergence, is indicated by larger mtDNA genetic divergence found between the populations in the GoC and northern Great Barrier Reef (FST= 0.65) in comparison to that between the GoC
and Northwest Shelf (Western Australia) (FST= 0.26)
populations (FitzSimmons et al. 1997). Additionally, the prevalence of haplotypes that are shared between the GoC population and populations from Western Australia and SE Asia, rather than from populations in the Pacific, further suggests
colonisa-tion from the north or west, followed by genetic iso-lation (Dethmers et al. 2006). A similar scenario may have occurred during olive ridley colonisation of the GoC, given the sharing of the 3 most common lotypes, in addition to possibly having unique hap-lotypes in each population. It appears that genetic divergence has occurred be tween olive ridley popu-lations in the Northern Territory and western Cape York (FST = 0.24) since the colonisation of this area
from the western Indian Ocean (Shanker et al. 2004). In contrast, a lower level of genetic divergence was observed among flatback rookeries in the Northern Territory and GoC (mean FST = 0.05; Pittard 2010),
and no divergence was observed between hawksbill turtle rookeries in the Northern Territory and north-ern Queensland (Broderick et al. 1994), suggesting either a delayed colonisation by these species or ongoing gene flow.
Ghost nets and conservation issues
The nesting distribution and densities of olive rid-ley turtles throughout SE Asia, the eastern Indian Ocean and the western Pacific Ocean have been poorly documented, and even less is known of forag-ing populations in the region. The high number of orphan haplotypes found in ghost net samples high-lights the need for a more extensive sampling of olive ridley rookeries in SE Asia and the western Pacific. Outside of Australia, adult and immature olive ridley turtles are both known to make long-distance migra-tions to forage in distant pelagic areas in the open ocean (Polovina et al. 2004, Morreale et al. 2007, Plotkin 2007). In contrast, satellite telemetry studies of adult of olive ridley turtles breeding in the North-ern Territory indicate that they disperse to a range of different foraging areas but appear to remain over the northern Australian continental shelf where they forage on benthic communities (Conway 1994, McMahon et al. 2007, Whiting et al. 2007a, Conway & Guinea 2009). Flipper tag recoveries and genetic studies of green turtles in foraging grounds around northern Australia (Limpus 2007, Dethmers et al. 2010, Jensen 2010) have indicated that these forag-ing populations are composed of turtles from various rookeries throughout the region, including Indonesia and Malaysia (Limpus 2007, Dethmers et al. 2010). Foraging olive ridley turtles in the region are also likely to include at least a significant proportion of adult and immature turtles from rookeries outside Australia (particularly Indonesia and Papua New Guinea). However, it is becoming less likely that
for-Au
th
o
r
co
p
aging turtles in the Arafura Sea have come from Malaysian rookeries as they had severely declined to a few turtles by the mid-1990s (Chan 2006, Abreu-Grobois and Plotkin 2008) and the estimated age to maturity in this species is only 10 to 18 yr (Zug et al. 2006).
Every year, thousands of abandoned or lost fishing nets (ghost nets) are found along the beaches of the GoC and the northern coast of the Northern Terri-tory. While a few of these are from the Australian prawn fishery, most (> 90%) are thought to be of for-eign origin, probably from fisheries operating in Indonesian waters (Kiessling 2003, White 2006). It is unknown where these nets are discarded, but many enter the GoC where they entangle and kill many fish, sharks, and turtles while drifting (White 2006, Limpus 2008, Gunn et al. 2010). The majority of these nets are found on the eastern side of the GoC from Cape York to south of Weipa during the wet season when the northwest monsoon winds blow, and on the western side of the GoC from Cape Arn-hem to Groote Eylandt during the dry season when the southeast trade winds blow (Gunn et al. 2010). Our haplotype results from stranded turtles caught in ghost nets revealed that 45% of the haplotypes (32% of all ‘ghost net’ samples) have not been observed at any rookery and their nesting origin is therefore not traceable at present. The remaining 11 haplotypes matched those found in the Australian rookeries or in 2 rookeries in Indonesia, but low sample numbers prevent any meaningful mixed stock analysis. These findings do however suggest that Australian rookeries in the Northern Territory as well as within the GoC are losing turtles to the ghost nets. This conclusion is corroborated by satel-lite tracking data of a turtle tagged while nesting at the Tiwi Islands that subsequently foraged along the western GoC (Whiting et al. 2007a). While our sample sizes are small and any conclusions have to be interpreted with caution, the difference in haplo-type composition between the eastern and western GoC ghost net samples indicate that nets stranding along the western GoC are catching a genetically more diverse group of turtles, which presumably have more diverse origins than those caught in nets found in the eastern GoC. Overall, the presence of 16 orphan haplotypes in the ghost net samples indi-cates that these turtles likely originate from several rookeries. Given the placement of the unknown haplotypes in the neighbour-joining tree (Fig. 3), it would not be surprising to find that ghost nets are impacting rookeries that span a large geographical area. The neighbour-joining tree places many of the
orphan haplotypes in their own clade, suggesting that there remain significant unsampled rookeries in the Indo-Pacific.
At this point, it remains unclear whether the diverse mixture of haplotypes found in the ghost nets result from entanglement within the GoC of a diverse mixed stock of turtles foraging within the GoC or from turtles foraging at more distant locations that were captured by ghost nets that subsequently drifted into the GoC. The presence of several (8 of 16 re -corded) turtles that were still alive in the ghost nets in the western GoC, suggests that these turtles could have drifted in from no further away than the adja-cent Arafura Sea. In contrast, all 8 ghost net entan-gled turtles from the western GOC that were classed as either ‘dead’ or ‘decomposed’ either had orphan haplotypes, or those found only in Indonesia, sug-gesting support for longer transport distances. Future work on ghost nets should attempt to document the relative amount of time a ghost net has drifted based on epibionts, as well as collecting data on the size and condition of entangled turtles.
This study adds to the growing body of evidence that concerted conservation action is needed to manage the Australian olive ridley populations, par-ticularly those from the western Cape York beaches, to guarantee the survival of this threatened popula-tion into the future. Decades of high depredapopula-tion of eggs by feral pigs, feral dogs and varanids, previous incidental bycatch in prawn trawl nets (Poiner & Harris 1996) and other fisheries, Indigenous harvest, and unknown numbers of turtles killed in ghost nets have put olive ridley populations in Australia under risk of extinction (Limpus 2008). To better under-stand the status of the Australian populations, it is important to increase the genetic sampling through-out their range. Sporadic and low-density nesting occurs within the western GoC at the Sir Edward Pellew Islands and Groote Eylandt in the Northern Territory. Sampling of these beaches will help de -termine whether these turtles belong to the Arnhem Land or to the western Cape York stock. More broadly, additional sampling of other olive ridley rookeries in the region, including in southern Papua New Guinea, are needed to determine population boundaries and allow a better evaluation of the ori-gin of turtles caught in ghost nets. Field studies aimed at increasing nesting success are being con-ducted in western Cape York in conjunction with Indigenous ranger groups, and new studies on ghost nets have been initiated that will aid in our understanding and the conservation of the olive rid-leys in Australia.
Au
th
o
r
co
p
Acknowledgements. We sincerely thank volunteers of the Queensland Turtle Conservation Project of the Department of Environment and Heritage Protection (QDEHP) and L. Booth and other Mapoon Indigenous Land and Sea Rangers and the Marine Ranger Program of the Mapoon Aboriginal Shire Council for assisting in collection of the samples of nesting turtles and turtles in ghost nets on the Mapoon beaches. The sampling would not have occurred without the collaboration between the Mapoon Aboriginal Shire Council, the traditional owners of Mapoon lands, the local Indi -genous rangers and the Queensland Turtle Conservation Project. The sampling at the Tiwi Islands would not have occurred if not for the collaborative relationship with Tradi-tional Owners C. Kalippa and Murphy, D. Tippakalippa, J. Long and K. Hadden of the Tiwi Land Council Marine Ranger Program and A. Lauder of NT Coastcare. We thank the Dhimurru Aboriginal Corporation, the many Indigenous rangers and the scientists and volunteers who have con-tributed to the Dhimurru Miyapunu (Marine Turtle) Project for providing samples from turtles entrapped in ghost nets in the Western Gulf of Carpentaria, Northern Territory, Aus-tralia. Many thanks to S. Pittard and N. Aitken for providing laboratory assistance. Earlier drafts of the manuscript bene-fited from comments by C. Wabnitz, D. Waayers, J. van de Merwe, B. Shamblin and C. Allen. Funding was provided on the Tiwi Islands by the Australian Government Natural Her-itage Trust, Caring for our Country programs and the Queensland Department of Environment and Heritage Pro-tection. The genetic sampling in Queensland was conducted as part of the Queensland Turtle Conservation Project of the Department of Environment and Heritage Protection. The sampling in the Northern Territory was collected under wildlife permits through Northern Territory Parks and Wildlife and Animal Ethics from Charles Darwin University (A4005).
LITERATURE CITED
Abreu-Grobois A, Plotkin P (IUCN SSC Marine Turtle Spe-cialist Group) (2008) Lepidochelys olivacea. In: IUCN Red List of Threatened Species, Version 2012.2. IUCN, Gland
Abreu-Grobois FA, Horrocks JA, Formia A, Dutton PH and others (2006) New mtDNA D-loop primers which work for a variety of marine turtle species may increase the resolution of mixed stock analysis. In: Frick M, Pana -gopoulou A, Rees AF, Williams K (eds) Proc 26th Annu Symp Sea Turtle Biology and Conservation, Crete, 3–8 April 2006. International Sea Turtle Society, Athens, p 179
Bass AL (1999) Genetic analysis to elucidate the natural his-tory and behavior of hawksbill turtles (Eretmochelys imbricata) in the wider Caribbean: a review and re-analysis. Chelonian Conserv Biol 3: 195−199
Bass AL, Epperly SP, Braun-McNeill J (2006) Green turtle (Chelonia mydas) foraging and nesting aggregations in the Caribbean and Atlantic: impact of currents and behavior on dispersal. J Hered 97: 346−354
Bernardo J, Plotkin PT (2007) An evolutionary perspective on the arribada phenomenon and reproductive behav-ioral polymorphism of olive ridley sea turtles ( Lepi-dochelys olivacea). In: Plotkin P (ed) Biology and conser-vation of ridley sea turtles. Johns Hopkins University Press, Baltimore, MD, p 59−88
Bowen BW (1995) Tracking marine turtles with genetic markers: voyages of the ancient mariners. BioScience 45: 528−534
Bowen BW, Meylan AB, Ross JP, Limpus CJ, Balazs GH, Avise JC (1992) Global population structure and natural history of the green turtle (Chelonia mydas) in terms of matriarchal phylogeny. Evolution 46: 865−881
Bowen BW, Bass AL, Garcia-Rodriguez A, Diez CE and others (1996) Origin of hawksbill turtles in a Carib -bean feeding area as indicated by genetic markers. Ecol Appl 6: 566−572
Bowen BW, Clark AM, Abreu-Grobois FA, Chaves A, Reichart HA, Ferl RJ (1997) Global phylogeography of the ridley sea turtles (Lepidochelys spp.) as inferred from mitochondrial DNA sequences. Genetica 101: 179−189 Broderick D, Moritz C, Miller JD, Guinea M, Prince RIT,
Limpus CJ (1994) Genetic studies of the hawksbill turtle
Eretmochelys imbricata: evidence for multiple stocks in Australian waters. Pac Conserv Biol 1: 123−131
Browne D, Horrocks JA, Abreu-Grobois FA (2010) Popula-tion subdivision in hawksbill turtles nesting on Barbados, West Indies, determined from mitochondrial DNA con-trol region sequences. Conserv Genet 11: 1541−1546 Chan EH (2001) Status of marine turtle conservation and re
-search in southeast Asia. In: Schäuble C, Hien BTT (eds) Proc Vietnam’s First National Workshop on Marine Tur-tle Conservation, IUCN-Vietnam and Ministry of Fish-eries, Hanoi
Chan EH (2006) Marine turtles in Malaysia: On the verge of exstinction? Aquat Ecosys Health Manag 9:175–184 Chassin-Noria O, Abreu-Grobois FA, Dutton PH, Oyama K
(2004) Conservation genetics of the East Pacific green turtle (Chelonia mydas) in Michoacan, Mexico. Genetica 121: 195−206
Chatto R, Baker B (2008) The distribution and status of mar-ine turtle nesting in the Northern Territory. Parks and Wildlife Service, Department of Natural Resources, Envi-ronment, The Arts and Sport, Northern Territory Gov-ernment, Darwin
Clement M, Posada D, Crandall KA (2000) TCS: a computer program to estimate gene genealogies. Mol Ecol 9: 1657−1659
Conway SP (1994) Diets and feeding biology of adult olive ridley (Lepidochelys olivacea) and loggerhead (Caretta caretta) sea turtles in Fog Bay (Northern Territory). Post-graduate Diploma of Science thesis, Northern Territory University, Darwin
Conway SP, Guinea ML (2009) Diet and feeding biology of adult olive ridley (Lepidochelys olivacea) and logger-head (Caretta caretta) sea turtles in Fog Bay, Northern Territory. In: Belskis L, Frick M, Panagopoulou A, Rees A, Williams K (eds) Proc 29th Annu Symp Sea Turtle Biology and Conservation, Brisbane, 17–19 Feb 2009. NOAA Tech Memo NOAA NMFS-SEFSC-630, p 4 da Silva ACCD, de Castilhos JC, Lopez GG, Barata PCR
(2007) Nesting biology and conservation of the olive ridley sea turtle (Lepidochelys olivacea) in Brazil, 1991/ 1992 to 2002/2003. J Mar Biol Assoc UK 87: 1047−1056 da Silva ACCD, dos Santos EAP, Oliveira FLdC, Weber MI,
Batista JAF, Serafini TZ, de Castilhos JC (2011) Satellite-tracking reveals multiple foraging strategies and threats for olive ridley turtles in Brazil. Mar Ecol Prog Ser 443: 237−247
Dethmers KEM, Broderick D, Moritz C, FitzSimmons NN and others (2006) The genetic structure of Australasian
Au
th
o
r
co
p
y
➤
➤
➤
➤
➤
➤
➤
➤
➤
➤
green turtles (Chelonia mydas): exploring the geograph-ical scale of genetic exchange. Mol Ecol 15: 3931−3946 Dethmers KEM, Jensen MP, FitzSimmons NN, Broderick D,
Limpus CJ, Moritz C (2010) Migration of green turtles
(Chelonia mydas) from Australasian feeding grounds
inferred from genetic analyses. Mar Freshw Res 61: 1376−1387
Drummond AJ, Ashton B, Buxton S, Cheung M and others (2011) Geneious v5.4. Available from www. geneious. com Drysdale V, White P, Wise P, Roeger S (2009) Research on the impact of marine debris on marine turtle survival and behaviour: north east Arnhem Land, Northern Territory, Dhimurru Turtle Entanglement Report and Dhimurru Turtle Tracking Report. Dhimurru Aboriginal Corpor-taion, Nhulunbuy. Available at www. environment. gov. au/ biodiversity/ threatened/ publications/ pubs/ marine-debris-dhimurru. pdf
Dutton PH, Bowen BW, Owens DW, Barragan AR, Davis SK (1999) Global phylogeography of the leatherback turtle (Dermochelys coriacea). J Zool 248: 397−409
Dutton P, Roden S, Stewart KR, LaCasella E and others (2013) Population stock structure of leatherback turtles (Dermochelys coriacea) in the Atlantic revealed using mtDNA and microsatellite markers. Conserv Genet 14: 625–636
Encalada SE, Lahanas PN, Bjorndal KA, Bolker B, Miyamoto MM, Bowen BW (1996) Phylogeography and population structure of the Atlantic and Mediterranean green turtle
Chelonia mydas: a mitochondrial DNA control region
sequence assessment. Mol Ecol 5: 473−483
Excoffier L, Lischer HEL (2010) Arlequin suite ver 3.5: a new series of programs to perform population genetics ana -lyses under Linux and Windows. Mol Ecol Resour 10: 564−567
FitzSimmons NN (1998) Single paternity of clutches and sperm storage in the promiscuous green turtle (Chelonia mydas). Mol Ecol 7: 575−584
FitzSimmons NN, Moritz C, Limpus CJ, Pope L, Prince RIT (1997) Geographic structure of the mitochondrial and nuclear gene polymorphisms in Australian green turtle populations and male-biased gene flow. Genetics 147: 1843−1854
Gillieson D (2005) Coastal geomorphology and historic change in the Pennefather River area, Cape York. Geog-raphy Monograph Series 10 Royal Geographical Society of Queensland, Brisbane, p 201−213
Guinea ML, Chatto R (1992) Sea turtles killed in Australian shark fin fishery. Mar Turtle Newsl 57: 5−6
Gunn R, Hardesty BD, Butler J (2010) Tackling ‘ghost nets’: local solutions to a global issue in northern Australia. Ecol Manage Restor 11: 88−98
Hamann M, Limpus CJ, Owens DW (2003) Reproductive cycles of males and females. In: Lutz PL, Musick JA, Wyneken J (eds) The biology of sea turtles, Vol 2. CRC Press, Boca Raton, FL, p 135−161
Hamann M, Cuong CT, Hong ND, Thuoc P, Thuhien BT (2006) Distribution and abundance of marine turtles in the Socialist Republic of Viet Nam. Biodivers Conserv 15: 3703−3720
Hasegawa M, Kishino H, Yano T (1985) Dating of the human-ape splitting by a molecular clock of mitochondr-ial DNA. J Mol Evol 22: 160−174
Ireland JS, Broderick AC, Glen F, Godley BJ, Hays GC, Lee PLM, Skibinski DOF (2003) Multiple paternity assessed using microsatellite markers, in green turtles Chelonia
mydas (Linnaeus, 1758) of Ascension Island, South
Atlantic. J Exp Mar Biol Ecol 291: 149−160
Jensen MP (2010) Assessing the composition of green turtle (Chelonia mydas) foraging grounds in Australasia using mixed stock analyses. PhD thesis, University of Canberra Jensen MP, Abreu-Grobois FA, Frydenberg J, Loeschcke V (2006) Microsatellites provide insight into contrasting mating patterns in arribada vs. non-arribada olive ridley sea turtle rookeries. Mol Ecol 15: 2567−2575
Jensen MP, FitzSimmons NN, Dutton PH (2013) Molecular genetics of sea turtles. In: Wyneken J, Musick J, Lohman K (eds) The biology of sea turtles, Vol 3. CRC Press, Boca Raton, FL, p 135–161
Kiessling I (2003) Finding solutions: derelict fishing gear and other marine debris in Northern Australia. National Oceans Office, Hobart
Lee PLM (2008) Molecular ecology of marine turtles: New approaches and future directions. J Exp Mar Biol Ecol 356: 25−42
LeRoux RA, Dutton PH, Abreu-Grobois AF, Lagueux CJ and others (2012) Re-examination of population structure and phylogeography of hawksbill turtles in the Wider Caribbean using longer mtDNA sequences. J Hered 103: 806–820
Limpus CJ (1997) Marine turtle populations of the Southeast Asia and the western Pacific region: distribution and sta-tus. In: Noor YR, Lubis IR, Ounsted R, Troeng S, Abdul-lah A (eds) Proc Workshop Marine Turtle Research and Management in Indonesia. Wetlands International/ PHPA/ Environment Australia, Bogor, p 37−73
Limpus CJ (2007) A biological review of Australian marine turtles. 2. Green turtle Chelonia mydas (Linneus). Queensland Environmental Protection Agency, Brisbane. Available at www.austurtle.org.au/SeaTurtle Biology/ green _Linnaeus.pdf
Limpus CJ (2008) A review of Australian marine turtles: 4. Olive ridley turtle (Lepidochelys olivacea). Queensland Environment Protection Agency, Brisbane. Available at www. austurtle. org. au/ Sea Turtle Biology/ Olive%20 Ridley _Escholtz.pdf
López-Castro MC, Rocha-Olivares A (2005) The panmixia paradigm of eastern Pacific olive ridley turtles revised: consequences for their conservation and evolutionary biology. Mol Ecol 14: 3325−3334
Maxwell SM, Breed G, Nickel B, Makanga-Bahouna J and others (2011) Using satellite tracking to optimize protec-tion of long-lived marine species: olive ridley sea turtle conservation in central Africa. PLoS ONE 6: e19905 McMahon CR, Bradshaw CJA, Hays GC (2007) Satellite
tracking reveals unusual diving characteristics for a mar-ine reptile, the olive ridley turtle Lepidochelys olivacea.
Mar Ecol Prog Ser 329: 239−252
Moore JE, Wallace BP, Lewison RL, Zydelis R, Cox TM, Crowder LB (2009) A review of marine mammal, sea tur-tle and seabird bycatch in USA fisheries and the role of policy in shaping management. Mar Policy 33: 435−451 Moritz C (1994) Defining ‘evolutionarily significant units’ for
conservation. Trends Ecol Evol 9: 373−375
Morreale SJ, Plotkin PT, Shaver DJ, Kalb HJ (2007) Adult migration and habitat utilization: ridley turtles in their element. In: Plotkin PT (ed) Biology and conservation of ridley sea turtles. Johns Hopkins University Press, Balti-more, MD, p 213−229
Nei M (1987) Molecular evolutionary genetics. Columbia University Press, New York, NY
Au
th
o
r
co
p
y
➤
➤
➤
➤
➤
➤
➤
➤
➤
➤
➤
➤
➤
➤
➤
➤
➤
➤
Pfenninger M, Posada D (2002) Phylogeographic history of the land snail Candidula unifasciata(Helicellinae, Sty-lommatophora): fragmentation, corridor migration, and secondary contact. Evolution 56: 1776−1788
Pittard SD (2010) Genetic population structure of the flat-back turtle (Natator depressus): a nuclear and mito -chondrial DNA analysis. Honours thesis, University of Canberra
Plotkin PT (2007) Olive ridley sea turtle (Lepidochelys oliv acea). Five-year review: summary and evaluation. NMFS, Silver Spring, MD and USFWS, Jacksonville, FL Poiner IR, Harris ANM (1996) Incidental capture, direct mor-tality and delayed mormor-tality of sea turtles in Australia’s northern prawn fishery. Mar Biol 125: 813−825
Polovina JJ, Balazs GH, Howell EA, Parker DM, Seki MP, Dutton PH (2004) Forage and migration habitat of log-gerhead (Caretta caretta) and olive ridley (Lepidochelys olivacea) sea turtles in the central North Pacific Ocean. Fish Oceanogr 13: 36−51
Posada D, Crandall KA (1998) Bioinformatics applications note modeltest: testing the model of DNA substitution. Evolution 14: 817−818
Prince RIT, Jensen MP, Oades D, The Bardi Jawi Rangers (2010) Olive ridley turtle presence and nesting records for Western Australia. Mar Turtle Newsl 129: 9−11 Pritchard PCH (2007a) ArribadasI have known. In: Plotkin P
(ed) Biology and conservation of ridley sea turtles. Johns Hopkins University Press, Baltimore, MD, p 7−21 Pritchard PCH (2007b) Evolutionary relationships. Oste o logy,
morphology and zoogeography of ridley sea turtles. In: Plotkin P (ed) Biology and conservation of ridley sea turtles. Johns Hopkins University Press, Baltimore, MD, p 45−57 Pritchard PCH, Plotkin PT (1995) Olive ridley sea turtle,
Lepidochelys olivacea. Status reviews of sea turtles listed under the endangered species act of 1973. National Mar-ine Fisheries Service, St. Petersburg, FL
Shamblin BM, Dodd MG, Bagley DA, Ehrhart LM and oth-ers (2011) Genetic structure of the southeastern United States loggerhead turtle nesting aggregation: evidence of additional structure within the peninsular Florida recovery unit. Mar Biol 158: 571−587
Shanker K, Ramadevi J, Choudhury BC, Singh L, Aggarwal RK (2004) Phylogeography of olive ridley turtles ( Lepi-dochelys olivacea) on the east coast of India: implications for conservation theory. Mol Ecol 13: 1899−1909
Slatkin M (1995) A measure of population subdivision based on microsatellite allele frequencies. Genetics 139: 457−462
Swofford DL (2002) PAUP*. Phylogenetic analysis using par-simony (*and other methods). Version 4. Sinauer Associ-ates, Sunderland, MA
Tamura K, Dudley J, Nei M, Kumar S (2007) MEGA4: Molecular Evolutionary Genetics Analysis (MEGA) soft-ware version 4.0. Mol Biol Evol 24: 1596−1599
Templeton AR, Crandall KA, Sing CF (1992) A cladistic analysis of phenotype associations with haplotypes inferred from restriction endonuclease mapping and DNA sequence data. III. Cladogram estimation. Genetics 132: 619−633
Thompson JD, Higgins DG, Gibson TJ (1994) CLUSTAL W: improving the sensitivity of progressive multiple sequence alignment through sequence weighting, posi-tion-specific gap penalties and weight matrix choice. Nucleic Acids Res 22: 4673−4680
Thorbjarnarson JB, Platt SG, Khaing ST (2000) Sea turtles in Myanmar: past and present. Mar Turtle Newsl 88: 10−11
Ulaiwi W (1997) Marine turtle research and management in Papua New Guinea. In: Noor YR, Lubis IR, Ounsted R, Troeng S, Abdullah A (eds) Proc Workshop Marine Turtle Research and Management in Indonesia. Wet-lands International/ PHPA/ Environment Australia, Bogor, p 111−120
Velez-Zuazo X, Ramos WD, Van Dam RP, Diez CE, Abreu-Grobois FA, McMillan WO (2008) Dispersal, recruitment and migratory behaviour in a hawksbill sea turtle aggre-gation. Mol Ecol 17: 839−853
White D (2006) Marine debris in Northern Territory waters 2004. WWF Australia, Sydney
Whiting SD, Long JL, Coyne MS (2007a) Migration routes and foraging behaviour of olive ridley turtles Lepido -chelys olivacea in northern Australia. Endang Species Res 3: 1−9
Whiting SD, Long JL, Hadden KM, Lauder ADK, Koch AU (2007b) Insights into size, seasonality and biology of a nesting population of the olive ridley turtle in northern Australia. Wildl Res 34: 200−210
Wilcox C, Hardesty BD, Sharples R, Griffin DA, Lawson TJ, Gunn R, Rosenberg A (2013) Ghostnet impacts on glob-ally threatened turtles, a spatial risk analysis for northern Australia. Conserv Lett 1: 1−8
Yokoyama Y, Purcell A, Lambeck K, Johnston P (2001) Shore-line reconstruction around Australia during the last glacial maximum and late glacial stage. Quat Int 83−85: 9−18
Zaykin DV, Pudovkin AI (1993) Two programs to estimate significance of χ2values using pseudo-probability tests. J Hered 84: 152
Zug GR, Chaloupka M, Balazs GH (2006) Age and growth in olive ridley sea turtles (Lepidochelys olivacea) from the North-central Pacific: a skeletochronological analysis. Mar Ecol 26: 1−8
Editorial responsibility: Mark Hamann, Townsville, Queensland, Australia
Submitted: January 9, 2013; Accepted: May 27, 2013 Proofs received from author(s): September 6, 2013
Au
th
o
r
co
p
y
➤
➤
➤
➤
➤
➤
➤
➤
➤
➤
➤
➤
➤