URBAN LAND COVER/USE CHANGE DETECTION USING HIGH RESOLUTION SPOT 5
AND SPOT 6 IMAGES AND URBAN ATLAS NOMENCLATURE
S.S.AKAY a, E.SERTELb
a Istanbul Technical University, Center for Satellite Communication and Remote Sensing, 34669, Istanbul, Turkey -
Istanbul Technical University, Department of Geomatics Engineering, 34669, Istanbul, Turkey - [email protected]
Commission VIII, WG VIII/8
KEY WORDS : Object-Based Classification, Remote Sensing, SPOT-5, SPOT-6, Urban M apping, Urban Change
ABS TRACT:
Urban land cover/use changes like urbanization and urban sprawl have been impacting the urban ecosystems significantly theref ore determination of urban land cover/use changes is an important task to understand trends and status of urban ecosystems, to support urban planning and to aid decision-making for urban-based projects. High resolution satellite images could be used to accurately, periodically and quickly map urban land cover/use and their changes by time.
This paper aims to determine urban land cover/use changes in Gaziantep city centre between 2010 and 2105 using object based images analysis and high resolution SPOT 5 and SPOT 6 images. 2.5 m SPOT 5 image obtained in 5th of June 2010 and 1.5 m SPOT 6 image obtained in 7th of July 2015 were used in this research to precisely determine land changes in five-year period. In addition to satellite images, various ancillary data namely Normalized Difference Vegetation Index (NDVI), Difference Water Index (NDWI) maps, cadastral maps, OpenStreetM aps, road maps and Land Cover maps, were integrated into the classification process to produce high accuracy urban land cover/use maps for these two years. Both images were geometrically corrected to fulfil the 1/10,000 scale geometric accuracy. Decision tree based object oriented classification was applied to identify twenty different urban land cover/use classes defined in European Urban Atlas project. Not only satellite images and satellite image-derived indices but also different thematic map s were integrated into decision tree analysis to create rule sets for accurate mapping of each class. Rule sets of each satellite image for the object based classification involves spectral, spatial and geometric parameter to automatically produ ce urban map of the city centre region. Total area of each class per related year and their changes in five-year period were determined and change trend in terms of class transformation were presented. Classification accuracy assessment was conducted by creating a confusion matrix to illustrate the thematic accuracy of each class.
1. INTRODUCTION
In developing countries, especially for industrial cities, population has been increasing significantly (Angel et al., 2005). In Turkey, the growth of industrial areas has been monitored in many cities. Therefore, population growth is observed in this cities and increase the residential area is similar in other countries. Increase in industrial areas is resulted in increase of population and residential areas (Sertel and Akay, 2015). Land cover/use changes caused by uncontrolled urbanization have negative impacts on ecosystem (e.g. water source, climate, vegetation, soil) (Lambin, 1997). Determination of spatio-temporal distribution of urban land cover/use changes are important information source for urban planners to predict possible future changes in urban patterns and take sustainable urban decision (Dewan et al., 2009, Song et al., 2016). Accurate and fast land cover/use information about cities could be produced by using are remote sensing data and methods.
The European Urban Atlas is a land monitoring service as a component of GM ES (Global M onitoring for Environment and Security) / Copernicus program to create highly detailed urban land use/cover map by using high resolution satellite images (2.5 m or better) as main data source with a scale of 1/10,000. Urban Atlas includes twenty land use/cover classes. Classes have one urban main class with four hierarchical levels of sub-classes and three non-urban classes. The minimum mapping unit (M MU) is 0.25 ha for the artificial surfaces and 1 ha for the other surfaces
(EEA (European Environment Agency)) (Urban Atlas Final Report, 2009).
In this study, we used Urban Atlas nomenclature for urban land
use/cover classes which include classes’ e.g. urban areas with
different densities, industrial, military, fast transit roads, railways, sports and leisure facilities. Land use/cover objects are assigned in detail to classes so classes will be more functional and aid to make decisions developing and regulating urban areas for different type of users.
This study aims to compare changing urban areas with accurate urban land use/cover maps of Gaziantep city centre (total area of
625 km²) in five years. In total, two rule based decision trees were
created for Object based classification of high resolution satellite images which included spectral, geometric and spatial characteristic functions. Sixteen different land cover/use classes (other Urban Atlas classes were not included in city centre) were produced for both of SPOT 5 and SPOT 6 images. Overall accuracy was found as 95.03% with kappa value of 0.940 for 2010 SPOT 5 image and found as 96.27% with kappa value of 0.957 for 2015 SPOT 6 image.
2. S TUDY AREA
Gaziantep city located in the southeast of Turkey, one of the world's oldest residential areas, was selected as the study area.
Gaziantep is at the forefront of Turkey’s developing cities with
industry, commerce and tourism and it is centre of culture and The International Archives of the Photogrammetry, Remote Sensing and Spatial Information Sciences, Volume XLI-B8, 2016
commerce with historic Silk Road. Gaziantep is one of the oldest cities in the world having continuous inhabitation. The study area is approximately 25 km x 25 km and includes Gaziantep city
centre’s residential and industrial areas (Figure 1). Historic Silk Road passes through Gaziantep and hence the city has developed in terms of cultural and trade. Gaziantep is an important economic centre of Turkey with several large industrial businesses and the largest organized industrial area of the country. Population of Gaziantep is over 1.000.000, it is the one
of largest city in Turkey. The population of Gaziantep has monitored a growth of 50,000 yearly, the population census results were 1,700,763 in 2010; 1,753,596 in 2011 and 1,889,466 in 2014 (Sertel and Akay, 2015). Due to the increasing population of Gaziantep, residential and industrial areas have expanded swiftly.
Figure 1. Location of the study area (a) Turkey’s location (b) Gaziantep (c) Location of the study are
3. DATAS ET
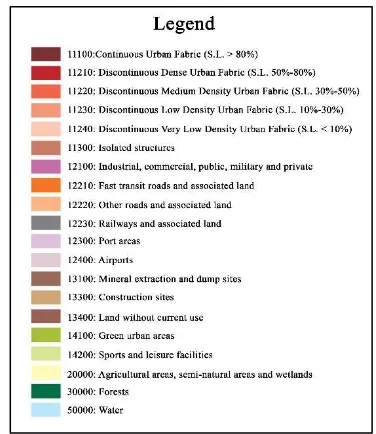
In image selection, 2.5m spatial resolution pan sharpened SPOT -5 image and 1.-5m spatial resolution pan sharpened SPOT 6 image were used as primary earth observation data to produce land cover/use classes. The SPOT 5 images were obtained on 5th of June 2010 and the SPOT 6 images were obtained on 7th of July 2015. The surface objects are classified and identified based on Urban Atlas Project nomenclature. The Urban Atlas Project includes twenty classes with four different hierarchical levels in the classification scheme. Names of these classes are artificial surfaces (code 10000), agricultural, semi natural areas, wetlands (code 20000), forests (code 30000) and water (code 50000). Artificial surface class is divided into seventeen sub-classes. As it can be seen in the Figure 2.
Urban fabric includes continuous (code 11100) and discontinuous (code 11200) in the third level, whilst discontinuous urban fabric separated into four classes (codes 11210-11240) in the fourth level based on the soil sealing value.
Fast transit roads and associated lands (code 12210), other roads and associated lands (code 12220) and railways and associated lands (code 12230) are the sub-classes of Road and rail network and associated land class (code 12200) from the third level. Detailed information about each class can be found in related papers (Seifert, 2009, Urban Atlas Final Report, 2009, M yint et al., 2011).
Gaziantep’s master zoning map of industrial and residential areas
with scale 1:1,000 acquired from Gaziantep M unicipality was
used as ancillary data for segmentation process and assign assigning of classes based on attribute information.
Forest type maps, Open Street M ap, CORINE 2012 map and online maps (e.g. Google Earth, Yandex) were used for training site selection and visual interpretation.
Figure 2. Urban Atlas Land use/cover classes used in the study (Urban Atlas Final Report, 2009, Sertel and Akay, 2015) The International Archives of the Photogrammetry, Remote Sensing and Spatial Information Sciences, Volume XLI-B8, 2016
Fourth levels of discontinuous urban classes based on Soil Sealing Layer from Fast Track Service (Code 11210-11240) and Normalized Difference Vegetation Index (NDVI) images were aided to determine the urban density. Therefore, SPOT 5 NDVI image and SPOT 6 NDVI image were created and added into classifications as a raster layer for each images to classify urban sub-classes.
4. METHODS
4.1 Image Pre-processing
Urban Atlas project has a scale of 1:10,000 with 5 m positional accuracy. In the pre-processing step, each SPOT 5 and SPOT 6 images were orthorectified to remove geometric distortions of images and to match the geometric accuracy of 5m or better. Twenty ground control points were used during orthorectification process and the resulting RM SE values were better than 3m for all points including the total RM SE.
4.2 Classification
Recently, new classification methods for high with resolution images are seen in several researches (Thomas et al. 2003, Herold et al., 2003, Blaschke et al., 2011). Due to the high spatial information contents of very high resolution satellite images , pixel-based classification has begun to be insufficient in many applications since these approaches could not be satisfactorily account for pixel heterogeneity (Thomas et al. 2003). Alternatively, object-based classification considers spectral, spatial and topological relationships resulted in better classification accuracies (Herold et al., 2003). Object based-classification analysis of high-resolution images in urban areas provides to create highly accurate and precise delineation of object boundaries (Blaschke et al., 2011).
Object-based classification has two steps namely segmentation and classification. Segmentation process is employed to identify objects from images using shape, colour, texture characteristics and adjacency of pixels. Furthermore, scale parameter produces to create different size of objects (Benz et al., 2004).
In the classification step, image objects were used to identify Urban Atlas based land use/cover classes with the aid of spectral reflectance of earth objects, indices and several parameters (e.g.
location, length or area parameters). Also, thematic layers, Open Street M ap and master zoning maps were exploited to improve segmentation procedure to ensure better delineation of parcels and roads. These maps also supported to assignment of objects to different land use/cover classes by means of object attributes. In addition, master zoning map s were used to assign artificial surface classes with regulated code number. CORINE data were benefitted to assign forest class according to code number of CORINE forest class in thematic layer (Table 1). Also, forest areas were controlled with forest type maps by visual interpretation process.
Thematic Layer Purpose
M aster Zoning M aps Segmentation/Classification of Artificial Surfaces (1xxx) FTS (SPOT 5 and SPOT 6
NDVI)
Classification of 11000
CORINE 2012 Classification of 30000 OpenStreetM ap Road Data Segmentation
Table 1. Tasks of thematic layers in classification
Segmentation parameters show variability in image segmentation process related to spatial resolution of image and minimum mapping unit. Appropriate segment size of objects was utilized to identify objects according to Urban Atlas project standards. Scale, shape and compactness parameters applied to SPOT 5 and SPOT 6 images can be seen in Table 2. Only the value of the scale parameter was changed for both images due to the different spatial resolution that they have.
Image Scale Shape Compactness
SPOT 5 125 0.4 0.5
SPOT 6 175 0.4 0.5
Table 2. Segmentation parameters for SPOT 5 and SPOT 6 images
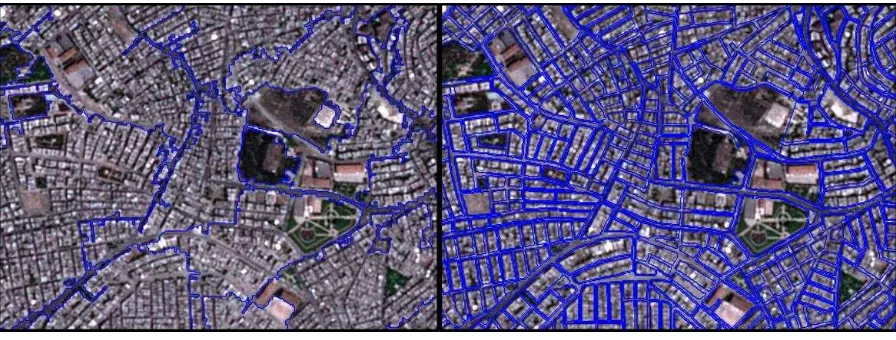
An example of image segmentation result is shown in Figure 3, which includes two segmentations pf the same region one with thematic layer and the other without thematic layer. In segmentation process, scale parameters were chosen considering minimum mapping unit (M M U) standards that could be compatible with Urban Atlas project. Thus, classification process was computed easily.
Figure 3. Shows an example of segmentation results without thematic layer and with thematic layer
After the segmentation process, several functions and indices were used to extract different land use/cover classes. Table 3 presents features, functions and indices applied during the
classification process (eCognition® Developer, Reference Book 2011, Antunes et al., 2003). In both classifications, same functions and indices were used to assign all Urban Atlas classes The International Archives of the Photogrammetry, Remote Sensing and Spatial Information Sciences, Volume XLI-B8, 2016
and same classification steps were used to monitor change detection of land use/cover.
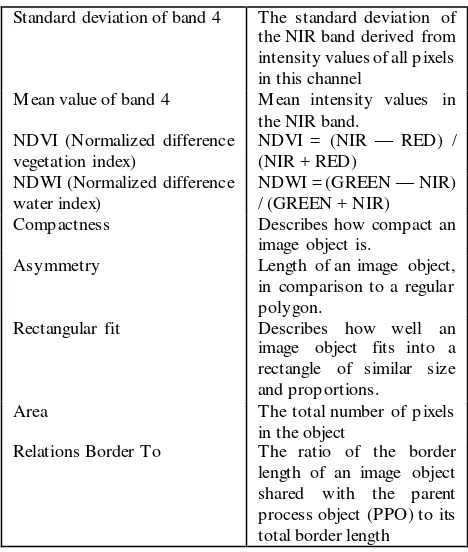
Standard deviation of band 4 The standard deviation of the NIR band derived from intensity values of all pixels in this channel
Compactness Describes how compact an
image object is. Reference Book 2011, Antunes et al., 2003)
Normalized Difference Water Index (NDWI) was used to classify water and non-water areas in study area. NDWI value was found 0.18 as a threshold to classify water bodies in SPOT 5 image while 0.12 as a threshold to classify water bodies in SPOT 6 image. Therefore, the segments having NDWI value that were above the limit values were assigned to water class (code 50000).
Open Street maps road data which included roads and railway roads obtained in vector format were integrated into the segmentation process as a thematic layer to clearly identify road and rail network (code 12200) and its sub-classes (code 12230). Several functions were used to detect roads and associated land (code 12220) and distinguish from other classes, which are
“rectangular fit”, “compactness”, “relation border to”, “area” and “asymmetry” functions. Limit values for these functions vary for SPOT 5 and SPOT 6 images. After classification of road and rail network and associated land class, sub-classes of road class which are fast transit roads and associated land (code 12210) and
other roads and associated land (code 12220) were classified with visual interpretation process from road classes.
In addition to “Relation border to” and “area” functions, standard
deviation values in blue band, NDVI and blue band value were also employed to classify several other classes. Limit values for these functions were determined experimentally and varied for each class in SPOT 5 and SPOT 6 images. Although urban built -up areas and industrial areas were generally distinguished with these functions, in some region of the study area, urban areas and industrial areas were seen as nested objects where these were mixed with each other because of having similar values. Same problem was experienced between mineral extraction - dumpsites class and construction sites class. Thus, these functions were operated on selected regional areas rather than whole images with determined threshold values. In addition to classify objects with different functions and thresholds, visual interpretation process was also used to assign objects to classes in some cases.
Green urban areas, sports and leisure facilities areas were assigned with NDVI value in urban areas and visual interpretation. After the classification of forest areas, remaining green areas could be a candidate for park and sports areas classes in the city centre. Green areas were classified using their neighbourhood to city centre by using the ground truth obtained from online maps such as Google Earth.
Urban sub-classes were classified based on different soil sealing level as illustrated in Urban Atlas mapping guide to accurately map class 11100, 11200 and sub-classes of 11200. Urban classes having 80% or bigger soil sealing values were classified as continuous urban fabric (11100). This class mostly includes buildings, road and paved areas. As it can be seen in Figure 4, this class is the biggest urban class and covers more areas in Gaziantep city centre illustrating that city centre is very densely covered by impervious artificial surfaces. Urban class with soil sealing values between 10% and 80% was used to classify discontinuous urban fabric (11200). Sub-classes of discontinuous urban fabric are 11210, 11220, 11230 and 11240 with sealing layer values of 50-80%, 30-50% 10-30% and 0-10%, respectively.
At the last stage, accuracy assessment of the classifications were conducted to evaluate the quality of land use/cover classifications per class base. Two confusion matrixes including overall
accuracy, user’s and producer’s accuracy were created using reference points distributed randomly to check the accuracy of the proposed methodology for both SPOT 5 and SPOT 6 classifications.
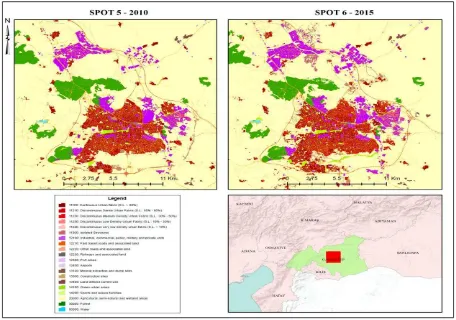
Figure 4. City centre map of Gaziantep city for 2010 and 2015 years
5. RES ULTS AND DIS CUS S IONS
In this study, land use/cover maps (Urban Atlas) of Gaziantep city centre with an area of 625 km2 were created for 2010 and 2015 by using object-based classification by means of SPOT 5 and SPOT 6 images and auxiliary data. This area aimed to conduct detailed change detection analysis for different urban land classes. Two decision tree algorithms were created for 2010 dated SPOT 5 and 2015 dated SPOT 6 images to accurately map different urban classes during the object based image classification stage.
At the last stage, 1,690 reference points were used for the accuracy assessment of each classification obtained from SPOT images. Table 4 summarizes the classification accuracy values of each classes for SPOT 5 and SPOT 6 images. Results of SPOT 5
classification’s accuracy assessment shows an overall accuracy
of 95.03% with a kappa value of 0.940. Overall accuracy of urban areas is 95.14% with a kappa value of 0.933, in addition overall accuracy of rural areas is 97.00 % with a kappa value of 0.942.
Also, each class has 90% or better user’s and producer’s accuracy
values for SPOT 5 image. Whereas, results of SPOT 6 image
classification’s accuracy assessment illustrate overall accuracy of
96.27% with a kappa value of 0.957. Overall accuracy of urban areas is 96.27% with a kappa value of 0.954, in addition overall
accuracy of rural areas is 97.66 % with a kappa value of 0.955.
Each class has 91% or better user’s and producer’s accuracy
values.
In accordance with results of classifications, artificial surface areas were showed an increase of approximately 3% and especially construction sites were almost doubled from 0.486 to 0.854 km2 areas between 2010 and 2015. Besides, total area of forest areas and agricultural, semi-natural and wetland areas decreased in this period. Percentage of agricultural, semi-natural and wetland areas were 77.2% in 2010 and 74.5% in 2015. Forest areas were computed as 0.31 km2 and its percentage is 4.9% of city centre in 2010. However, forest areas were found as 0.29 km2 and its percentage is 4.7% of city centre in 2015.
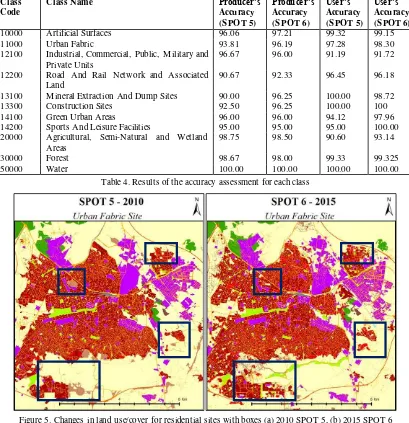
Urban density map includes continuous urban fabric and three different discontinuous urban fabrics sub-classes. Percentage of urban areas were 6% with a total area of 0.39 km2 in 2010 and it increased in five years with almost 0.05 km2 so, percentage of urban areas was 7% with a total area of 0.44 km2 in 2015. Also, visual interpretation was elaborated on nearby urban areas, where land use/cover changes from construction sites areas to urban areas or vice versa were observed in five-year period. In few years, constructions will be completed and city centre will be occupied with new urban areas (Figure5).
Class Code
Class Name Producer’s
Accuracy (S POT 5)
Producer’s Accuracy (S POT 6)
User’s Accuracy (S POT 5)
User’s Accuracy (S POT 6)
10000 Artificial Surfaces 96.06 97.21 99.32 99.15
11000 Urban Fabric 93.81 96.19 97.28 98.30
12100 Industrial, Commercial, Public, M ilitary and Private Units
96.67 96.00 91.19 91.72
12200 Road And Rail Network and Associated Land
90.67 92.33 96.45 96.18
13100 M ineral Extraction And Dump Sites 90.00 96.25 100.00 98.72
13300 Construction Sites 92.50 96.25 100.00 100
14100 Green Urban Areas 96.00 96.00 94.12 97.96
14200 Sports And Leisure Facilities 95.00 95.00 95.00 100.00
20000 Agricultural, Semi-Natural and Wetland Areas
98.75 98.50 90.60 93.14
30000 Forest 98.67 98.00 99.33 99.325
50000 Water 100.00 100.00 100.00 100.00
Table 4. Results of the accuracy assessment for each class
Figure 5. Changes in land use/cover for residential sites with boxes (a) 2010 SPOT 5, (b) 2015 SPOT 6
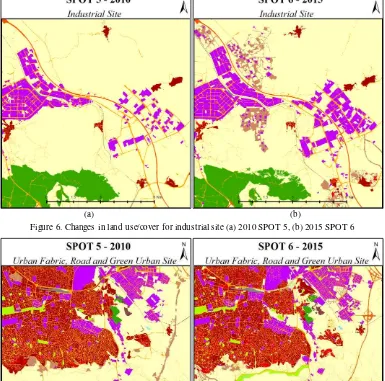
Gaziantep is the one of the major cities of Turkey in industrial sector, which was also impacted land cover/use changes within the city. Total area of Industrial areas was 0.28 km2 in 2010 but 0.34 km2 in 2015 showing an increase of 21%. New industrial sites have been established in the north of the city centre within five years (Figure 6).
The total areas of water class, mineral extraction and dumpsites class remained almost same in five years. Green urban areas increased 0.0189 km2 between 2010 and 2015 resulted in enrichment of green urban areas in the city centre. Classification analysis illustrated that number of green parks were increased in the city centre. Also, changes were observed from construction sites to road or industrial areas in five years illustrating the complement of new line of communications (Figure 7). The International Archives of the Photogrammetry, Remote Sensing and Spatial Information Sciences, Volume XLI-B8, 2016
(a) (b)
Figure 6. Changes in land use/cover for industrial site (a) 2010 SPOT 5, (b) 2015 SPOT 6
(a) (b)
Figure 7. Changes in land use/cover for roads and green urban sites (a) 2010 SPOT 5, (b) 2015 SPOT 6
6. CONCLUS ION
This study proposed to use of different decision trees including different satellite based indices, spatial, spectral and topological features for the object based classification of very high resolution SPOT 5 and SPOT 6 images in order to accurately map urban land cover/use classes and their changes by time. Integrated usage of SPOT 5 and SPOT 6 with auxiliary data (thematic maps, master zone maps etc.) for object-based classification provides and important urban land cover/use information extraction approach that fulfils geometric and thematic requirements of 1/10.000 scale Urban Atlas project.
In object based classification process, appropriate parameter and function selection is a significant task to accurately and rapidly classify satellite images. Compactness, Asymmetry, Rectangular fit, Area and Relations Border To functions provided valuabl e results to identify different land cover/use classes. Also,
integration of thematic layers improved the segmentation process with better delineation of object boundaries (e.g. OSM data, CORINE data, master zoning maps). Satellite image derived NDVI and NDWI indices and their thresholding facilitate the identification of water and green classes.
M ulti-temporal high-resolution urban maps could be satisfactorily used to analyse spatial distribution of land class changes. Direction of sprawl of residential areas, commercial and industrial sites in the city centre could be easily observed by using these maps. M oreover, high-resolution urban maps could be used to support master planning, monitor transportation infrastructures, generate location based services and support of street navigation. City planners could use these maps to make decision about expanding i.e. direction, general needs. Also, future of Gaziantep city is estimated so planned urbanization will be made by municipality.
REFERENCES
Angel, S., Sheppard S., Civco D., Buckley R., Chabaeva A., Gitlin L., Kraley A., Parent J., Perlin M ., 2005. The Dynamics of Global Urban Expansion. Transport and Urban Development
Department the World Bank. Washington DC: The World Bank.
Antunes F., Lingnau C., Da Silva J., 2003. Object oriented analysis and semantic network for high resolution image classification. Anais XI SBSR, Belo Horizonte, INPE, p. 273-279.
Benz, U.C., Hofmann, P., Willhauck, G., Lingenfelder, I., Heynen, M ., 2004. M ulti-resolution, object-oriented fuzzy analysis of remote sensing data for GIS-ready information.
ISPRS Journal of Photogrammetry and Remote Sensing 58,
239-258.
Blaschke, T., Hay, G.J., Weng, Q., Resch, B., 2011. Collective sensing: integrating geospatial technologies to understand urban systems —An Overview. Remote Sensing 3, 1743-1776.
Dewan, A.M ., Yamaguchi, Y., 2009. Land use and land cover change in Greater Dhaka, Bangladesh: Using remote sensing to promote sustainable urbanization. Applied Geography 29, 390-401.
Herold M ., Liu X., Clarke K. C., 2003. Spatial metrics and image texture for mapping urban land use. Photogrammetric Engineering & Remote Sensing Vol. 69, No. 9, pp. 991–1001.
Lambin, E.F., 1997. M odelling and monitoring land-cover change processes in tropical regions. Progress in Physical Geography 21(3): 375-393
M yint, S.W., Gober, P., Brazel, A., Grossman-Clarke, S., Weng, Q., 2011. Per-pixel vs. object-based classification of urban land cover extraction using high spatial resolution imagery. Remote Sensing of Environment 115, 1145-1161.
Seifert, F. M . 2009. Improving Urban M onitoring Toward a European Urban Atlas. Global Mapping of Human Settlement: Experiences, Datasets and Prospects Chapter 11: Taylor and Francis Group.
Sertel E., Akay S.S., 2015. High resolution mapping of urban areas using spot-5 images and ancillary data. International Journal of Environment and Geoinformatics, 2(2), 63-76.
Song, X.-P., Sexton, J.O., Huang, C., Channan, S., Townshend, J.R., 2016. Characterizing the magnitude, timing and duration of urban growth from time series of Landsat-based estimates of impervious cover. Remote Sensing of Environment 175, 1-13.
Thomas N., Hendrix C., Congalton R. G.., 2003. A comparison of urban mapping methods using high-resolution digital imagery. Photogrammetric Engineering & Remote Sensing, Vol. 69, No. 9, pp. 963–972.
Trimble, 2011. eCognition® Developer 8.64.1, Reference Book
Urban Atlas Final Report. Urban Atlas Delivery of Land Use/Cover M aps of M ajor European Urban Agglomerations . Available online: http://ec.europa.eu/regional_policy/tender/pdf/ 2012066/urban_atlas_final_report_112011.pdf (accessed on 25 February 2016)