Estimating and Fusing Optical Flow, Geostrophic Currents and Sea Surface Wind in the
Waters around Kish Island
Emad. Ghalenoei1*, Mohammad. Ali. Sharifi2, Mahdi. Hasanlou3
1* Geodesy Engineering, Surveying and Geomatics Engineering Dept, College of Engineering, University of Tehran, Tehran, Iran. [email protected]
2 Assistant Professor, Surveying and Geomatics Engineering Dept, College of Engineering, University of Tehran, Tehran, Iran. sharifi @ut.ac.ir
3 Associate Professor, Surveying and Geomatics Engineering Dept, College of Engineering, University of Tehran, Tehran, Iran. [email protected]
KEY WORDS: Sea surface currents, Optical flow, Geostrophic currents, Sea surface wind, Fused surface currents.
ABSTRACT:
The aim of this study is calculation of sea surface currents (SSCs) which are estimated from satellite data sets and processed with the variance component estimation (VCE) algorithm to check role of each data set, in fused surface currents (FSCs). The satellite data used in this study are sea surface temperature (SST), satellite altimetry data and sea surface wind (SSW) that plays the important role to make the SSCs and is measured by Ascat satellite. We use optical flow (OF) method (Horn-Schunck algorithm) to extract sea surface movements from sequential SST imageries; in addition, geostrophic currents (GCs) are estimated by satellite altimetry data like sea surface height (SSH). Combining these data sets, has its pros and cons, the OF results are so dense and precise due to high spatial resolution of MODIS data (SST), but sometimes cloud covering over the sea, does not allow the MODIS sensor to measure the SST. In contrast the SST data, the altimetry data have poor spatial resolution and the GCs are not able to determine small scale SSCs. The VCE algorithm shows variances of our data sets and it can be shown their correlations with themselves and with the FSCs. We also calculate angular differences between FSCs and OF, GCs and SSW, and plot distributions of these angular differences. We discover that, the OF and SSW are homolographic, but OF and GCs are accordant to each other.
1. INTRODUCTION
Sea surface currents (SSCs) are one of the most prominent problems in motional events which pervious limitation of SSCs are caused by limitation according to spatial and temporal observations (in situ and remote sensing (Vignudelli et al., 2011)). Todays, by promotion of satellite observations and images, process of extracting SSCs is performed by computer programing based on physical and mathematical equations procedure. Researchers want to answer this question regard to SSC, how much estimated SSCs are near to real SSCs according to spatial positions (Fleet and Weiss, 2005; Bowditch, 2012). The SSCs include different parts that have their own special names, water in motion is called a current; the direction toward that it moves is called set, and its speed is called draft (Bowditch, 2012).
Circulations of ocean are usually divided into two parts; first, a wind-driven circulation which dominates in upper layers and second, a density-driven circulation which dominates below (Aken, 2007). Motions of upper layers because of their directions try to invest about SSCs directions. It is an useful application to determine climate change, as conditions on borders of oceans for atmospheric models (Reynolds and Smith, 1994) and SST imageries, altimetry data and ocean color data can be used at the same time for depicting sea surface currents (SSCs) and other their events like vortex structures in the sea and ocean (Cohen and Herlin, 1996).
Wind force and difference in water density can be the most prominent reasons of SSCs creation, but there are other factors that change in SSCs such as depth of water, underwater topography, the size of the land and its location and deflection by rotation of the earth (Bowditch, 2012).
In this paper, we divide our computations into three parts. The first: tracing of sea surface temperature (SST). The SST is not reason for creation of SSCs but, by tracking the SST patterns
with optical flow (OF) methods, we extract sea surface patterns motion, because the SSCs influence on SST patterns (Martin Gade, 2012), (Cohen and Herlin, 1996), (M. Hasanlou and M. R. Saradjian, 2006), (Jin et al., 2001) . The second: computation of the geostrophic currents (GCs) by balance between Coriolis force and horizontal pressure gradients (Stewart, 2009), (Vignudelli et al., 2011). This part is calculated from altimetry data set. The third: sea surface wind (SSW). This factor is principal reason of the SSCs creation particularly in shallow water (Zonn et al., 2010), (Dawe and Thompson, 2006). Each of these three data sets, finally, produces particular vectors that include direction, magnitude and geographical coordinates. The main goal of this study is calculation of the fused surface currents (FSCs) by combining these three data sets. For example, in low depth regions, the SSW is chief factor for creation of SSCs (Zonn et al., 2010) and GCs may not have enough accuracy in low depth regions (Mathilde Cancet et al., 2009) and on the other side cloud covering over the sea, does not allow the MODIS sensor to measure the SST (Brian B. Barnes, 2013). So in this area, fusing of these sets of vectors makes SSCs more reliable.
The main earlier studies about SSCs refer to SST tracking and intricacy of SSCs is shown by SST patterns and some events like El-Niño can be foretold by large scale SST anomalies in crucial oceanic regions (Park and Chung, 1999), (Minnett et al., 2004), (M. Hasanlou and M. R. Saradjian, 2006). To study SST imagery, we use MODIS SST products in this paper. MODIS data include ocean color and SST for oceanographic tasks (Minnett et al., 2004). We determine The SSCs from SST imageries by applying OF method. This method has a head aim that is calculation of image intensity movement from sequential imageries. Horn and Schunck is one of the most useful OF methods which we use in this study (Horn and Schunck, 1981). The second part of this study connects to altimetry data and GCs. The distance of satellite and the surface of ocean is The International Archives of the Photogrammetry, Remote Sensing and Spatial Information Sciences, Volume XL-1/W5, 2015
computed by Radar altimetry. After obtaining altimetry data from multi missions (e.g. Envisat, Jason-1 and Jason-2), sea surface height (SSH) grids are produced. SSH products are supplied by satellite altimetry due to global-scale measurements that these products have high spatial and temporal resolutions and they have big influence on different and dynamical studies (Zhang and Sun, 2012). One of the most prominent task about SSH fields is extracting of GCs (Deng et al., 2011). Absolute dynamic topography (ADT) is one of the SSH products that is difference between SSH and geoid (AVISO, 2012). At last, we estimate GCs according to ADT. The GCs connect to within the oceans and far from the top and bottom Ekman layers, two forces exactly balance each other for long distance and for a specific times, they are; horizontal pressure gradients and Coriolis force. This balance is known as the geostrophic balance (Stewart, 2009).
Third part of this study is SSW. A powerfully reason for motion of a surface of the layer is the SSW (Bowditch, 2012). Wind force extracted from satellite data naturally explains for the moving ocean (Dawe and Thompson, 2006). We downloaded The SSW data from ascat satellite in this study.
In earlier studies, correlation of these data is examined and compared with them, but in this study, the purpose is to obtain the FSCs that effect of each data set of vectors (OF, GCs and SSW) is distinct. So for that, we use variance component estimation (VCE) algorithm. The VCE calculates different levels of variance of observations and these levels are connected to variances for multiple sets of observations (Hermann Bähr, 2007). Here, sets of measurements are three data sets of vectors that are determined from SST, satellite altimetry and SSW data. After fusing operation, we plot normal and bimodal distributions for angular differences between FSCs and these data sets. Discussion about correlation of these distributions is one the most important parts in this paper.
2. PROPOSED METHODS
2.1 Optical Flow
The point of using optical flow (OF) is near estimation of movement in two dimensions (Barron et al., 1994). Value of
image’s pixel at the point , in the image at time be signed by � , , . It estimates particular patterns of pixels when they are in motion. The value of a particular point in the pattern is constant, so that (Horn and Schunck, 1981)
��
� = . (Horn and Schunck, 1981) (1)
In this paper, we used Horn-Schunck algorithm to determine OF. there is a smoothness condition to solve the OF which is very suitable for calculating SSCs. Equation of flow that is shown by E, is such as a global energy functional which is tried to be minimized (Horn and Schunck, 1981).
E = ∬[ I u + I v + It + α ‖∇u‖ + ‖∇v‖ ] dx dy (2) Where I , I and It are the derivatives of image values along
, and time dimensions respectively, u and v are OF result and the parameter α is a constant for regularization. If α is increased, the flows are smoother (Horn and Schunck, 1981).
2.2 Geostrophic Balance
Geostrophic currents are connected to surface slope. Sea surface topography � is sea surface height (SSH) relative to a level surface such as the geoid. The geoid is constant in time (Stewart, 2009). AVISO supplies altimetry data from Jason-1, Jason-2 and Envisat missions (AVISO, 2012). We interpolated
SSH data by thin plate spline (TPS) algorithm and it made regular SSH grids. The TPS can be used to produce precise sea surface topography maps from satellite altimetry data (Sandwell, 1987). In two dimensional cases TPS is truly steady since the distribution of data is not too erratic (Sandwell, 1987). We calculate Absolute dynamic topography (ADT) from removing geoid effect from SSH. The components of GCs are:
= − ����� ; = ����� (3)
Where ��� is absolute dynamic topography, and are along of Cartesian coordinate system, is gravity acceleration and is Coriolis parameter which is = Ω sin �, Ω is earth’s geographical coordinates of centres and magnitude. So we computed the value of an angle which is made between each vector and positive side of x-axis by Arctan function. Then, values of sinus and cosines of these angles are computed. We performed fusing operation once for sinus values and once for cosines values singly. This operation is fitting polynomials to these values of sinus and cosine singly by two different resolution (L), but the second has high spatial resolution (H), so L has less influence on fused currents. Thus, quantity of vectors has important influence on fused currents. Thereupon these vectors should be interpolated until have same spatial resolution. In this paper, the SSW has lower spatial resolution relative to other data sets (OF and GCs).
2.4 Variance Component Estimation (VCE)
Variance component estimation can identify value of effect for each set of measurements (OF, GC and SSW).
In this study, we use the VCE by degree of freedom, in other word, if the stochastic model is of block diagonal structure, variances for each set of observations can become different in algebraic form (Hermann Bähr, 2007):
̂σ�,�= ��,�= �
�� � �
��− � �− ������� , ∀� = … �
(5)
Where ̂σ�,� is variance elements of �ℎ set of observations, � is element of (residuals), be suitable to the �ℎ set of observations, �� is �ℎ element of weight matrix (�), �� is size of �ℎ set of observations, �� is a part of � (design matrix) and
� is normal equation matrix (Hermann Bähr, 2007).
3. STUDY AREA & DATA SETS
3.1 The Kish Island
The Kish Island (26.25º to 26.70º N and 53.5º to 54.5º E) is a 91.5 square kilometre popular island in the Persian Gulf. It is
part of the Hormozgān Province of Iran. Kish's climate is thought to be a very dry semi equatorial climate and the annual temperature is 26.6 °C (“Kish Island, Iran,” 2015).
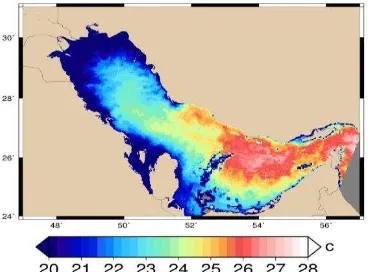
3.2 The SST imagery
If value of point in images is SST, the OF method can trace temperature patterns. This method leads us to identify surface temperature motions. We downloaded The SST products from NASA website (the National Aeronautics and Space Administration). These products are gridded and theirs resolution are 0.01º × 0.01º longitude and latitude (“MODIS
Web,” 2013).
To determine the SSCs from the SST, it requires one or more pair/successive imageries. The SST imageries supplied from Moderate Resolution Imaging Spectroradiometer (MODIS) sensor which is boarded on Terra and Aqua satellites. Aqua and Terra are ascending orbit satellite and descending orbit satellite respectively and they are known to afternoon satellite and morning satellite respectively. The revisit cycle of these satellites is 12 hours. Time period of two images from Aqua to Terra or inverse is nearly 6 hours. Then finding these images with minimum time distance are very suitable for extracting SSCs. In this paper, we used two sequential SST imageries (Figures 1 and 2).
Figure 1. SST image in 28 Dec 2010, 22:50
Figure 2. SST image in 29 Dec 2010, 09:50
3.3 Altimetry Data
The altimetry data used in this study are SSH data that are corrected and adapted by Archiving, Validation, and Interpretation of Satellite Oceanographic Data (AVISO), in France (AVISO, 2012). These data are known as CorrSSH data. Here, we used altimetry data from multi-missions which are Jason-1, Jason-2 and Envisat at the same time. The SST time is an influential filter for choosing time of altimetry data. In other word, we collected altimetry data in 2 days before and 2 days after time of SST imagery. Altimetry tracks obtained for this time span and are shown in figure 3. The TPS algorithm interpolates between altimetry tracks. By incorporating tracks, we made regular grids of SSH.
Figure 3. altimetry tracks in 26 until 30 Dec 2010
3.4 Sea Surface Wind
The most intense cause for creation SSCs is wind (Bowditch, 2012). It depends on water depth, in other words, in shallow water, major SSCs have same directions to sea surface wind. In this study, we used remote sensing information of Ascat satellite to access surface wind data.
The first Advanced Scatterometer (ASCAT) launched on the EUMETSAT MetOp-A satellite in 2006. It became completely operational in May 2007 and goes on to act today.
Ascat products are daily and time averaged like 3-day, weekly and monthly, binary data files. A grid of 0.25 degree that these data mapped on it, is available (“ASCAT,” 2015). Wind direction data are calculated 10 meters above sea surface
(“ASCAT,” 2015).
4. RESULTS
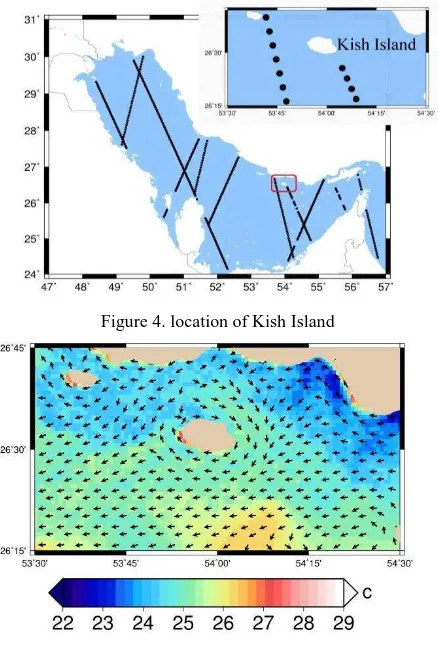
The first step for fusing procedure is to make these three vector sets (OF, GCs and SSW) same spatial resolution. SSW has poor spatial resolution that is 0.25 degree, spatial resolutions of OF and GCs are nearly 0.03 degree, so SSW must be interpolated until all of them have a same spatial resolution. Figure 4 shows the Kish Island and altimetry tracks which are passed by missions. Figure 5 shows OF results which are mapped on SST, this figure shows an eddy around Kish Island that GCs and SSW cannot show it. Thus, advantage of OF in extracting small scale events is proved.
Vectors of OF, GCs (figure 6) and SSW (figure 7) are separated into sinus and cosine parts and for each of them a component is estimated by using equation 4, then these FSCs are shown in figure 8.
Figure 4. location of Kish Island
Figure 5. OF plotted on SST in 29 Dec 2010
Figure 6. GCs plotted on ADT
Figure 7. Average of SSW vectors plotted on SSW speed in 27 until 29 Dec 2010
We decomposed sea surface around the Kish Island into 9 zones, e.g., West North (1), North (2), East North (3), West (4), central place (5), East (6), West South (7), South (8) and East South (9). Average of angular differences between FSCs and three data sets are calculated in each zone. These averages are available in table 1-b, c, d. Results of VCE are attainable in table 1-a.
Mean angular differences between (OF, GCs and SSW) and FSCs are respectively 55.30º, 70.84º and -30.52º.
There is a good uniformity between OF (figure 5) and SSW (figure 6) and both their vectors have same directions in southern Kish Island (it means zones of 7, 8 and 9). In zones of 7, 8 and 9 (southern the Kish Island), figure 10-b also shows both blue (OF) and black (SSW) lines are almost equal. If GCs are divided into two components of sinus and cosine, it is clear that sinus components of GCs and SSW are uniform and they both are toward south (figures 6 and 7), to prove that, we used the VCE algorithm to determine estimated weight or inverse of estimated variance. In table 1-a effects of each vector sets in creation of FSCs are declared. Effects of sinus components of GSs and SSW are larger. It means GCs and SSW have good uniformity in southern Kish Island, but in cosine components, effects of OF and SSW are major.
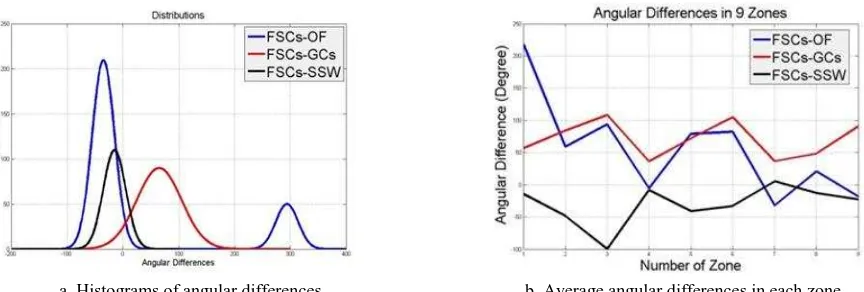
According to table 1-b, c, d, all of these have minimum angular differences with FSCs in the southern Kish Island and in other words they have minimum angular differences with each other. In figures 9, we plotted angular differences histograms. They overlapped each other in figure 10-a that shows OF and SSW both have maximum frequency of zero value in angular differences with FSCs that also this graph is another proof in uniformity and correlation of OF and SSW. Figure 10-b shows blue lines (OF) and black lines (SSW) are approximately homolographic with relation to FSCs which are horizontal axis that shows zero.
Figure 8. FSCs plotted on GCs speed The International Archives of the Photogrammetry, Remote Sensing and Spatial Information Sciences, Volume XL-1/W5, 2015
a. Between OF and FSCs b. Between GCs and FSCs c. Between SSW and FSCs Figure 9. Normal and bimodal histograms and distributions for angular differences between FSCs and OF, GCs and SSW
a. Histograms of angular differences b. Average angular differences in each zone Figure 10. The blue, red and black lines are respectively about angular differences between OF, GCs and SSW with FSCs
Table 1
Tables b, c and d are respectively Angular differences between FSCs and OF, GCs and SSW (in degree)
(a) Results of VCE OF
GCs SSW
Effect of cosine term on FSCs ( �� �����) 03.42
01.30 03.62
Effect of sinus term on FSCs ( �� �����) 03.78
08.21 56.61
(b) FSCs-OF (c) FSCs-GCs (d) FSCs-SSW
217.98 59.11
93.89
-5.48
79.09
82.31
-32.02 21.02 -18.17
56.88
84.06
108.18
36.34
71.86
104.91
36.50
48.41
90.46
-14.41
-48.36 -99.92
-8.08
-40.79 -32.77
5.32
-12.98 -22.69
5. CONCLUSION
Sea surface currents rely on many factors on water. Sea surface wind (SSW), geostrophic currents (GCs) and extracted optical flow (OF) from SST imageries are parts of these factors. In this regards, fusing surface currents is very applicable to make SSCs which are near to real water movements. In this study, The SSW, GCs and OF were our measurements and observations and we divided them into sinus and cosine terms. The mathematical model for fitting to measurements is fourth degree polynomials. The VCE results declared effects of them on the FSCs. Histograms and distributions of angular differences
between measurements (OF, GCs and SSW) and FSCs figured out correlation among OF and SSW. In southern Kish Island all of OF, GCs and SSW have good uniformity, but OF is better to extract small scale events like eddy that is revealed around Kish Island. The zones of 7, 8 and 9 are the best locations to find OF, GCs and SSW with same directions. These zones referred to the southern Kish Island. All of the figures showed that major FSCs were orderly made by major SSW, OF and GCs sequentially. Also, OF and GCs were close to each other with relation to FSCs but OF and SSW are homolographic, it means FSCs were between OF and SSW.
6. REFERENCES
Aken, H.M. van, 2007. The Oceanic Thermohaline Circulation: An Introduction. Springer Science & Business Media. ASCAT [WWW Document], 2015. . Remote Sens. Syst. URL
Bowditch, N., 2012. The American Practical Navigator. CreateSpace Independent Publishing Platform. Brian B. Barnes, C.H., 2013. A Hybrid Cloud Detection
Algorithm to Improve MODIS Sea Surface Temperature Data Quality and Coverage Over the Eastern Gulf of Mexico. IEEE Trans. Geosci. Remote
Sens. 51, 3273–3285.
Springer Berlin Heidelberg, pp. 141–150.
Dawe, J.T., Thompson, L., 2006. Effect of ocean surface Satellite Altimetry for Geodetic, Oceanographic, and Climate Studies in the Australian Region, in: Vignudelli, S., Kostianoy, A.G., Cipollini, P., Benveniste, J. (Eds.), Coastal Altimetry. Springer Berlin Heidelberg, pp. 473–508.
Fleet, D.J., Weiss, Y., 2005. Optical Flow Estimation.
Hermann Bähr, Z.A., 2007. Variance Component Estimation for Combination of Terrestrial Reference Frames. Horn, B.K., Schunck, B.G., 1981. Determining Optical Flow.
pp. 319–331. doi:10.1117/12.965761
Jin, F., Khellah, F.M., Fieguth, P.W., Winger, L., 2001. Motion estimation of sparse, remotely-sensed fields, in: Canadian Conference on Electrical and Computer Engineering, 2001. Presented at the Canadian Conference on Electrical and Computer Engineering,
2001, pp. 1135–1138 vol.2.
doi:10.1109/CCECE.2001.933601 Kish Island, Iran, 2015. . Wikipedia Free Encycl.
Martin Gade, B.S., 2012. Mesoscale surface current fields in the Baltic Sea derived from multi-sensor satellite data. Int. J. Remote Sens. 33, 3122–3146. doi:10.1080/01431161.2011.628711
Mathilde Cancet, F.B., Birol, Roblou, Langlais, 2009. CTOH regional altimetry products: examples of applications. Presented at the OceanObs.
M. Hasanlou, M. R. Saradjian, 2006. Water Motion Analysis in Sst Images Using Least Squares Methods. ISPRS. Minnett, P.J., Brown, O.B., Evans, R.H., Key, E.L., Kearns,
E.J., Kilpatrick, K., Kumar, A., Maillet, K.A., Szczodrak, G., 2004. Sea-surface temperature measurements from the Moderate-Resolution Imaging Spectroradiometer (MODIS) on Aqua and Terra, in: Geoscience and Remote Sensing Symposium, 2004.
IGARSS ’04. Proceedings. 2004 IEEE International.
Presented at the Geoscience and Remote Sensing
Symposium, 2004. IGARSS ’04. Proceedings. 2004
IEEE International, pp. 4576–4579 vol.7. Variations of Sea Surface Temperature in the East Sea Using NOAA/AVHRR Data. J. Oceanogr. 55, 271– 288. doi:10.1023/A:1007872709494
Reynolds, R.W., Smith, T.M., 1994. Improved Global Sea Surface Temperature Analyses Using Optimum Interpolation. J. Clim. 7, 929–948. doi:10.1175/1520-0442(1994)007<0929:IGSSTA>2.0.CO;2
Sandwell, D.T., 1987. Biharmonic spline interpolation of GEOS3 and SEASAT altimeter data. Geophys. Res. Lett. - GEOPHYS RES LETT 14, 139–142. doi:10.1029/GL014i002p00139
Stewart, R.H., 2009. Introduction to Physical Oceanography. Orange Grove Texts Plus, College Station, Tex. Vignudelli, S., Kostianoy, A.G., Cipollini, P., Benveniste, J.
(Eds.), 2011. Coastal Altimetry. Springer Berlin Heidelberg, Berlin, Heidelberg.
Zhang, L., Sun, C., 2012. A geostrophic empirical mode based on altimetric sea surface height. Sci. China Earth Sci. 55, 1193–1205. doi:10.1007/s11430-011-4293-z Zonn, 2S., Kosarev, A.N., Glantz, M., Kostianoy, A.G., 2010.
The Caspian Sea Encyclopedia, 2010 edition. ed. Springer, Berlin; London.