FOREST CLIMATE CHANGE VULNERABILITY AND ADAPTATION
ASSESSMENT IN HIMALAYAS
V.S. Chitalea*, H. L. Shresthaa, N. K. Agrawala, D. Choudhurya, H. Gilania, H. K. Dhonjua, M. S. R. Murthya
a International Centre for Integrated Mountain Development (ICIMOD), GPO 3226, Khumaltar, Nepal vishwas.chitale*, himlal.shreshta, nandkishor.agrawal, dhrupad.choudhury,
hammad.gilani, harikrishna.dhonju, manchiraju.murthy @icimod.org *Corresponding author
KEY WORDS: Climate change, mitigation and adaptation, Geospatial tools, Climatic warming, MODIS, Bioclim
ABSTRACT:
Forests offer an important basis for creating and safeguarding more climate-resilient communities over Hindu Kush Himalayan region. The forest ecosystem vulnerability assessment to climate change and developing knowledge base to identify and support relevant adaptation strategies is realized as an urgent need. The multi scale adaptation strategies portray increasing complexity with the increasing levels in terms of data requirements, vulnerability understanding and decision making to choose a particular adaptation strategy. We present here how such complexities could be addressed and adaptation decisions could be either directly supported by open source remote sensing based forestry products or geospatial analysis and modelled products. The forest vulnerability assessment under climate change scenario coupled with increasing forest social dependence was studied using IPCC Landscape scale Vulnerability framework in Chitwan-Annapurna Landscape (CHAL) situated in Nepal. Around twenty layers of geospatial information on climate, forest biophysical and forest social dependence data was used to assess forest vulnerability and associated adaptation needs using self-learning decision tree based approaches. The increase in forest fires, evapotranspiration and reduction in productivity over changing climate scenario was observed. The adaptation measures on enhancing productivity, improving resilience, reducing or avoiding pressure with spatial specificity are identified to support suitable decision making. The study provides spatial analytical framework to evaluate multitude of parameters to understand vulnerabilities and assess scope for alternative adaptation strategies with spatial explicitness.
1. INTRODUCTION
1.1 Climate Change in the Himalayas
The Himalayas extends over 3000 kilometres in length and cover > 750,000 km2 of geographical area, and exhibit tremendous climatic, topographic, geological, and altitudinal variations that have generated unique landscapes and ecosystems. Himalayas accommodate 13 of the 825 ecoregions in the world. The enormous biological diversity is matched by cultural and ethnic diversity. Himalayas is also is known as the “water tower of Asia” because it is the source of the 8 largest rivers of Asia, which sustains about 3.5 billion people living in the downstream regions. Impacts of climate change are already evident on the vegetation systems in the Himalayas. During the last century global average surface temperature has increased by approximately 0.6-0.8°C. Nonetheless, during past decade the rates of climatic warming in Himalaya have been reported to exceed over 1.2 °C, which has drastically impacted the forest ecosystems in this region. Various studies have reported the direct and indirect role of climate change in vegetation degradation e.g., due to invasion of alien species, forest destruction due to over increasing occurrences of forest fires, and reduction in agricultural and forest productivity. Climate change induced vegetation shifts in these regions have also been observed and predicted (Telwala et al., 2013). Nepal faces the consequences of global warming because of the geographical and climatic conditions, high dependence on natural resources and lack of resources to cope with the changing climate. Under such a situation it is timely to access the climate change vulnerability of the forest ecosystems in Nepal, which have a
large social dependence on them for timber, fuelwood, fodder, and medicines.
1.2 Climate Change Vulnerability
Vulnerability is the degree to which a system is susceptible to, or unable to cope with, impacts of climate change, including climate variability and extremes (Fussel and Klein, 2005). IPCC defines it as an integrated measure of the expected magnitude of adverse effects to a system caused by a given level of certain external stressors. The term ‘vulnerability’ has been used by various research communities in many different ways, such as those focused on securing livelihoods, food security, natural hazards, disaster risk management, public health, global environmental change, and climate change. Liverman (1990) reported that “climate change vulnerability of forests can be related to concepts such as resilience, marginality, susceptibility, adaptability, fragility, and risk”. However, climate change vulnerability of forests is also a function of exposure, sensitivity, and adaptive capacity of these ecosystems in the particular region.
As per IPCC’s definition, vulnerability includes an external dimension, which is represented here by the ‘exposure’ of a system to climate variations, as well as an internal dimension, which comprises its ‘sensitivity’ and its ‘adaptive capacity’ to these stressors. Exposure can be defined as the ‘nature or the degree to which a system is exposed to significant climatic variations’, and it comprises of climatic variables, which are derived based on temperature and precipitation. Sensitivity is defined as the degree to which a system is affected either adversely or beneficially, by climate related stimuli, and it contains biophysical variables, which indicate the phenological
The International Archives of the Photogrammetry, Remote Sensing and Spatial Information Sciences, Volume XL-8, 2014 ISPRS Technical Commission VIII Symposium, 09 – 12 December 2014, Hyderabad, India
This contribution has been peer-reviewed.
and physiological characteristics of the forests e.g., albedo, evapotranspiration, occurrence of forest fires, net primary productivity, and gross primary productivity. Adaptive capacity can be defined as ability of a system to adjust to climate change to moderate potential damage from it, and it comprises of variables pertaining to plant species richness and forest structure. The vulnerability assessment techniques can be divided into three broad types based on their approach and techniques involved in the methods: a) the ‘risk-hazard framework’, which relies basically on technical literature on risk and disaster management. It conceptualizes vulnerability as the dose-response relationship between an exogenous hazard to a system and its adverse effects (Downing and Patwardhan, 2003); b) the ‘social constructivist framework’ prevails in political economy and human geography. It regards (social) vulnerability as an a priori condition of a household or a community that is determined by socio-economic and political factors (Adger and Kelly, 1999); c) ‘non-climatic factors framework’ depicts vulnerability as the socioeconomic causes of differential sensitivity and exposure. Climate change vulnerability assessments are conducted in diverse contexts, depending on the concerns of group of stakeholders experiencing the impacts in the region. Considering the fundamental response options to climate change, three major decision contexts can be identified: a) specification of long-term targets for the mitigation of global climate change, b) identification of particularly vulnerable regions to prioritize resource allocation for adaptation, and c) recommendation of adaptation measures for specific regions and sectors.
1.3 Geospatial tools and techniques
The advent of open source climate and biophysical data and geospatial tools has boosted the studies on impacts of climate change on forests e.g., freely available datasets on vegetation phenology such as productivity variables provided by Moderate Resolution Imaging Spectroradiometer (MODIS), derivatives of temperature and precipitation provided by Worldclim, and moderate spatial resolution multispectral satellite datasets provided by Landsat. Remote sensing satellite datasets due to their synoptic coverage prove to be advantageous in understanding the distribution of vegetation communities, their phenological patterns, and impacts of climate change on these ecosystems across multiple spatial as well as temporal scales.
1.4 Adaptation and mitigation measures
Two fundamental response options to the predicted climate change are mitigation of and adaptation to the climate change respectively. Mitigation refers to controlling global climate change by reducing the emission of greenhouse gases (GHGs) and enhancing their sinks, whereas adaptation mainly focuses on moderating impacts of climate change through a wide range of actions that are targeted at the vulnerable system. Traditionally, mitigation has remained at the main focus than adaptation of the climate change community, both from a scientific and from a policy perspective. Important reasons for the focus on mitigation is that, mitigating climate change helps to reduce impacts on all climate-sensitive systems, while the potential of adaptation measures is limited to a few systems. Nonetheless, researchers have proposed comprehensive consideration of adaptation options as a response measure to climate change along with mitigation mechanisms due to following reasons: a) considering the amount of past GHG emissions and the inertia of the climate system, climate change is inevitable, which can no longer be prevented even by the
most ambitious emission reductions, b) effect of emission reductions takes several decades to fully manifest on the other hand most of the adaptation measures have more instant benefits, c) adaptations can be effectively implemented on a local or regional scale, while implementing mitigation mechanisms require international cooperation, such that their efficacy is less dependent on the actions of others. Effective adaptation to climate change depends on the availability of two important prerequisites: a) information on what to adapt to and how to adapt, and b) availability of resources to implement the adaptation measures. Ground based information about the vulnerable systems and the stressors that it is exposed to, and the transfer of resources to vulnerable societies in order to help them to prepare to cope up with the inevitable impacts of climate change are thus necessary elements of a comprehensive climate policy. In the present study, we focus on assessing climate change vulnerability of forest ecosystems in Chitwan Annapurna landscape (CHAL) in Nepal.
2. METHODS
2.1 Study area
The study area accommodates Chitwan Annapurna Landscape (CHAL) falling in Central development region in Nepal covering an area of 32,057 km2 with altitudinal variation of 200-. CHAL accommodates a human population of more than four million people, many of whom live in very isolated places with poor access to markets, and who are very dependent on forest resources and ecosystem services for their livelihoods and wellbeing.
Figure 1. Study area map
2.2 Modelling Climate Change Vulnerability
Present study aims at understanding the climate change vulnerability of the forest ecosystems in the study area using the equation, where vulnerability = ƒ (Exposure, Sensitivity, Adaptive capacity).
2.2.1 Exposure
We used 12 non-collinear Bioclim variables (spatial resolution = 1km) of present climate scenario (Worldclim.org) as exposure variables, which included mean annual temperature, mean annual precipitation, max temperature of warmest month, min temperature of coldest month, max precipitation of wettest month, min precipitation of driest month, mean temperature and precipitation of: a) driest quarter, which pertained to summer season, b) wettest quarter, which pertained to rainy season, and c) coldest quarter, which pertained to winter season.
The International Archives of the Photogrammetry, Remote Sensing and Spatial Information Sciences, Volume XL-8, 2014 ISPRS Technical Commission VIII Symposium, 09 – 12 December 2014, Hyderabad, India
This contribution has been peer-reviewed.
2.2.2 Sensitivity
Moderate Resolution Imaging Spectroradiometer (MODIS) datasets on evapotranspiration, albedo, net primary productivity (NPP), gross primary productivity (GPP), land surface temperature (LST), leaf area index (LAI), and forest fires at 1 km spatial resolution dating from January 2003 to December 2013 were utilized as sensitivity variables.
2.2.3 Adaptive capacity
The data on plant species richness, plant diversity, and aboveground biomass of trees was generated through 306 field sampling plots laid across the study area during 2012. These datasets were utilized as adaptive capacity (AC) variables.
2.3 Vulnerability index
Geographic weighted regression (GWR) was performed in a geographic information system (GIS) environment ArcGIS 10.2 (ESRI, 2013), where sensitivity factors comprising of biophysical parameters formed explanatory variables and exposure factors comprising of climate variables formed predictor variables. The results based on GWR provided an explanation to the role of exposure variables in controlling sensitivity variables. The impacts of climate variables on biophysical variables was studied using GWR, while a weightage based matrix was generated to understand the interrelated impacts within biophysical variables. The biophysical variables such as LST, LAI, and Albedo have direct impacts on other biophysical variables such as NPP and ET, while the vice-versa in the form of indirect impacts has also been reported (Figure 2).
Figure 2. Interrelationships among the biophysical and climate variables
2.4 Validation of results
Severe drought in rainfall was observed during year 2007 with very less rainfall during the monsoon season and prolonged drought during winter, whereas during 2009 moderate rainfall was recorded. To understand the impacts of temporal variability in climate on the climate change vulnerability of forests, we generated an index based on the data on biophysical variables of 2007 and 2009 and it was used for validating the output.
3. RESULTS
3.1 Patterns in climate and biophysical variables
The mean annual temperature varied from -7.21 to 24.52 Deg. C, while mean annual precipitation ranged between 92 to 3387 mm. Mean annual evapotranspiration ranged from 308 to 1250 mm/year, mean annual albedo ranged from 0.02 to 0.40, mean annual LAI ranged from 0.15 to 6.49.
3.2 Relationship between climate and biophysical variables
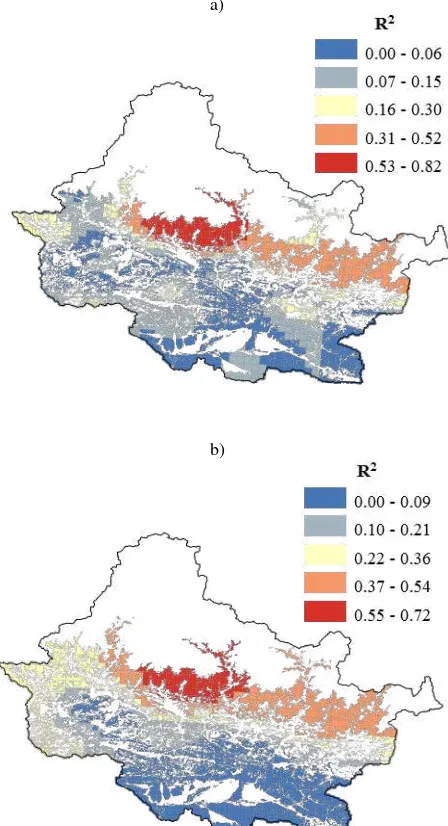
The variance in mean annual NPP calculated based on ten years was largely explained by minimum temperature of coldest month (up to 0.82), and by mean annual precipitation (up to 0.72). The variance explained was higher in the regions situated along the high altitude, which clearly depicts higher impact of climate on high altitude vegetation communities.
a)
b)
Figure 3: Impact of climate variables on NPP observed through GWR: a) minimum temperature of coldest month, b) mean annual precipitation
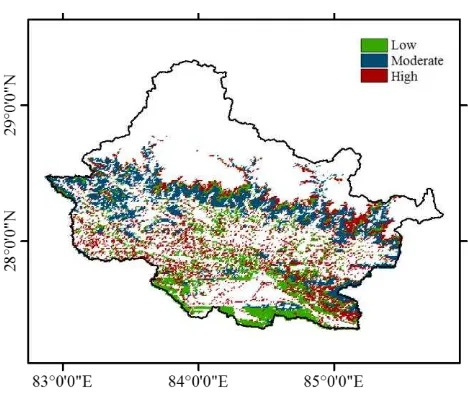
3.3 Climate vulnerability of forest ecosystems
Based on the biophysical variables dating from 2003 to 2013 and climate datasets of present time period, we explored the impacts of climate on the sensitive variables directly linked to the functioning of forest ecosystems. Vulnerability map (figure 4) depicts moderate to high vulnerability of forests situated along the high altitude regions, while low vulnerability was observed in the forests situated in the low altitude regions such as Terai. Based on the impacts of climate variables in the present scenario, the relationships in future climate scenario will be calculated.
The International Archives of the Photogrammetry, Remote Sensing and Spatial Information Sciences, Volume XL-8, 2014 ISPRS Technical Commission VIII Symposium, 09 – 12 December 2014, Hyderabad, India
This contribution has been peer-reviewed.
Figure 4: Vulnerability map of CHAL landscape indicating regions moderate to high vulnerability of forest ecosystems situated along high altitude
4. DISCUSSION AND CONCLUSIONS
Understanding the climate change vulnerability of forest ecosystems is crucial in the present era of global warming. Prolonged drought during winter season has been observed to affect the productivity of forests in Nepal. The results of present study depict the areas with low, moderate, and high vulnerability to climate change. Particularly, high altitude ecosystems have been observed to be largely dependent on climate, and hence are expected to be highly vulnerable to climate change (Chaudhary and Bawa, 2011). Predicting the impacts of future climatic conditions on the functioning of forest ecosystems plays an important role in providing answers to unexplored research questions in ecology. Present study concludes that high altitude flora of Himalayan region is largely vulnerable to even slighter changes in climate.
REFERENCES
Adger, W. N., & Kelly, P. M. 1999. Social vulnerability to climate change and the architecture of entitlements. Mitigation and adaptation strategies for global change, 4(3-4), 253-266.
Chaudhary, P., Bawa, K. S. 2011. Local perceptions of climate change validated by scientific evidence in the Himalayas. Biology Letters, rsbl20110269.
Downing, T. E., Patwardhan, A. 2005. Assessing vulnerability for climate adaptation. Adaptation policy frameworks for climate change: Developing strategies, policies and measures, 67-90.
Füssel, H. M., Klein, R. J. 2006. Climate change vulnerability assessments: an evolution of conceptual thinking. Climatic change, 75(3), 301-329.
Liverman, D. M. 1990. Vulnerability to global environmental change. Understanding global environmental change: The contributions of risk analysis and management, 27-44.
Telwala, Y., Brook, B. W., Manish, K., Pandit, M. K. 2013. Climate-induced elevational range shifts and increase in plant species richness in a Himalayan biodiversity epicentre. PloS one, 8(2), e57103.
The International Archives of the Photogrammetry, Remote Sensing and Spatial Information Sciences, Volume XL-8, 2014 ISPRS Technical Commission VIII Symposium, 09 – 12 December 2014, Hyderabad, India
This contribution has been peer-reviewed.