COMPARISION OF PHOTOGRAMMETRIC POINT CLOUDS WITH BIM BUILDING
ELEMENTS FOR CONSTRUCTION PROGRESS MONITORING
S. Tuttas a, *, A. Braun b, A. Borrmann b, U.Stilla a
a Photogrammetry & Remote Sensing, TU München, 80290 München, Germany - (sebastian.tuttas, stilla)@tum.de b Chair of Computational Modeling and Simulation, TU München, 80290 München, Germany - (alex.braun,
andre.borrmann)@tum.de
Commission III
KEY WORDS: Photogrammetric point clouds, construction site, monitoring, building model
ABSTRACT:
For construction progress monitoring a planned state of the construction at a certain time (as-planed) has to be compared to the actual state (as-built). The as-planed state is derived from a building information model (BIM), which contains the geometry of the building and the construction schedule. In this paper we introduce an approach for the generation of an as-built point cloud by photogrammetry. It is regarded that that images on a construction cannot be taken from everywhere it seems to be necessary. Because of this we use a combination of structure from motion process together with control points to create a scaled point cloud in a consistent coordinate system. Subsequently this point cloud is used for an as-built – as-planed comparison. For that voxels of an octree are marked as occupied, free or unknown by raycasting based on the triangulated points and the camera positions. This allows to identify not existing building parts. For the verification of the existence of building parts a second test based on the points in front and behind the as-planed model planes is performed. The proposed procedure is tested based on an inner city construction site under real conditions.
1. INTRODUCTION
1.1 Motivation
In construction progress monitoring the manual progress assessment is still dominating and is mainly conducted based on 2D plans. In future the usage of building information models (BIM) will increase. That means that a model including the information about the building geometry, the construction schedule and attributes of the building parts will be available. Instead of updating the model based on the deviations detected in the plans, the monitoring process shall directly be coupled with the BIM. For that deviations from the planned states (as-planed) in the BIM shall be recognized automatically by a surveillance system (based on cameras or laser scanner) which records the state of the building at a certain time step (as-built). The detected deviations then cause changes in the construction logistic, e.g. by adapting the schedule so that delays can be handled in a resource-efficient way.
1.2 Related Work
Works related to progress monitoring addressing the issues of data acquisition with laser scanner or images/videos, point cloud generation, co-registration of model (BIM) and point cloud, the as-built as-planed comparison and the update of the schedule. Rankohi & Waugh (2014) give an overview and comparison of image-based approaches for the monitoring of construction progress. The approaches are categorized based on data collection method, analysis method for the state comparison and visual representation. The as-built point clouds can be acquired by laser scanning or imaged-based/photogrammetric methods. Works based on laser scanner data are e.g. Bosché (2010), Kim et al. (2013a) or Zhang & Arditi (2013). Point clouds are also created by image based approaches using unordered image sequences (Golparvar-Fard et al. 2012) or a stereo camera system
* Corresponding author
(Son & Kim 2010). Instead of creating a point cloud, progress monitoring can be conducted based on fixed cameras (Kim et al. 2013b). For point clouds created by photogrammetric methods the problem for incorporating the scale arises, what can be solved by using tie points (Golparvar-Fard et al. 2012) or by using a calibrated stereo system. Rashidi et al. (2014) propose to use a coloured cube with known size as target which can be automatically measured to determine the scale. For co-registration often tie points (in model and point cloud) or ICP-approaches are used, e.g. in Bosché (2010) or Kim et al. (2013a). For the as-built – as-planed comparison several different approaches are proposed. In Bosché (2010) the object recognition is performed based on a threshold on the ratio of the covered area to the entire surface of the object. The covered area is determined by the amount of matched points between the as-built point cloud and an as-planed point cloud, which is calculated from the known scan positions and the model. In Kim et al. (2013a) specific component types are detected based on a supervised classification and regarded as correct if the type fits to the type in the model. Zhang & Arditi (2013) introduce a measure for deciding four cases (object not in place, point cloud represents a full object or a partially completed object or a different object) based on the relationship of points within the boundaries of the object and the boundaries of a shrunk object. Golparvar-Fard et al. (2012) use a voxel grid which is traversed to determine occupied voxels, once based on the point cloud and once based on the model. A Bayesian model is proposed to detect and track the building elements.
1.3 Structure of the paper
The approach presented in this paper addresses the issue of data acquisition and point cloud generation based on unordered images (Section 2) as well as the as-built – as-planed comparison (Section 3). Our concept for point cloud generation is based on The International Archives of the Photogrammetry, Remote Sensing and Spatial Information Sciences, Volume XL-3, 2014
stable control points which shall guarantee that also point clouds from not overlapping image blocks can be combined to a consistent point cloud. These points are also useful for co-registration to avoid e.g. an ICP-algorithm where the building parts to be proofed are used for co-registration. The approach for the as-built – as-planed comparison combines a measure based on visibility constraints and a measure based on the point-to-model distance. In Section 4 results for the proposed procedures are shown for a test site. In contrast to other approaches we investigate a case where a scaffolding make the point cloud generation and object detection more difficult. The paper ends with a discussion of the results and an outlook proposing some improvements (Section 5).
2. POINT CLOUD GENERATION
2.1 Image orientation
For image orientation a concept is presented which shall fit for the situation on a construction site with unordered and partly non overlapping images. This concept (shown in Figure 1) combines a structure from motion (SfM) approach with the measurement of control points in the construction site reference system (CSRS). With these control points also the co-registration task is solved, since the building model shall also be present in the CSRS. It shall be considered that the construction site is acquired at several time steps and that it cannot be sensed with overlapping images from any position. For the latter case the reasons are manifold on a construction site. There can be occlusion because of construction equipment, there can be areas which are not accessible, e.g. because there are large objects (like a construction trailer) or because of safety reasons. Also for heightened acquisition position, like the crane or neighbouring buildings, it is likely that there will exist groups of images which do not overlap, or at least having no correspondences which can be found automatically. It has also to be considered that a construction site is a highly dynamic environment, what means that the conditions for image acquisitions may change during the acquisition or at least between two time steps. Additionally it shall be ensured that for every time step the new images shall be integrated in the same, consistent coordinate system.
Figure 1. Procedure for image orientation
Based on these requirements the procedure shown in Figure 1 is proposed. Within the SfM process the relative orientation of the images are determined. This will result in several models with no connection between the images because of the aforementioned circumstances. For every model at least two images have to be chosen for which control points are measured to calculate the absolute orientations with a space resection. With this known orientations the location in the CSRS of all images and 3D points from the respective model can be determined. As final step a bundle block adjustment is performed combining all models. For that the inputs are the control point coordinates and the image coordinates of the inlier features from SfM as well as the approximated coordinates of the 3D points and the camera orientations. To ensure that all images can be orientated the control points have to be selected carefully at the beginning of the construction phase.
2.2 Dense point cloud
For every time step a dense point cloud is generated from the oriented images for the as-built as-planed comparison. For that we follow the approach from Rothermel et al. (2012). Every image is chosen as master image once. Possible match images are chosen based on conditions on the baseline. A minimal and maximal baseline is defined, additionally the angle between baseline and camera axes is evaluated. If there are two match images, which distance is within the minimal baseline length, only the image with the better configuration is chosen. For all stereo pairs a dense matching is performed. The resulting depth maps are fused as described in Rothermel et al. (2012). Here only 3D-points are triangulated which are existing in at least two stereo pairs or three images, respectively.
3. AS-BUILT VS. AS-PLANED
For the as-built – as-planed comparison, the model is split into planar objects (e.g. triangles or rectangles). These planes are rasterized with cell size r for the further processing. We define two different states for each raster cell (cf. Figure 2): State A is based on visibility constraints calculated using an octree with voxel size o, state B is based on the points within a bounding box.
Figure 2. Schematic depiction of a model plan with octree cells (used for determination of state A) and raster cells (used for determination of state B and for the combination of A and B)
3.1 Visibility (State A)
Based on the image position and the 3D points it shall be derived which construction parts are covered with points, which are occluded by other objects and which are surely not built. For that The International Archives of the Photogrammetry, Remote Sensing and Spatial Information Sciences, Volume XL-3, 2014
an octree structure is used, in which the points are saved. The octomap library (Hornung et al., 2013) is used to perform a ray-casting from the camera position to the respective points within the octree. For every octree-cube three states can be defined. It can be occupied, i.e. there are points in this cell, it can be free, i.e. at least one ray is passing through the cell, or the state of the cell can be unknown, i.e. there can be made no statement about the state of this cell. For updating a cell which is affected by several measurements a probabilistic occupancy grid mapping as introduced by Moravec and Elfes (1985) is used in this library. For every raster cell centre of the model planes we assign the state of the respective octree cell to it. This is called state of type A with the three states “free”, “occupied” and “unknown”. The size of the octree cells o is chosen larger than the raster cell size of the model parts r, since the main goal of this step is to detect “empty” and “unknown” cells. If an octree cube is set to one of these two states, it is sure for all smaller cubes within to have no points inside.
3.2 Verification based on point-to-model distance (State B)
Since the octree cell size is too large, an occupied octree cell does not proof that the building part at this position is really existing. Because of this, for every raster cell of the model plane it is checked if the points, which are extracted in a certain distance d before and behind the cell, confirm the existence of the plane. For that three criteria are used. The mean of the orthogonal distance from the points to the model plane and the standard deviation of the distances are calculated. Additionally the normal of a local plane fit is determined and the angle between this normal and the normal of the model is calculated.
To confirm the existence of the plane all three values have to be small. To avoid a hard threshold and to regard the uncertainty of the points, probabilities are defined for certain values to support the plane or not, whereby a value of 0.5 means undecided. The log-odds of this probabilities are summed up to define the state of type B, which can be “verified” (probability larger than 0.5) or “not verified” (probability smaller or equal to 0.5).
Figure 3. Probabilities (P, left column) and log-odds (L, right column) for the three criteria distance, normal deviation and standard deviation of distance
Figure 3 shows the values for the three criteria. With the choice of these values, the following shall be expressed:
• A small mean distance is necessary for the verification of the plane.
• A small standard deviation is necessary but does not confirm the plane if the mean distance or the deviation of the normal
is large. The other way round a large standard deviation precludes the existence of the plane.
• A small deviation of the normal angle contributes slightly to the verification but a large deviation precludes the existence of the plane.
As can be seen in the figure the transition between acceptance and refusal is smooth due to decreasing probabilities within a certain range of the criteria values.
3.3 Combination of measures
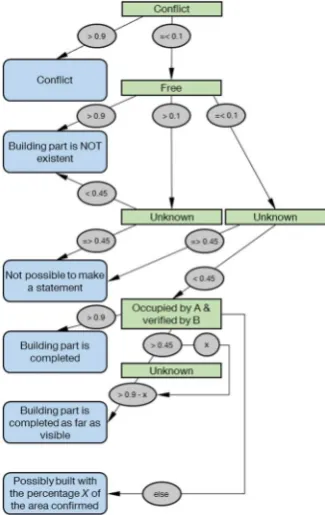
The final state for each raster cell combines the received states of type A and B. Available states are (colours are given for the results shown in Figure 9): “conflict”: not occupied by A but verified by B (grey), “free” (red), “unknown” (black), “occupied by A but not verified by B” (yellow), “occupied by A and verified by B” (blue). For every model plane the percentages of the occurrence of the states of the raster cells are calculated. Based on them the decision tree shown in Figure 4 is used to derive the final state for the model plane. As can be seen in the figure a percentage of 90% for “occupied by A and verified by B” is required for the decision that a model plane is built. Thus, because of occlusion and inaccuracies it is expected that many planes only get the state “possibly built with the percentage X of the area confirmed”. In this case more information are required to get a more reliable result. For example dependencies modelled in the BIM can be used. At the moment every plane is examined on its own. Combining the results of all planes of one building part will increase the robustness of the result.
Figure 4. Decision tree for building part states based on the states of the raster cells. States determined by the combination of state A and B are highlighted in green, the grey ellipsis show the percentage of the states for a building part and the final states which are assigned to a building part are highlighted in blue.
4. EXPERIMENT
4.1 Point-cloud-generation
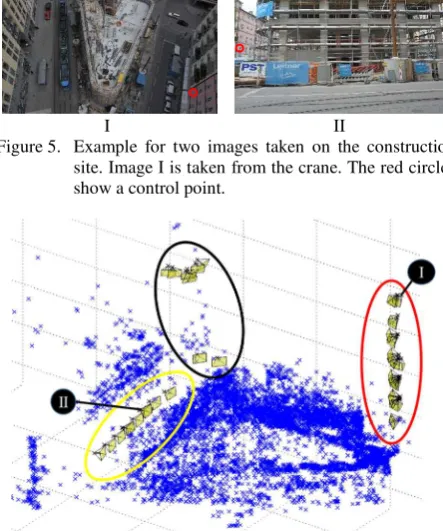
As structure from motion system, the VSfM Software from Wu (2013) is used. It works with SIFT features as point detector/descriptor. In Figure 6 you can see the resulting sparse point cloud as well as the orientation of the 43 images, taken with a Nikon D3 with a 24 mm prime lens (Figure 5 shows two of the images). During the SfM process three models have been created (marked with the coloured ellipses). For each of them four to five control points have been manually measured in three images. The control points are received from a previous laser scan. In this case most of the control points are features on neighbouring houses (one example is marked with a red circle in Figure 5).
I II
Figure 5. Example for two images taken on the construction site. Image I is taken from the crane. The red circles show a control point.
Figure 6. Sparse point cloud of 3D coordinates of the SIFT-Features and camera positions. Image I and II are shown in Figure 5.
Based on the orientations the dense point cloud depicted in Figure 7 is calculated.
Figure 7. Dense point cloud created from the images shown in Figure 6.
4.2 As-built – as-planed comparison
For the evaluation of the as-built – as-planed comparison approach a part of a point cloud is used, which generation process differs in two points from the approach proposed in Section 2.1: (1) Since the coordinate system of the construction site was not available, the co-registration was performed based on distinct features measured in the images and the model (using already built and confirmed building parts). The 3D coordinates of the image features were calculated during the bundle block adjustment. Using the corresponding coordinates from the model the transformation parameters between model and point cloud are calculated.
(2) A part of the point cloud is used, for which the images were orientated with manual points. The reason is that the upper approach was developed later and the tests have already been made with the previous point cloud.
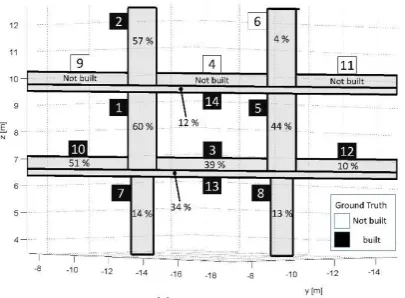
In Figure 8 you can see the extracted point cloud corresponding to the model part shown in Figure 10. In Figure 9 and 10, the results using the approach presented in Chapter 3 are shown. The octree cell size o is 15 cm. The distance for the bounding box is chosen as d = 5 cm. Figure 9 shows the colour coded (as described in Section 3.3) raster cells. The cells have a raster size of r = 10 cm. In Figure 10 the result for every plane, based on the decision tree shown in Figure 4, are depicted. The plane number denotes the ground truth state: Black numbers on white background indicate parts which are not existing (special case is number 6, because there is a formwork), white numbers on black background indicate existing parts.
Figure 8. Extract of the point cloud containing the model planes shown in Figure 10.
Figure 9. Results for each raster cell, “conflict”: not occupied by A but verified by B (grey), “free” (red), “unknown” (black), “occupied by A but not verified by B” (yellow), “occupied by A and verified by B” (blue)
Figure 10. Results for 14 model planes with the states defined in Section 3.3 (Figure 4). Percentages are given for the state “possibly built with the percentage X of the area confirmed”.
Three not completed building parts are correctly classified as “not completed”, what was also expected to be the much more simple decision. A forth not completed part is encased in formwork (Nr. 6) and is classified as “possibly completed”, but with a very small (4 %) confirmed area. All other parts that are completed, are classified as “possibly completed”. The main reasons that no plane is covered sufficiently with points to assign the state “completed” are the occlusion due to the scaffolding and the uncertainties of the points in depth-direction.
5. DISCUSSION AND OUTLOOK
Two approaches towards an automatic construction site monitoring are proposed in the paper, one for as-built data generation, the other one for the as-built – as-planed comparison. For the generation of the as-built data we use photogrammetry to create the point cloud since in our opinion it is more flexible than a laser scanner with respect to the accessible acquisition positions. The disadvantage is the reduced geometric accuracy. In contrast to other approaches, we do not go completely without control points, since they solve the three tasks of scaling and combining the point clouds and the co-registration with the model. This leads to the additional effort of manually measuring these control points, but we show that this can be reduced to a tolerable level by combining it with a SfM approach. As future work, it shall be achieved that the control points only have to be measured for the first acquisition and the images of the following time steps are incorporated into the existing bundle block automatically. Of course, there have to be images with unchanged scene content for that.
The approach for the verification of building parts consists of two different tests. Based on visibility constraints non existing part of the building can be detected as long it was “looked through” them. Additionally building parts can be marked to have an unknown state when they are occluded or not covered by images. The second test is based on the properties (distance, standard deviation and normal vector) of patches consisting of points before and behind the BIM model planes. Weights are defined, regarding the uncertainties of the point cloud, to decide if a model plane can be verified. The results show percentages for the confirmed areas, which are too small for the most building parts. In addition, rates closely to 100% cannot be expected because of occlusions or unavoidable gaps in the acquired data. In future, the building part has also to be regarded as a unit and not only the individual planes. Additionally object properties have to be exploited, for example if a building part can have intermediate
states (like a brick wall) or not (like prefabricated construction parts).
ACKNOWLEDGEMENTS
This work is supported by the DFG-Projekt STI 545/6-1 and BO 3575/4-1 „Entwicklung eines automatisierten Verfahrens zur Baufortschrittskontrolle auf Basis der Integration von Punktwolkeninterpretation und 4D-Bauwerksmodellierung“. We would like to thank Leitner GmbH & Co Bauunternehmung KG as well as Kuehn Malvezzi Architects for their support during the case study.
REFERENCES
Bosché, F., 2010. Automated recognition of 3D CAD model objects in laser scans and calculation of as-built dimensions for dimensional compliance control in construction. Advanced Engineering Informatics 24(1), pp. 107-118.
Golparvar-Fard, M., Peña-Mora, F., Savarese, S., 2012. Automated Progress Monitoring Using Unordered Daily Construction Photographs and IFC-Based Building Information Models. Journal of Computing in Civil Engineering.
Hornung, A., Wurm, K. M., Bennewitz, M., Stachniss, C., Burgard, W., 2013. OctoMap: an efficient probabilistic 3D mapping framework based on octrees. Autonomous Robots 34(3), pp. 189-206.
Kim, C., Son, H., Kim, C., 2013a. Automated construction progress measurement using a 4D building information model and 3D data. Automation in Construction 31, pp. 75-82.
Kim, C., Kim, B., Kim, H., 2013b. 4D CAD model updating using image processing-based construction progress monitoring. Automation in Construction (35): pp. 44-52.
Moravec, H., Elfes, A., 1985. High resolution maps from wide angle sonar. In: Proc. of the IEEE Int. Conf. on Robotics & Automation (ICRA), St. Louis, MO, USA, pp. 116-121.
Rankohi, S., Waugh, L., 2014. Image-Based Modeling Approaches for Projects Status Comparison. CSCE 2014 General Conference, Halifax, Canada.
Rashidi, A., Brilakis, I., Vela, P., 2014. Generating Absolute-Scale Point Cloud Data of Built Infrastructure Scenes Using a Monocular Camera Setting. Journal of Computing in Civil Engineering.
Rothermel, M., Wenzel, K., Fritsch, D., Haala, N., 2012. SURE: Photogrammetric Surface Reconstruction from Imagery. LC3D Workshop, Berlin.
Son, H., Kim, C., 2010. 3D structural component recognition and modeling method using color and 3D data for construction progress monitoring. Automation in Construction 19(7): pp. 844-854.
Wu, C. 2013. Towards Linear-Time Incremental Structure from Motion. 3D Vision, 2013 International Conference on, Seattle, WA: pp. 127-134.
Zhang, C., & Arditi, D., 2013. Automated progress control using laser scanning technology. Automation in Construction 36, pp. 108-116.