Dependence of
kB
−
1
factor on roughness Reynolds number for
barley and pasture
Meelis Mölder
∗, Anders Lindroth
Department of Physical Geography, Lund University, P.O. Box 118, SE-221 00 Lund, Sweden
Received 28 February 2000; received in revised form 28 June 2000; accepted 19 July 2000
Abstract
One of the surface energy balance components, the sensible heat flux, can easily be described for modelling and remote sensing purposes by means of the thermal roughness length (zot). This roughness length is usually expressed relative to
the roughness length for wind speed (zou):kB−1 = ln(z
ou/zot). In the past, thekB−1 factor has been taken as a constant
having a value of ca. 2 in the case of homogeneous canopies. There is some theoretical evidence thatkB−1should depend on
friction velocity (u∗) or roughness Reynolds number (Reo). In this study, previously published barley and pasture data were
re-evaluated. It was shown that the reciprocal of Stanton number, which is a part ofkB−1, could be expressed commonly for both surfaces. The re-evaluatedkB−1 factor took the form:kB−1 = 0.37Re0.3
o −(1.2 or 1.9) (for barley and pasture,
respectively). © 2001 Elsevier Science B.V. All rights reserved.
Keywords:Sensible heat flux; Roughness length; Stanton number; Surface radiation temperature; Field experiment
1. Introduction
One of the surface energy balance components, the sensible heat flux, can easily be described by means of the roughness length concept. The evaporation term can then often be found as a residual. This is a simple one-layer canopy approach that contains the basic physics but keeps the number of needed parameters low. The approach is well justified for closed canopies where the soil contribution to fluxes is small; and it is particularly useful or unavoidable in atmospheric boundary layer studies where the canopy is merely a lower boundary, in regional and global modelling where only processes at large scales are of interest and resource-demanding computations are
∗Corresponding author. Fax:+46-46-2224011.
E-mail address:[email protected] (M. Mölder).
required and also in remote sensing where airborne or satellite measured surface temperature provides a direct link to the sensible heat flux.
Since the momentum exchange is dominated by form drag but the heat transfer takes place by molec-ular diffusion then normally there is higher resistance to the heat exchange than to that for momentum, the difference being expressed via the kB−1 factor
or alternatively by using different roughness lengths for wind speed (zou) and temperature (zot). The latter usually being smaller. Theory predicts that the loga-rithmic ratio of the two roughness lengths, ln(zou/zot)
orkB−1, depends on the roughness Reynolds number,
Reo (Zilitinkevich, 1970). The roughness length zou
is used as a characteristic length, and friction velocity
u∗ as a characteristic velocity to formReoasu∗zou/ν
(ν is the viscosity). The relationship is given in the form of a power function:kB−1∼Reno, which can be
predicted theoretically but eventually still has to be confirmed experimentally.
The large dependence of kB−1 on Reo has been
shown for bluff-rough type of surfaces (Owen and Thomson, 1963; Chamberlain, 1968). Zilitinkevich (1970) proposed n = 0.45, but his later deductions gave n = 0.5 (Zilitinkevich, 1997). Alternatively, Brutsaert (1982) proposed a smaller n = 0.25, but with a larger multiplier, for this type of surfaces. Experimental verification of Brutsaert’s formula was undertaken by Cahill et al. (1997), they keptn=0.25 but had to adjust other parameters in the formula.
For vegetated surfaces theReodependence has
of-ten been omitted and a constant value close to 2 has been suggested for homogeneous canopies (Garratt and Hicks, 1973; Heilman and Kanemasu, 1976; Garratt and Francey, 1978; Choudhury et al., 1986; Hicks et al., 1986; Mölder, 1997). However, theoret-ical models predict that even for vegetated surfaces a weak dependence onReo must exist. According to Brutsaert (1979, 1982), the bulk heat exchange coef-ficient between a leaf and the surrounding air,Ctf, is
a power function of u∗ or of an alternative form of Reynolds number,Re∗=u∗Lf/ν, whereLf is a
char-acteristic dimension of leaves, and that introduces a
Reodependence forkB−1. Brutsaert (1979) discusses
several possibilities to modelCtf ∼Re−∗m; depending
on the nature of micro boundary layers on leaves and the degree of interaction between leaves the power
mcould vary between 0.2 and 0.5. His model, when calibrated against Chamberlain (1966) ‘grass’ data, makes use ofm=0.25. Because of non-linear equa-tions, the powern for Brutsaert (1979)kB−1 values
gets somewhat smaller, ca. 0.2. Note that Duynkerke (1992) used a model, similar to Brutsaert’s, with
m=0.4. Thom (1972) suggested thatkB−1∼u1∗/3.
Malhi (1996) found n ≈ 0.4 when he applied a proper definition of aerodynamic surface temperature to savannah data. Jensen and Hummelshøj (1995) and McNaughton and Van Den Hurk (1995) presentkB−1
as a function ofRe∗raised to 1/3 and 0.5, respectively. In Mölder (1997), kB−1 for two barley fields was found to be 2–2.5 for slightly unstable conditions. At larger instability levelskB−1tended to much smaller values. Similar results were also found for a pasture field (Mölder et al., 1999). Here, the analysis was pro-ceeded using the methodology outlined by Brutsaert (1979, 1982), where the kB−1 factor was expressed
through the roughness-sublayer Stanton number and the corresponding drag coefficient. The Stanton num-ber showed a Reo dependence, the data having the
minimum scatter withn =0.5. The purpose of this paper is to apply the same methodology as for pas-ture in Mölder et al. (1999) to the barley data from Mölder (1997) and to show that the scatter can be re-duced even there. As the new analysis of the barley data as well as several results from the literature sug-gestsn= 0.3, then all the data from Mölder (1997) and Mölder et al. (1999) are generalised withn=0.3.
Finally the degree of improvement in calculating the sensible heat flux from surface-air temperature differ-ence using theReo-dependentkB−1versus a constant kB−1is discussed.
2. Materials and methods
The measurement site and equipment have been de-scribed in Mölder (1997) and Mölder et al. (1999). In short, the first paper presents measurements over two barely fields in Estonia: on the Tamme polder (58◦16′N, 26◦10′E; alt. 46 m) in 1989 and near the
village of Tõravere (58◦16′N, 26◦27′E; alt. 70 m) in
1990. The second one describes measurements over a field of tall grass (pasture) in Lövsta near Uppsala (Sweden: 59◦50′N, 17◦48′E; alt. 5 m) in 1993. All the
measurement periods coincided with active vegetation growth. Some data characterising the crops are sum-marised in Table 1. All the analysis is based mainly on profile measurements between 1 and 4 m. In the first two campaigns, fixed sensors were used, whereas reversing psychrometers were used in Lövsta. The in-frared radiometer was the same, the Reemann type, in all studies. With this radiometer, the surface radia-tion temperature is measured as an average over nadir angles 0–45◦, with an effective measurement angle
of 30◦(Mölder et al., 1999). Only daytime data have
been analysed, but they may include both unstable and stable cases.
The methodology that was used in Mölder et al. (1999) was based mainly on ideas from Brutsaert (1979, 1982). ThekB−1 factor can be expressed as a
difference of two resistance terms:
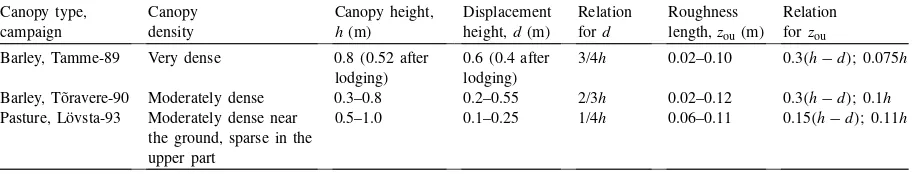
Table 1
Height and aerodynamic characteristics of the studied crops Canopy type, Barley, Tamme-89 Very dense 0.8 (0.52 after
lodging)
0.6 (0.4 after lodging)
3/4h 0.02–0.10 0.3(h−d); 0.075h
Barley, Tõravere-90 Moderately dense 0.3–0.8 0.2–0.55 2/3h 0.02–0.12 0.3(h−d); 0.1h
Pasture, Lövsta-93 Moderately dense near the ground, sparse in the upper part
0.5–1.0 0.1–0.25 1/4h 0.06–0.11 0.15(h−d); 0.11h
Cdo the roughness-sublayer drag coefficient, andk=
0.4 the von Kármán constant. It can be shown that:
kSt−o1=kTh−Ts T∗
and kC−do1/2=kuh u∗
(2)
where Th and uh are respectively, temperature and wind speed at the top of the roughness sublayer,Tsthe surface temperature, andT∗ the scaling temperature.
As the roughness sublayer top matches with the overlaying atmospheric surface layer, the well-known semi-logarithmic profile equations for wind speed and air temperature
can be used to calculateTh anduh (Brutsaert, 1982). Here,ΨuandΨtare the stability correction functions,
Lthe Obukhov length,zthe height, anddthe displace-ment height.
The roughness sublayer height is identified with the canopy height,h. This assumption is a simplification but it does not seem to be crucial forkB−1estimates (Brutsaert, 1979, 1982). In a roughness sublayer, the actual profiles of temperature and wind speed may deviate from semi-logarithmic profiles and introduce a bias in the estimates ofkSt−o1andkC−do1/2. Since these biases are similar and thatkB−1is expressed through the difference ofkSt−o1andkC−do1/2, they cancel each other out inkB−1estimates.
The stability correction terms withzouandzotin (3)
and (4) can be neglected and we can write forz=h:
According to Table 1,zou can be presented aszou =
k2(h−d), wherek2 is a constant. This simplifies (5)
It is the first term on the right hand side of (6) that may beReodependent. The stability correction term in (6) can be eliminated for a while by considering another temperature:
and that allows us to write a more practical expression
kTh,n−Ts
can be determined from experimental data.
Substitution of (5) and (6) into (1) and considering (7) and (9) and that the stability correction terms with
h−dalmost cancel out each other, leaves us the final expression forkB−1:
and Mölder (1997). This technique includes the least squares method and an iteration procedure. When the parametersu∗,T∗ andL were obtained, the analysis proceeded to calculateThfrom (6) and with its
trans-formation toTh,n using (8). The differenceTh,n−Ts
was plotted against (T∗/k)Reno. The values ofn were varied from 0 to 1 in 0.1 steps. The ‘right’ value was obtained when the linear regression, forced through the origin, gave a minimum standard deviation.
3. Results and discussion
The barley data were re-evaluated using the method-ology outlined above. The Tõravere-90 data cover a narrow range ofT∗values and have too large scatter, therefore, they did not distinguish any particular value for n. For Tamme-89 data, which is a good data set, the best correlation betweenTh,n−Ts and (T∗/k)Reno
was obtained withn=0.3 (Fig. 1).
Althoughn=0.5 gave the minimum standard de-viation of the regression line for the pasture data in Mölder et al. (1999), the standard deviation was not much higher forn =0.3 or 0.4. Therefore, it is not excluded thatn=0.3 might also be a proper value for the pasture. Fig. 1 presents also the newly re-evaluated pasture data. It is clear that a common line can be ap-plied for both data sets. The Tõravere-90 data do also
Fig. 1. The temperature differenceTh,n−Tsvs. the scale (T∗/k)Re0o.3 ((s) pasture, Lövsta-93; (d) barley, Tamme-89; (x) barley, Tõravere-90). The line is forced through the origin and has the slope of 0.37.
support this slope. It is quite striking that two differ-ent surfaces, although having some common features (dominant vertical orientation), can be described with a universal Stanton number:
kSt−o1=0.37Re0o.3 (11) Since different expressions, that relatezou toh−d,
were found for barley and pasture (Table 1), thekB−1
formulas contain slightly different constant terms. The re-evaluated equations forkB−1take the form:
kB−1=0.37Reo0.3−(1.2 or 1.9)
(barley and pasture,respectively) (12) This finding is close to Brutsaert (1979, 1982) and Thom (1972) predictions. In field situations, it seems difficult to confidently determine the power of Reo
with accuracy higher than around±0.15.
Although the presented analysis is a step from the simplest case of a constant kB−1 to a slightly more complicated case with kB−1 varying with u∗ and
zou, it is still based on many simplifications. Firstly,
the surface radiation temperature may possess a di-rectional dependence which is ignored in this study. Since the studied crops were practically closed ones and the radiometer used has a large opening an-gle, this phenomenon was not very crucial. Checks with an hand-held radiometer showed that radiative surface temperatures measured at different inclina-tion angles above the barley at the Tamme site were within 0.3 K. Otterman et al. (1995) suggest to tilt a narrow-opening-angle radiometer to 50◦from nadir to
measure a representative surface temperature. Our ra-diometer ‘averaged’ radiation at angles from 0 to 45◦
and its effective temperature corresponded to the sur-face temperature ‘seen’ at 30◦from nadir. Theoretical
estimates for the pasture showed that this temperature should not deviate from the 50◦ temperature more
than 0.5 K. However, temperatures measured with the large-opening-angle radiometer differed by 0.5–1 K from another, narrow-opening-angle radiometer being installed under a 45◦ nadir angle above the pasture.
Secondly, the aerodynamic parameters d and zou
may depend on more parameters than only on the canopy height h. The roughness density (or frontal area) is the relevant parameter most discussed in the literature (Verhoef et al., 1997). As our measurements were conducted under 1–2 months in the middle of on-going vegetation periods, it seemed reasonable to assume that the roughness density did not change con-siderably. Another complication might be thatd and
zoumay depend on wind speed in the case of a flexible canopy (Monteith and Unsworth, 1990). On the other hand, observations by Baldocchi et al. (1983) and Ja-cobs and Van Boxel (1988) show no such dependence for soybean and corn crops, respectively. As our data on individual d andzou values are very scattered we
cannot detect any dependence on wind speed reliably. In this paper, the focus has been on finding a better parameterisation for the temperature profile. Results are good because: (i) we do not average in-dividual ln(zou/zot) values but study general trends in
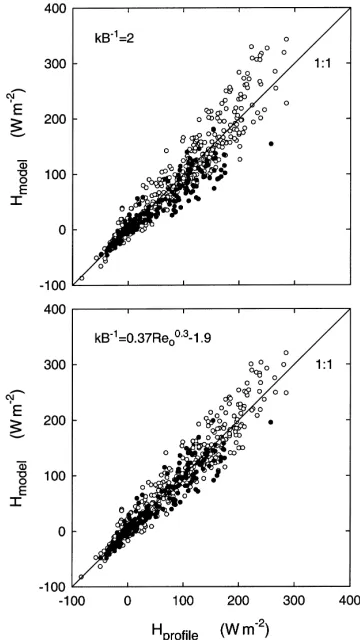
surface-air temperature differences versus a relevant scale (here T∗Re0o.3); (ii) we extrapolate temperature profiles down to the canopy height avoiding a much longer extrapolation to thezoulevel (in Mölder (1997) the differenceT (zou)−Tswas studied); (iii) inclusion of theRe0o.3term reduces further the scatter in the data. Next the question how much the new formulation of kB−1 can improve sensible heat flux calculations compared with the use of a standard kB−1 = 2 is
investigated. Sensible heat fluxes (Hmodel) calculated
from the surface radiation temperature and one-level air temperature and wind speed data (at 3.23 and 3.605 m, respectively) using two formulations for
kB−1are compared with the reference fluxes (Hprofile)
that are calculated using all available profile data (three temperature and five wind speed levels; no surface temperature involved). There is no dramatic change, but an improvement using a variable kB−1
is obvious (Fig. 2). The improvement is most no-table for low friction velocities (shown with filled symbols), but the scatter is decreased for all other friction velocities, too. For Hprofile >50 W m−2, the
correlation coefficient increased from 0.94 to 0.96 and the mean root square error decreased from 34 to 27 W m−2. The slopes are practically equal to 1 in
both cases, implying that kB−1 = 2 is also a good choice, not only for pasture as demonstrated here but for barley as well. Note that sensible heat fluxes are
Fig. 2. Comparison of sensible heat fluxes calculated from surface radiation temperature and one-level air temperature and wind speed measurements using different formulations forkB−1vs. fluxes cal-culated from all available profile data. Data over pasture at Lövsta site. Filled symbols distinguish the series with 0.1< u∗<0.3
(m s−1).
not merely a product of temperature gradients (T∗) but involve in an equal degree wind speed gradients (u∗) that increase the scatter in the data and mask the temperature-profile related processes.
4. Conclusions
vegetated surfaces. Such a dependence is discov-ered easiest when the kB−1 factor is split into the roughness-sublayer Stanton number and the corre-sponding drag coefficient, and when that Stanton number is estimated by plotting the temperature dif-ferenceTh,n−Tsagainst (T∗/k)Reno. Re-evaluation of
a barley data set gave n = 0.3. n = 0.5 has been previously published for tall grass (pasture) data, but the result was not much different forn=0.3 or 0.4. Applying n =0.3 also to the pasture data set, both the barley and the pasture data collapse onto one and the same line. New equations for kB−1 take the
form:kB−1=0.37Reo0.3−(1.2 or 1.9)(for barley and pasture, respectively). It has to be mentioned again that in field situations it is difficult to confidently determine the power ofReo with an accuracy higher
than around±0.15. All the data sets give good results even with a constant kB−1 = 2, but the use of the new formulation reduces the scatter in the calculated sensible heat fluxes.
Acknowledgements
M. Mölder appreciates the financial support from the Swedish Natural Science Research Council.
References
Baldocchi, D.D., Verma, S.B., Rosenberg, N.J., 1983. Characteristics of air flow above and within soybean canopies. Boundary-Layer Meteorol. 25, 43–54.
Brutsaert, W., 1979. Heat and mass transfer to and from surfaces with dense vegetation or similar permeable roughness. Boundary-Layer Meteorol. 16, 365–388.
Brutsaert, W., 1982. Evaporation into the Atmosphere. Reidel, Dordrecht, Holland.
Cahill, A.T., Parlange, M.B., Albertson, J.D., 1997. On the Brutsaert temperature roughness length model for sensible heat flux estimation. Water Resour. Res. 33, 2315–2324.
Chamberlain, A.C., 1966. Transport of gases to and from grass and grass-like surfaces. Proc. R. Soc. Lond. A290, 236– 265.
Chamberlain, A.C., 1968. Transport of gases to and from surfaces with bluff and wave-like roughness elements. Q. J. R. Meteorol. Soc. 94, 318–332.
Choudhury, B.J., Reginato, R.J., Idso, S.B., 1986. An analysis of infrared temperature observations over wheat and calculations of latent heat flux. Agric. For. Meteorol. 37, 75–88.
Duynkerke, P.G., 1992. The roughness length for heat and other vegetation parameters for a surface of short grass. J. Appl. Meteorol. 31, 579–586.
Garratt, J.R., Hicks, B.B., 1973. Momentum, heat and water vapour transfer to and from natural and artificial surfaces. Q. J. R. Meteorol. Soc. 99, 680–687.
Garratt, J.R., Francey, R.J., 1978. Bulk characteristics of heat transfer in the unstable baroclinic atmospheric boundary layer. Boundary-Layer Meteorol. 15, 399–421.
Heilman, J.L., Kanemasu, E.T., 1976. An evaluation of a resistance form of the energy balance to estimate evapotranspiration. Agron. J. 68, 607–611.
Hicks, B.B., Wesely, M.L., Coulter, R.L., Hart, R.L., Durham, J.L., Speer, R., Stedman, D.H., 1986. An experimental study of sulphur and NOx fluxes over grassland. Boundary-Layer Meteorol. 34, 103–121.
Jacobs, A.F.G., Van Boxel, J.H., 1988. Changes of the displacement height and roughness length of maize during a growing season. Agric. For. Meteorol. 42, 53–62.
Jensen, N.O., Hummelshøj, P., 1995. Derivation of canopy resistance for water vapour fluxes over a spruce forest, using a new technique for the viscous sublayer resistance. Agric. For. Meteorol. 73, 339–352.
Malhi, Y., 1996. The behaviour of the roughness length for temperature over heterogeneous surface. Q. J. R. Meteorol. Soc. 122, 1095–1125.
McNaughton, K.G., Van Den Hurk, B.J.J.M., 1995. A ‘Lagrangian’ revision of the resistors in the two-layer model for calculating the energy budget of a plant canopy. Boundary-Layer Meteorol. 74, 261–288.
Monteith, J.L., Unsworth, M.H., 1990. Principles of Environmental Physics. Edvard Arnold, London, UK.
Mölder, M., 1997. Parameterization of exchange processes over a barley field. Boundary-Layer Meteorol. 84, 341–361. Mölder, M., Lindroth, A., Grelle, A., 1999. Experimental
deter-mination of the roughness length for temperature over a field of tall grass in central Sweden. Geografiska Annaler 81A, 87–100. Otterman, J., Susskind, J., Brakke, T., Kimes, D., Pielke, R., Lee, T.J., 1995. Inferring the thermal-infrared hemispheric emission from a sparsely-vegetated surface by directional measurements. Boundary-Layer Meteorol. 74, 163–180.
Owen, P.R., Thomson, W.R., 1963. Heat transfer across rough surfaces. J. Fluid Mech. 15, 321–334.
Thom, A.S., 1972. Momentum, mass and heat exchange of vegetation. Q. J. R. Meteorol. Soc. 98, 124–134.
Verhoef, A., McNaughton, K.G., Jacobs, A.F.G., 1997. A parame-terization of momentum roughness length and displacement height for a wide range of canopy densities. Hydrol. Earth Syst. Sci. 1, 81–91.
Zilitinkevich, S.S., 1970. Dynamics of the Atmospheric Boundary Layer. Hyrometeorological Press, Leningrad, Russia (in Russian).