DEM GENERATION WITH SHORT BASE LENGTH PLEIADES TRIPLET
K. Jacobsena, H. Topanb a
Leibniz University Hannover, Institute of Photogrammetry and Geoinformation, Germany;
bBülent Ecevit University, Zonguldak, Turkey
[email protected]; [email protected]
Commission I, WG I/4
KEY WORDS: Space, Adjustment, DEM/DTM, Georeferencing, Radiometric, Accuracy, Performance
ABSTRACT:
An image triplet of Pleiades images covering the area of Zonguldak, Turkey has been investigated. The height to base relation of the first to the last image is just 1:4.5 and for the first and the second image 1:9. This is quite below the usual height to base relation of 1:1.6 for a typical stereo pair of space images. The corresponding small angle of convergence influences the possible vertical accuracy, but images with such a small angle of convergence are more similar to each other as images with larger convergence angles. This enables a better image matching, improving the vertical accuracy and compensating partially the influence of poor intersection geometry. Even over forest areas no matching gaps occurred. Height models are generated with different base configurations and compared with a reference height model.
Pleiades images are distributed with 50cm ground sampling distance instead of the physical size of 70cm, the image quality justifies this zooming and also the geometric results are in the range of other space images with originally 50cm GSD.
The image orientation by bias corrected Rational Polynomial Coefficients (RPC) is leading with more as 160 ground control points (GCP) to root mean square (RMS) differences slightly below 1.0 GSD of the distributed images (0.5m GSD). Only negligible systematic errors have been identified. With the combination of the first and last image a standard deviation of the generated height model of 1.6m, respectively for flat terrain close to 1.0m has been reached in relation to a reference height model. The small angle of convergence is not as much influencing the height accuracy as according to simple geometric relation.
1. INTRODUCTION
Digital elevation models are a basic requirement for several topics. Often available height models have not satisfying resolution and accuracy or the terrain has changed, requiring new generation of height models. For large and median scale maps and depending upon the type of terrain, height models with standard deviation in the range of 1m for flat terrain and a point spacing starting at 2m may be required. For this application LiDAR is too expensive and time consuming and the commercial height model WorldDEM based on TanDEM-X radar interferometry may not have a satisfying resolution, requiring a generation with aerial or space images. The today very high resolution space images have overlapping resolution with aerial images. With the fast rotating optical satellite systems WorldView and Pleiades the imaging of required stereo models from the same orbit is not a problem. So often the decision for using aerial or space images is just based on financial or organization reason. The triplet image configuration proposed by Airbus DS has the advantage of over-determination, enabling blunder detection for any point, and in dense cities it can reduce occlusions. Following the advantages and disadvantages of a small base length Pleiades triplet are investigated.
The generation of height models with Pleiades triplets has been investigated before (e.g. Poli et al. 2013, Durand et al. 2013), but always with large base length image combinations. Only (Bernard et al. 2012) handled also small base length image combinations; but the special problems have not been handled in detail as it will be done here.
2. DATA SET
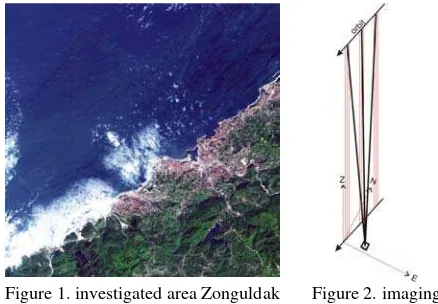
The analyzed Pleiades image triplet covers the city of Zonguldak and surrounding area. The surrounding area, but also larger parts of the city are mountainous. Approximately 60% of the land area is covered by forest (figure 1).
The used image triplet has a very short base length (figure 2, table 1) corresponding to an angle of convergence between the first and last image of 12.6°. The view direction with 4.7° across orbit is close to nadir view, so the geometric ground sampling distance (GSD) is ranging from 72.6cm x 72.0cm to 69.9cm x 71.1cm. Nevertheless the images are distributed by Airbus DS with 50cm GSD.
Figure 1. investigated area Zonguldak shown by Pleiades-1A image
Figure 2. imaging configuration The International Archives of the Photogrammetry, Remote Sensing and Spatial Information Sciences, Volume XL-3/W2, 2015
Image combinations
Time difference of imaging
Base length Base to height relation
Convergence angle
First – centre 10.25 sec 76.9 km 1 : 9.0 6.3° Centre – last 10.50 sec 79.8 km 1 : 8.8 6.5° First - last 20.75 sec 156.7 km 1 : 4.5 12.6°
Table 1: Imaging configuration
Pleiades images are zoomed from approximately 70cm geometric GSD to 50cm GSD of the distributed images. The factor for effective resolution determined by edge analysis for all channels is slightly below 1.0 for 50cm GSD, meaning that the effective resolution corresponds to 50cm GSD. This is only possible if the images have been sharpened. Image sharpening worsens the signal to noise relation (SNR), but the SNR is on the same level as for space images without zooming. A reason for this may be the used noise filter which may affect small image details. A comparison of Pleiades images with WorldView-1 and QuickBird images showed that the Pleiades images image details are better as WorldView-1 with 0.5m geometric resolution and at least on the same level as QuickBird images. That means Pleiades images distributed with 50cm GSD, zoomed from 70cm original GSD, have similar radiometric quality images as space images with 50cm geometric resolution (details in Jacobsen 2015).
As reference for the generated height models a digital terrain model (DTM) based on UltraCam images with 30cm GSD is available. The manually measured points of the bare ground are estimated with approximately 50cm standard deviation in Z (SZ). Because of not well known datum shift between the Turkish national coordinate system and the ground control point measurements by GNSS, it was necessary to determine and respect the shift between the reference and the generated height models by adjustment.
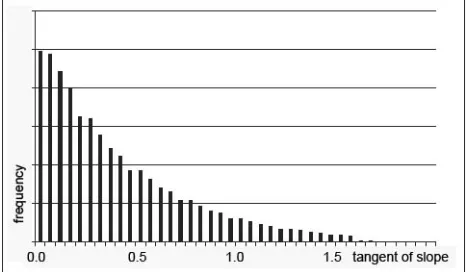
The terrain of the whole area is very steep, shown by the frequency distribution of terrain slope in figure 3. Even in large parts of the build up areas the streets are following the contour lines and crossing streets are strongly inclined. The mountainous terrain character is obvious in figure 1. The terrain is not only steep, it is also rough, with in average a height difference of 0.47m against linear interpolation in the centre over 4m point spacing.
Figure 3. Frequency distribution of terrain slope
3. IMAGE ORIENTATION
Together with the Pleiades images rational polynomial coefficients (RPC) are distributed. They are describing the relation between the ground point and the image point (Grodecki 2001) and are based on the direct scene orientation by combination of GNSS, star sensors and giros. For Pleiades 1A the accuracy of the direct sensor orientation is given by
Airbus DS with 8.5m CE90. Corresponding to the statistical relation between CE90 and the standard deviation for X (SX) respectively for Y (SY) of 2.146, SX and SY are 3.9m. For Pleiades 1B with SX=1.6m it is quite better. The declared absolute accuracy is not sufficient for the accuracy which can be reached by object point determination with Pleiades images, requiring ground control points (GCP). Approximately 170 GCP, determined by GNSS ground survey, could be used. The ground points are defined by topographic objects; especially in rural area this is not very precise, limiting the reachable accuracy.
Image SX SY Number of GCP
First 0.45m 0.48m 171
Centre 0.41m 0.45m 168
last 0.44m 0.48m 170
Table 2: Standard deviation of ground control points based on bias corrected RPC-orientation
Figure 4. Discrepancies at control points X, Y, centre image
Figure 5. Discrepancies at control points in Z, b/h = 1:4.5
The results of the bias corrected RPC-orientation (table 2 and figures 4 and 5) are based on affinity transformation in the image space. Orientations just with shifts in the image space have approximately 2% higher discrepancies as well as orientations with just 6 GCP, where the ground accuracy has been computed with the remaining GCP as check points. With the individual bias corrected orientations by intersection three-dimensional ground coordinates have been computed The International Archives of the Photogrammetry, Remote Sensing and Spatial Information Sciences, Volume XL-3/W2, 2015
(table 3). The discrepancies in X and Y are only slightly larger as by orientation of single images. The root mean square discrepancies in the height are still larger, but the base to height relation (b/h) (table 1) has to be respected. RMSZ multiplied with the base to height relation corresponds to the RMS of the x-parallaxes (RMSpx) in ground units.
Image combination
RMSX RMSY RMSZ RMSpx
Centre-first 0.46m 0.56m 2.04m 0.23m
Centre-last 0.44m 0.49m 2.17m 0.25m
First-last 0.43m 0.49m 1.16m 0.26m
Table 3: Root mean square differences at GCP in image model
The achieved accuracy for X and Y in the average of 0.45m corresponds to 0.64 geometric pixels (0.7m GSD) or 0.90 distributed pixels (0.50m GSD). For the quality of the GCP description this is a satisfying result, corresponding to the orientation of other very high resolution optical satellites (Büyüksalih and Jacobsen 2005). The RMSZ based on the combination of the first and the last image is 50% smaller as for the other image combinations, but related to RMSpx, computed by RMSZ multiplied with base to height relation, it is similar. RMSPx corresponds to 0.5 pixels of the distributed image (0.5m GSD), or 0.35 geometric pixels being a satisfying result. The y-parallax (py) is influenced by the image orientation, but also by jitter-effects of the satellite, not modelled by the RPC. With approximately 40 million py-values of image matching for height determination no clear jitter effect can be seen, in maximum the averaged y-parallax as function of the image coordinates is below 0.02 pixels and so it is negligible.
4. ANALYSIS OF HEIGHT MODELS
4.1 Image matching
Approximately 60% of the scene size is covered by forest, so least squares matching has been used. This is also justified by the fact that only a DTM was required and buildings had to be eliminated by filtering. The sharper figure of buildings determined by semi global matching was not important. The correlation coefficient in forest areas usually is small as it is in the case of a WorldView-2 stereo model with base to height relation of 1:1.26 (in figure 6 shown with WV-2), causing gaps in the height models (figure 8) (Büyüksalih et al. 2012) and not optimal frequency distribution of the correlation coefficients. This is not the case for the analyzed Pleiades image configuration with small base length (figure 6).
Figure 6. Frequency distribution of correlation coefficients, CF=centre and first image, CL=centre and last image, FL=first
and last image, WV-2=WorldView-2
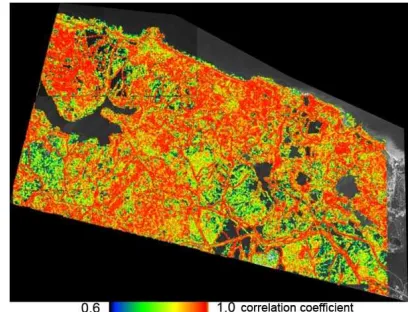
Figure 7. Distribution of correlation coefficients in scene combination centre and last image laid over Pleiades image
Especially the combinations of the centre and first (CF) as well as centre and last (CF) image with convergence angles of 6.3° respectively 6.4° have very good frequency distribution of the correlation coefficients in the whole area. Their frequency distribution is nearly the same, so that the blue line for the image combination CF is hidden by the red line. For the convergence angle of 12.5° of the combination first to last image (FL) the correlation coefficient is not as good, nevertheless clearly better as for larger convergence angle (WV-2). With small convergence angle images are more similar to each other, even if the surface is not smooth.
Figure 7 shows the very good correlation even in forest areas. Gaps of matching – with correlation coefficients below the chosen threshold of 0.6 – are only over water bodies, caused by clouds (centre left) and in extremely rough terrain or areas without texture (sports field).
Figure 8. Distribution of correlation coefficients in WorldView-2 model, Black Sea cost, close to Istanbul, b/h=1:1.WorldView-26
With same matching method also height models have been generated with WorldView-2 images (0.5m GSD) in an area with similar roughness and forest coverage (Büyüksalih et al. 2012). WorldView-2 (WV-2) for the panchromatic band has a spectral range from 450nm to 800nm, similar to Pleiades with 470nm to 830nm. The WV-2 images are taken with 69° sun elevation, this should be better as for Pleiades images which The International Archives of the Photogrammetry, Remote Sensing and Spatial Information Sciences, Volume XL-3/W2, 2015
have been taken with 59° sun elevation. Also the used ground resolution with 0.5m GSD is similar to the ground resolution of Pleiades. Due to this fact the not as good matching with WV-2 images only can be explained by the different base to height relation. As shown in figure 8, the correlation coefficient of the WV-2 model especially in forest areas is not as good, causing larger gaps in the height model. The comparison demonstrates the improvement of matching with small angle of convergence.
4.2 Intersection of object points
The corresponding image coordinates of matching have been used for intersection with the bias corrected RPC orientations. The resulting y-parallaxes (table 4) show some systematic errors, but the standard deviation Spy is small in spite of the not optimal terrain. Spy for the larger angle of convergence is larger as for the other, demonstrating again the influence of the image similarity depending upon the angle of convergence. This is different as with the GCP (table 3), but the GCP have been measured manually in the individual images, not improved by matching.
Image combination RMSpy bias Spy
Centre – first 0.27m 0.21m 0.16m
Centre – last 0.28m 0.25m 0.13m
First - last 0.22m -0.01m 0.22m
Table 4: y-parallaxes of intersection based on least squares matching
4.3 Filtering and shifting of height models
Figure 9. Result of filtering – black = filtered + Black Sea colour corresponds to terrain height
The generated height models are digital surface models (DSM) with points on the visible surface, while the reference is a digital terrain model (DTM) with points on the bare ground. So the points not located on the bare ground had to be removed. This was done by own program RASCOR (Passini et al. 2002). In the average 29% of the object points have been removed by filtering. Filtering in the build up area is simple while in forest area without ground points on the rough terrain it is a problem. Because of strongly unequal tree heights a correction of heights in the forest by constant shift is not possible. The forest area is
not a problem for the comparison with the reference height model because this does not include forest areas.
An example of the filtering improved by morphologic opening is shown in figure 9 for the city area. All buildings have been removed automatically. In the northern planned region the buildings are larger and arranged to the road network, while in the lower part the buildings are smaller and not as regular, demonstrating the effect of the unplanned settlement in steeper regions.
4.4 Height model based on all images together
At first the individual height models have been computed. Finally a determination with all three images together followed. By the common computation 0.6% of the height points has been identified as outside tolerance limit and has been eliminated.
4.5 Comparison of height models
At first height models based on combination of two images have been generated – the combination of the centre with the first image (CF) (base to height relation 1:9.0), the combination of the centre with the last image (CL) (base to height relation 1:8.8) and the combination of the first and the last image (FL) (base to height relation 1:4.5). For the analysis of the differences between the height models determined with the Pleiades images and the reference DTM, standard deviations of the height (SZ) and the normalized median absolute deviation (NMAD) (Höhle and Höhle 2009) have been computed.
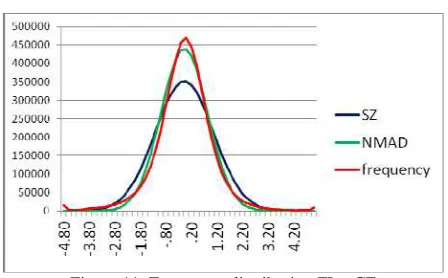
Figure 10. Frequency distribution of the height model based on all 3 images together against reference DTM
Figure 11. Frequency distribution FL - CF
Figure 10 shows the frequency of the height differences for the height model based on all three images together against reference DTM overlaid with normal distribution based on SZ and NMAD. Due to the just 3752 discrepancies the frequency distribution (red line) is not very smooth, but it is obvious that the normal distribution based on the NMAD (green line) fits quite better to it as the normal distribution based on the SZ The International Archives of the Photogrammetry, Remote Sensing and Spatial Information Sciences, Volume XL-3/W2, 2015
(blue line). This is the case for all frequency distributions as shown also in figure 11 with the result based on the differences of the DSM based on the combination of the first and the last image against the result based on the combination of the centre and the first image. Here the frequency function is smooth due to 9 million discrepancies. That means NMAD describes the accuracy characteristic better as SZ.
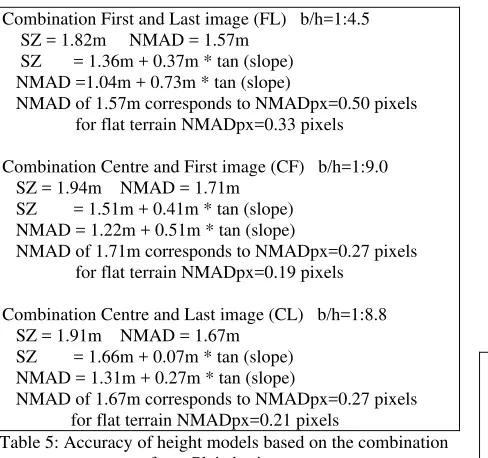
Combination First and Last image (FL) b/h=1:4.5 SZ = 1.82m NMAD = 1.57m
SZ = 1.36m + 0.37m * tan (slope) NMAD =1.04m + 0.73m * tan (slope)
NMAD of 1.57m corresponds to NMADpx=0.50 pixels for flat terrain NMADpx=0.33 pixels
Combination Centre and First image (CF) b/h=1:9.0 SZ = 1.94m NMAD = 1.71m
SZ = 1.51m + 0.41m * tan (slope) NMAD = 1.22m + 0.51m * tan (slope)
NMAD of 1.71m corresponds to NMADpx=0.27 pixels for flat terrain NMADpx=0.19 pixels
Combination Centre and Last image (CL) b/h=1:8.8 SZ = 1.91m NMAD = 1.67m
SZ = 1.66m + 0.07m * tan (slope) NMAD = 1.31m + 0.27m * tan (slope)
NMAD of 1.67m corresponds to NMADpx=0.27 pixels for flat terrain NMADpx=0.21 pixels
Table 5: Accuracy of height models based on the combination of two Pleiades images
Table 5 shows the accuracy figures of the filtered height models based on the combination of two Pleiades images in relation to the reference height model. The reference height model includes only points measured manually on bare ground based on digital aerial images with 30cm GSD, because of this, only approximately 0.6% of the discrepancies are exceeding 10m and have not been respected. The standard deviation of the reference height model is estimated to SZ=0.5m. In addition only a limited influence of the interpolation has to be added. The mentioned height difference of 0.47m against linear interpolation in the centre over 4m point spacing corresponds to 0.12cm in the centre of the used 2m spacing.
The results CF and CL with similar base to height relation agree very well, while the combination FL with approximately double base to height relation is a little better, but not as corresponding to the ratio of the base to height relations. This can be seen at the NMADpx of 0.27pixels against 0.5pixels respectively for flat terrain of 0.20pixels for base to height relation ~1:9 against 0.33pixels for the base to height relation 1:4.5. This is a typical relation between height accuracy and angle of convergence. In a similar terrain in Turkey with WorldView-2 stereo pairs (0.5m GSD) with base to height relation 1:1.3 up to 1:1.8 only NMADpx of approximately 1.0 pixel has been reached. This corresponds to the experience of building height determination with IKONOS images (Alobeid et al. 2009) showing only a limited dependency of the height accuracy upon the base to height relation.
The individual height differences as visible in figure 12 show some local effects. In lower left corner are several red and brown points with differences between -1.8m and -4.2m. This may be explained by remaining influence of the vegetation to the Pleiades height models. Nevertheless the accuracy of neighboured points to each other is just approximately 10% better as the absolute accuracy.
As mentioned above, also a height model based on all 3 Pleiades images together has been generated (table 6). The reached accuracy is only slightly better as for the height model just based on the first and last image. This is not a surprise because the geometric conditions are similar. The advantage of the handling of three images is the over determination leading to the identification of 0.6% blunders.
Figure 12. Colour coded height differences CF against
reference DTM
Figure 13. Colour coded height differences of the DSM
based on all 3 images against reference DTM
Based on 3 Pleiades images b/h maximal=1:4.5 SZ = 1.76m NMAD = 1.53m
SZ = 1.45m + 0.52m * tan (slope) NMAD =1.14m + 0.51m * tan (slope)
NMAD of 1.53m corresponds to NMADpx=0.50 pixels for flat terrain NMADpx=0.36 pixels
Table 6: accuracy of height model based on all 3 Pleiades images together
The colour coded height differences in figure 13 are very similar to figure 9, indicating again the remaining influence of vegetation to the Pleiades height model.
The different analyzed Pleiades DSM can be compared to each other having the same influence of the vegetation and allowing an accuracy estimation without terrain cover, but the individual DSM are not independent from each other due to the fact that one same image is used in both compared DSM.
Comparison FL with CL b/h=1:4.5 – b/h=1:8.8 SZ = 1.06m NMAD = 0.86m
SZ = 0.74m + 0.36m * tan (slope) NMAD =0.40m + 0.62m * tan (slope)
Comparison FL with CF b/h=1:4.5 – b/h=1:9.0 SZ = 1.14m NMAD = 0.91m
NMAD of 1.34m corresponds to NMADpx=0.22 pixels for flat terrain NMADpx=0.14 pixels
Table 7: Discrepancies between Pleiades height models based on different image combinations
The accuracy figures for the comparison of the different Pleiades height models (table 7) are independent upon the terrain cover and so they are showing the geometric influence clearer as the comparison with a reference height model. The comparison CL – CF where both models have small angle of The International Archives of the Photogrammetry, Remote Sensing and Spatial Information Sciences, Volume XL-3/W2, 2015
convergence shows clearly larger discrepancies as the comparisons FL – CF and FL – CL, where the combination of the first and last (FL) image has a larger angle of convergence. The relation of the results is not far away from the simple geometric relation expressed by the base to height relation.
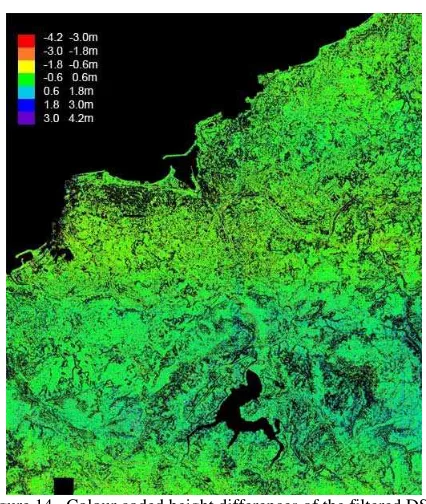
Figure 14 . Colour coded height differences of the filtered DSM FL against CF
Figure 14 with the colour coded height differences of the filtered DSM based on the combination of first and last image against the DSM based on the centre and first image shows only small height differences, but indicates with the green-blue tone in the elevated parts a small scale difference of the heights. The analysis shows a small, but significant height scale difference of 0.13%. The incidence angle for the combination of the centre and the first image of 6° is sensitive for small deviations of the direct sensor orientation which only has been improved in the horizontal plane by bias correction.
The analyzed height models are based on bias corrected RPC orientation with affinity transformation in image space. With the exception of the shift parameters, the other 4 affinity parameters have Student-test values between 1.0 and 2.0. Due to this fact also RPC orientations just with bias shift have been used for the generation of height models, leading to 0% up to 6% larger discrepancies in relation to the reference height model and up to 0.3% scale difference for Z by the comparison of the different height models. This confirms the advantage of bias correction by affinity transformation in image space.
5. CONCLUSION
Image matching with short base length Pleiades images le ads to quite better results as image matching with large base length. Even in forest areas the correlation coefficient usually is in the range of 0.95 up to 1.0. For larger angle of convergence the correlation coefficient in forest areas often is below the threshold of 0.6, causing gaps in the DSM. The good matching of the used Pleiades images is leading to very satisfying height accuracy. For flat areas the NMAD of the generated DSM for the base to height relation of approximately 1:9 is in the range of 1.2m, corresponding to x-parallax of 0.2 pixels and for the base to height relation of 1:4.5 it is in the range of 1.0m,
corresponding to x-parallax of 0.3 pixels. With larger angle of convergence the NMAD of the x-parallax is growing, nevertheless the absolute height accuracy is better for larger angle of convergence with the disadvantage of gaps in forest areas and larger occlusions especially in built up areas. That means the optimal base to height relation depends upon the major project task and so for some topics a smaller angle of convergence may be a better solution.
The use of three images together for height determination did not improve the accuracy of filtered height models, nevertheless 0.6% blunders have been determined during individual point determination before filtering of the DSM. The very small percentage of blunders depends upon the good image matching and this percentage is growing with larger angle of convergence. The reached accuracy can be accepted for 50cm GSD even if the geometric GSD of Pleiades images is just 70cm.
As usual, discrepancies at GCP are smaller as discrepancies of height models having not the same optimal point definition as check points.
REFERENCES
Alobeid, A., Jacobsen, K. and Heipke, C., 2009: Building height estimation in urban areas from very high resolution satellite stereo images, ISPRS Hannover Workshop 2009, IntArchPhRS. Vol XXXVIII-1-4-7/W5
Bernard, M., Decluseau, D., Gabet, L. and Nonin, P., 2012: 3D Capabilities of Pleiades Satellites, ISPRS Symposium Melbourne 2012, IntArchPhRS Vol XXXIX-B3
Büyüksalih, G. and Jacobsen, K., 2005: Optimized geometric handling of high resolution space images, ASPRS annual convention Baltimore, 2005
Büyüksalih, G., Baz, I., Alkan, M. and Jacobsen, K., 2012: DEM generation with WorldView-2 images, ISPRS Symposium Melbourne 2012, IntArchPhRS Vol XXXVIII-B1
Durand, A., Michel, J., de Franchis, C., Allenbach, B. and Giros, A., 2013: Assessment of three DSM generation approaches using Pleiades-HR data, EARSeL Symposium 2013, http://www.earsel.org/symposia/2013-symposium Matera /proceedings.php (February 2015)
Grodecki, J., 2001: IKONOS stereo feature extraction – RPC-approach, ASPRS Annual Conference, St. Louis, USA, 2001 Höhle, J. and Höhle, M., 2009: Accuracy assessment of digital elevation models by means of robust statistical methods, ISPRS Journal of Photogrammetry and Remote Sensing, 64, pp. 398-406
Jacobsen, K., 2015: Sind Pleades-Bilder mit 50cm Objektpixelgröße gerechtfertigt?, DGPF Tagungsband 24/2015 Passini, R., Betzner, D. and Jacobsen, K., 2002: Filtering of Digital Elevation Models, ASPRS annual convention, Washington 2002
Pleiades Imagery User Guide, http://www.astrium-geo.com/en/4572-pleiades-technical-documents (January 2015)
Poli, D., Remondin, F., Angiuli, E. and Agugiaro, G., 2013: Evaluation of Pleiades 1A Triplet on Trento test field, ISPRS Hannover Workshop 2013, IntArchPhRS. Vol XL-1/W1 The International Archives of the Photogrammetry, Remote Sensing and Spatial Information Sciences, Volume XL-3/W2, 2015