Lampiran 1. Hasil Uji Normalitas Total Assets
Case Processing Summary
24 100,0% 0 ,0% 24 100,0%
24 100,0% 0 ,0% 24 100,0%
Kelompok Perusahaan split
non split Total Assets
N Percent N Percent N Percent
Valid Missing Total
Cases
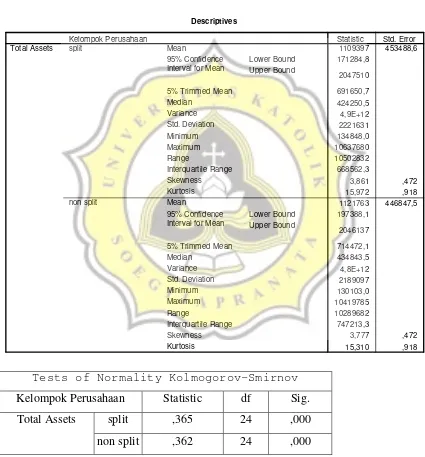
Descriptives
1109397 453488,6
171284,8
2047510
691650,7 424250,5 4,9E+12 2221631 134848,0 10637680 10502832 668562,3
3,861 ,472
15,972 ,918
1121763 446847,5
197388,1
2046137
714472,1 434843,5 4,8E+12 2189097 130103,0 10419785 10289682 747213,3
3,777 ,472
15,310 ,918
Mean
Lower Bound Upper Bound 95% Confidence
Interval for Mean
5% Trimmed Mean Median
Variance Std. Deviation Minimum Maximum Range
Interquartile Range Skewness Kurtosis Mean
Lower Bound Upper Bound 95% Confidence
Interval for Mean
5% Trimmed Mean Median
Variance Std. Deviation Minimum Maximum Range
Interquartile Range Skewness Kurtosis Kelompok Perusahaan
split
non split Total Assets
Statistic Std. Error
Tests of Normality Kolmogorov-Smirnov
Kelompok Perusahaan
Statistic
df
Sig.
split
,365
24
,000
Total Assets
non split
,362
24
,000
Normal Q-Q Plot of Total Assets
For KELMPK= split
Observed Value
12000000 10000000 8000000 6000000 4000000 2000000 0
-2000000 -4000000
Expected Normal
2,0
1,5
1,0
,5
0,0
-,5
-1,0
-1,5 -2,0
Normal Q-Q Plot of Total Assets
For KELMPK= non split
Observed Value
12000000 10000000 8000000 6000000 4000000 2000000 0
-2000000 -4000000
Expected Normal
2,0 1,5
1,0
,5
0,0
-,5
-1,0
-1,5 -2,0
Case Processing Summary
24 100,0% 0 ,0% 24 100,0%
24 100,0% 0 ,0% 24 100,0%
kelompok perusahaan split
non split TALN
N Percent N Percent N Percent
Valid Missing Total
Cases
Descriptives
13,102888 ,2292994
12,628546
13,577229
13,011619 12,956350 1,262 1,1233329 11,8119 16,1799 4,3680 1,518000
1,098 ,472
1,190 ,918
13,119600 ,2314197
12,640872
13,598328
13,032694 12,981150 1,285 1,1337205 11,7760 16,1592 4,3832 1,622675
1,025 ,472
,940 ,918
Mean
Lower Bound Upper Bound 95% Confidence
Interval for Mean
5% Trimmed Mean Median
Variance Std. Deviation Minimum Maximum Range
Interquartile Range Skewness Kurtosis Mean
Lower Bound Upper Bound 95% Confidence
Interval for Mean
5% Trimmed Mean Median
Variance Std. Deviation Minimum Maximum Range
Interquartile Range Skewness Kurtosis kelompok perusahaan
split
non split TALN
Statistic Std. Error
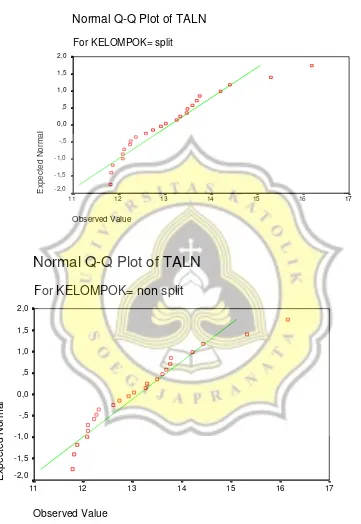
Tests of Normality
Kolmogorov-Smirnov
Kelompok Perusahaan
Statistic
df
Sig.
split
,125
24
,200
TALN
non split
,136
24
,200
Gambar Normal Probability Plots
Normal Q-Q Plot of TALN
For KELOMPOK= split
Observed Value
17 16
15 14
13 12
11
Expected Normal
2,0
1,5
1,0
,5
0,0
-,5
-1,0
-1,5 -2,0
Normal Q-Q Plot of TALN
For KELOMPOK= non split
Observed Value
17 16
15 14
13 12
11
Expected Normal
2,0 1,5 1,0 ,5 0,0 -,5 -1,0 -1,5 -2,0
Lampiran 3. Hasil Uji Beda Independent Sampel T-test Total Assets
(ln)
Group Statistics
24 13,102888 1,1233329 ,2292994 24 13,119600 1,1337205 ,2314197 kelompok perusahaan
split non split TALN
N Mean Std. Deviation
Std. Error Mean
Independent Samples Test
,007 ,932 -,051 46 ,959 -,016713 ,3257811 -,6724758 ,6390508
-,051 45,996 ,959 -,016713 ,3257811 -,6724773 ,6390523
Equal variances assumed Equal variances not assumed TALN
F Sig.
Levene's Test for Equality of Variances
t df Sig. (2-tailed)
Mean Difference
Std. Error
Difference Lower Upper
95% Confidence Interval of the
Lampiran 4. Hasil Uji Normalitas ROI
Case Processing Summary
24 100,0% 0 ,0% 24 100,0%
24 100,0% 0 ,0% 24 100,0%
kelompok perusahaan split
non split ROI
N Percent N Percent N Percent
Valid Missing Total
Cases
Descriptives
8,325833 1,3014938 5,633488
11,018178 7,965926 8,335000 40,653 6,3759916 -4,2900 29,3500 33,6400 6,692500
1,127 ,472
4,598 ,918
,084167 2,5854465 -5,264237
5,432570 -,025648 1,870000 160,429 12,66605 -24,7300 28,4700 53,2000 17,307500
-,146 ,472
,115 ,918
Mean
Lower Bound Upper Bound 95% Confidence
Interval for Mean
5% Trimmed Mean Median
Variance Std. Deviation Minimum Maximum Range
Interquartile Range Skewness
Kurtosis Mean
Lower Bound Upper Bound 95% Confidence
Interval for Mean
5% Trimmed Mean Median
Variance Std. Deviation Minimum Maximum Range
Interquartile Range Skewness
Kurtosis kelompok perusahaan
split
non split ROI
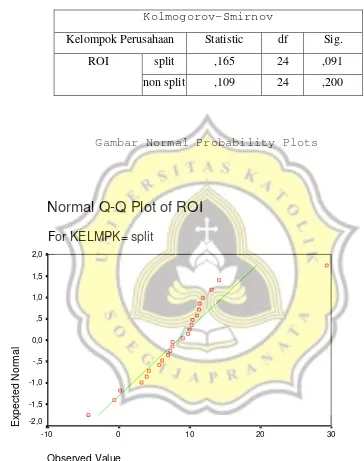
Tests of Normality
Kolmogorov-Smirnov
Kelompok Perusahaan
Statistic
df
Sig.
split
,165
24
,091
ROI
non split
,109
24
,200
Gambar Normal Probability Plots
Normal Q-Q Plot of ROI
For KELMPK= split
Observed Value
30 20
10 0
-10
Expected Normal
2,0 1,5 1,0 ,5 0,0 -,5 -1,0 -1,5 -2,0
Normal Q-Q Plot of ROI
For KELMPK= non split
Observed Value
30 20
10 0
-10 -20
-30
Expected Normal
Lampiran 5. Hasil Uji Normalitas EPS
Case Processing Summary
24 100,0% 0 ,0% 24 100,0%
24 100,0% 0 ,0% 24 100,0%
kelompok perusahaan split
non split EPS
N Percent N Percent N Percent
Valid Missing Total
Cases
Descriptives
172,2494 53,92814 60,690550
283,8083
153,1753 32,500000 69797,875 264,1929 -153,000 827,0000 980,0000 313,5000
1,338 ,472 ,784 ,918 -27,6681 63,97119 -160,003
104,6664
-29,9646 2,554000 98215,509 313,3935 -870,000 871,0000 1741,000 190,5000
,077 ,472 3,907 ,918 Mean
Lower Bound Upper Bound 95% Confidence
Interval for Mean
5% Trimmed Mean Median
Variance Std. Deviation Minimum Maximum Range
Interquartile Range Skewness
Kurtosis Mean
Lower Bound Upper Bound 95% Confidence
Interval for Mean
5% Trimmed Mean Median
Variance Std. Deviation Minimum Maximum Range
Interquartile Range Skewness
Kurtosis kelompok perusahaan
split
non split EPS
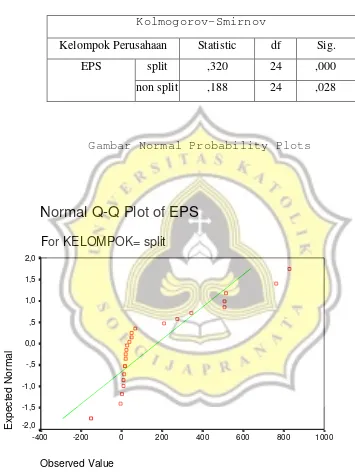
Tests of Normality
Kolmogorov-Smirnov
Kelompok Perusahaan
Statistic
df
Sig.
split
,320
24
,000
EPS
non split
,188
24
,028
Gambar Normal Probability Plots
Normal Q-Q Plot of EPS
For KELOMPOK= split
Observed Value
1000 800
600 400
200 0
-200 -400
Expected Normal
Normal Q-Q Plot of EPS
For KELOMPOK= non split
Observed Value
1000 0
-1000
Expected Normal
Lampiran 6. Uji Normalitas PER
Case Processing Summary
24 100,0% 0 ,0% 24 100,0%
24 100,0% 0 ,0% 24 100,0%
kelompok perusahaan split
non split PER
N Percent N Percent N Percent
Valid Missing Total
Cases
Descriptives
91,552083 59,27306 -31,0636
214,1678
35,226944 17,700000 84319,109 290,3775 -32,9500 1440,990 1473,940 51,742500
4,741 ,472 22,908 ,918 -9,052917 10,85284
-31,5037
13,397895
1,171204 1,490000 2826,820 53,16785 -256,390 13,9000 270,2900 10,900000
-4,755 ,472 23,018 ,918 Mean
Lower Bound Upper Bound 95% Confidence
Interval for Mean
5% Trimmed Mean Median
Variance Std. Deviation Minimum Maximum Range
Interquartile Range Skewness
Kurtosis Mean
Lower Bound Upper Bound 95% Confidence
Interval for Mean
5% Trimmed Mean Median
Variance Std. Deviation Minimum Maximum Range
Interquartile Range Skewness
Kurtosis kelompok perusahaan
split
non split PER
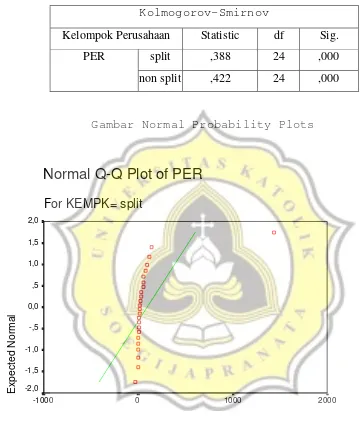
Tests of Normality
Kolmogorov-Smirnov
Kelompok Perusahaan
Statistic
df
Sig.
split
,388
24
,000
PER
non split
,422
24
,000
Gambar Normal Probability Plots
Normal Q-Q Plot of PER
For KEMPK= split
Observed Value
2000 1000
0 -1000
Expected Normal
2,0 1,5 1,0 ,5 0,0 -,5 -1,0 -1,5 -2,0
Normal Q-Q Plot of PER
For KEMPK= non split
Observed Value
100 0
-100 -200
-300
Expected Normal
Lampiran 7. Uji Normalitas PBV
Case Processing Summary
24 100,0% 0 ,0% 24 100,0%
24 100,0% 0 ,0% 24 100,0%
kelompok perusahaan split
non split PBV
N Percent N Percent N Percent
Valid Missing Total
Cases
Descriptives
5,752917 1,2282904 3,212004
8,293829
5,063704 5,420000 36,209 6,0173694 -,2700 25,4200 25,6900 6,250000
1,822 ,472 4,139 ,918 1,418333 ,9196377
-,484082
3,320749
,898241 ,735000 20,298 4,5052864 -6,5100 20,6300 27,1400 2,220000
3,401 ,472 15,792 ,918 Mean
Lower Bound Upper Bound 95% Confidence
Interval for Mean
5% Trimmed Mean Median
Variance Std. Deviation Minimum Maximum Range
Interquartile Range Skewness
Kurtosis Mean
Lower Bound Upper Bound 95% Confidence
Interval for Mean
5% Trimmed Mean Median
Variance Std. Deviation Minimum Maximum Range
Interquartile Range Skewness
Kurtosis kelompok perusahaan
split
non split PBV
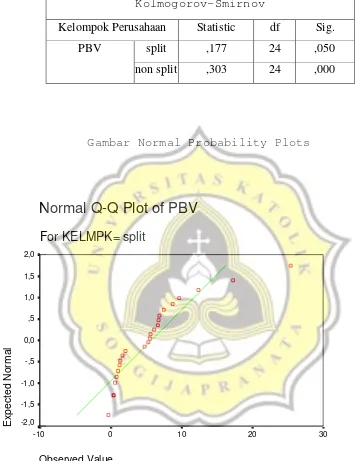
Tests of Normality
Kolmogorov-Smirnov
Kelompok Perusahaan
Statistic
df
Sig.
split
,177
24
,050
PBV
non split
,303
24
,000
Gambar Normal Probability Plots
Normal Q-Q Plot of PBV
For KELMPK= split
Observed Value
30 20
10 0
-10
Expected Normal
Normal Q-Q Plot of PBV
For KELMPK= non split
Observed Value
30 20
10 0
-10
Expected Normal
Lampiran 8 Uji Normalitas EPS(ln),PER (ln), PBV (ln)
Case Processing Summary
24 100,0% 0 ,0% 24 100,0%
24 100,0% 0 ,0% 24 100,0%
24 100,0% 0 ,0% 24 100,0%
24 100,0% 0 ,0% 24 100,0%
24 100,0% 0 ,0% 24 100,0%
24 100,0% 0 ,0% 24 100,0%
kelompok perusahaan split
non split split non split split non split EPS
PER
PBV
N Percent N Percent N Percent
Valid Missing Total
Descriptives
2,702862 ,4406273 1,791355
3,614370
2,784827 2,871300 4,660 2,1586242 -3,4949 7,2730 10,7679 2,659825
-,766 ,472 2,110 ,918 ,295017 ,4201474 -,574124
1,164158
,463005 ,848050 4,237 2,0582935 -5,5466 2,6318 8,1784 3,292125
-1,135 ,472 1,203 ,918 Mean
Lower Bound Upper Bound 95% Confidence
Interval for Mean
5% Trimmed Mean Median
Variance Std. Deviation Minimum Maximum Range
Interquartile Range Skewness
Kurtosis Mean
Lower Bound Upper Bound 95% Confidence
Interval for Mean
5% Trimmed Mean Median
Variance Std. Deviation Minimum Maximum Range
Interquartile Range Skewness
Kurtosis kelompok perusahaan
split
non split PER
Descriptives
1,244662 ,2399012 ,748389
1,740936
1,260500 1,689800 1,381 1,1752713 -,9675 3,2355 4,2030 1,771100
-,451 ,472 -,712 ,918 ,359033 ,2300685 -,116900
,834966
,337682 ,425550 1,270 1,1271007 -1,8733 3,0267 4,9000 1,292725
,193 ,472 ,669 ,918 Mean
Lower Bound Upper Bound 95% Confidence
Interval for Mean
5% Trimmed Mean Median
Variance Std. Deviation Minimum Maximum Range
Interquartile Range Skewness
Kurtosis Mean
Lower Bound Upper Bound 95% Confidence
Interval for Mean
5% Trimmed Mean Median
Variance Std. Deviation Minimum Maximum Range
Interquartile Range Skewness
Kurtosis kelompok perusahaan
split
non split PBV
Tests of Normality
Kolmogorov-Smirnov
Kelompok Perusahaan
Statistic
df
Sig.
split
,172
24
,065
EPS (ln)
non split
,170
24
,070
Kolmogorov-Smirnov
Kelompok Perusahaan
Statistic
df
Sig.
split
,126
24
,200
PER (ln)
non split
,144
24
,200
Kolmogorov-Smirnov
Kelompok Perusahaan
Statistic
df
Sig.
split
,188
24
,027
PBV(ln)
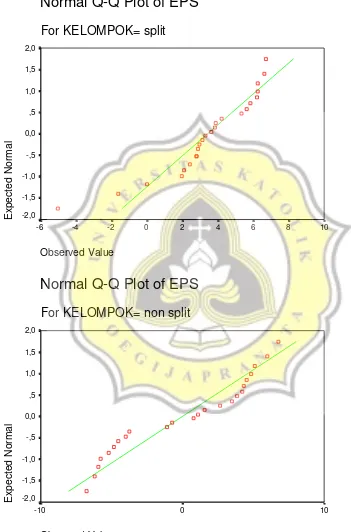
Gambar Normal Probability Plots
Normal Q-Q Plot of EPS
For KELOMPOK= split
Observed Value
10 8
6 4
2 0
-2 -4
-6
Expected Normal
2,0 1,5 1,0 ,5 0,0 -,5 -1,0 -1,5 -2,0
Normal Q-Q Plot of EPS
For KELOMPOK= non split
Observed Value
10 0
-10
Expected Normal
Normal Q-Q Plot of PER
For KELOMPOK= split
Observed Value
8 6
4 2
0 -2
-4
Expected Normal
2,0 1,5 1,0 ,5 0,0 -,5 -1,0 -1,5 -2,0
Normal Q-Q Plot of PER
For KELOMPOK= non split
Observed Value
4 2
0 -2
-4 -6
Expected Normal
Normal Q-Q Plot of PBV
For KELOMPOK= split
Observed Value
4 3
2 1
0 -1
-2
Expected Normal
2,0 1,5 1,0 ,5 0,0 -,5 -1,0 -1,5 -2,0
Normal Q-Q Plot of PBV
For KELOMPOK= non split
Observed Value
4 3
2 1
0 -1
-2
Expected Normal
Lampiran 9. Hasil Uji Beda Independent Sampel T-test
ROI
Group Statistics
24
8,3258
6,37599
1,30149
24
,0842
12,66605
2,58545
jenis perusahaan
split
non split
ROI
N
Mean
Std. Deviation
Std. Error
Mean
Independent Samples Test
9,091 ,004 2,847 46 ,007 8,2417 2,89455 2,41524 14,06809
2,847 33,953 ,007 8,2417 2,89455 2,35893 14,12440 Equal variances
assumed Equal variances not assumed ROI
F Sig.
Levene's Test for Equality of Variances
t df Sig. (2-tailed)
Mean Difference
Std. Error
Difference Lower Upper 95% Confidence Interval of the
Difference t-test for Equality of Means
Group Statistics
24
3,417629
2,7605501
,5634949
24
,016500
4,5789380
,9346718
24
2,702863
2,1586242
,4406273
24
,295017
2,0582935
,4201474
24
1,244662
1,1752713
,2399012
24
,359033
1,1271007
,2300685
kelompok perusahaan
split
non split
split
non split
split
non split
EPS
PER
PBV
N
Mean
Std. Deviation
Std. Error
Mean
Independent Samples Test
15,123 ,000 3,116 46 ,003 3,401129 1,0913927 1,2042697 5,5979887
3,116 37,768 ,003 3,401129 1,0913927 1,1912751 5,6109832
,009 ,926 3,955 46 ,000 2,407846 ,6088319 1,1823308 3,6333609
3,955 45,896 ,000 2,407846 ,6088319 1,1822560 3,6334357
,643 ,427 2,664 46 ,011 ,885629 ,3323915 ,2165598 1,5546985
2,664 45,920 ,011 ,885629 ,3323915 ,2165282 1,5547301
Equal variances assumed Equal variances not assumed Equal variances assumed Equal variances not assumed Equal variances assumed Equal variances not assumed EPS
PER
PBV
F Sig.
Levene's Test for Equality of Variances
t df Sig. (2-tailed)
Mean Difference
Std. Error
Difference Lower Upper
95% Confidence Interval of the
Lampiran 11. Hasil Uji beda Mann-Whitney PBV(ln)
Ranks
24 29,52 708,50
24 19,48 467,50
48 kelompok perusahaan
split non split Total PBV
N Mean Rank Sum of Ranks
Test Statisticsa
167,500 467,500 -2,485 ,013 Mann-Whitney U
Wilcoxon W Z
Asymp. Sig. (2-tailed)
PBV
Grouping Variable: kelompok perusahaan a.