Biological Dosimetry Using Micronucleus Assay
in Simulated Partial-Body Exposure to Ionizing
Radiation
S. Purnami, S. Nurhayati, M. Syaifudin
and D. Ramadhani
*Center for Radiation Safety Technology and Metrology, National Nuclear Energy Agency Jl. Lebak Bulus Raya No. 49, Jakarta 12440, Indonesia
A R T I C L E I N F O A B S T R A C T
Article history:
Received 15 November 2015
Received in revised form 03 August 2016 Accepted 05 December 2016
Keywords:
Biodosimetry Micronucleus Partial body exposure Radiation
Simulation
In radiation accidents, it is common that only several parts of the body are exposed to radiation. As a consequence there is a mixture of exposed and unexposed lymphocytes in peripheral blood cells of the samples. This phenomenon will cause the dose value estimated using the exposed lymphocytes to be lower than the actual dose. In this study, an assessment of partial body exposures using micronucleus assay by estimating the partial body dose and fraction of irradiated blood was conducted. An optimal D0 value also has been determined in this study to estimate the fraction of irradiated cells. Peripheral blood lymphocytes (PBLs) from three healthy donors were irradiated in vitro with 2 Gy of X-rays. Partial radiation exposure was simulated by mixing the irradiated and non-irradiated blood in different proportions. The proportions of mixtures of blood samples irradiated in vitro were 5, 10, 15, 20, and 30 %. Blood samples were then cultured and harvested based on micronuclei assay protocol. At least 2000 binucleated cells with well-preserved cytoplasm were scored for the MN frequency. Dose Estimate 5.1 software was used to calculate the dispersion index (σ2/y) and normalized unit of this index (U) in each proportion of bloods. The fractions of irradiated cells were calculated with CABAS (Chromosomal Aberration Calculation Software) for several different
D0 values (2.7; 3.8; 5.4). The results showed that D0 value at 5.4 gave the closest results to the actual proportion of irradiated bloods, while for the dose estimation the estimated doses value from all proportions in all donors were higher than the actual dose. The factor that may cause this phenomenon was that the dose response calibration curve used to predict the radiation dose was not constructed in the laboratory used. Overall it can be concluded that a biodosimetry using MN assay can be used to estimate the radiation dose in partial body exposure. In order to establish a biodosimetry using MN analysis the dose-response calibration curve MN analysis should be constructed first in the laboratory used.
© 2017 Atom Indonesia. All rights reserved
INTRODUCTION
The radiation doses absorbed and distributed into the bodies of radiation accident casualties are important to guide immediate medical treatment, further health care, and prognosis of exposure casualties [1]. In radiation accidents, the exposure mostly occurs only to part of the body and as a result there is a mixture of exposed and unexposed lymphocytes in peripheral blood samples [2].
Corresponding author.
E-mail address: [email protected] DOI:https://doi.org/10.17146/aij.2017.405
Since the exposed and unexposed lymphocytes are mixed, the dose received by the exposed lymphocytes and the dose delivered locally could be underestimated [3]. Discrimination between victims that are exposed for the whole body with those that are exposed partially is important as they will have different clinical outcomes, and it affects the medical care to treat them [4]. Until now, there are
two mathematicalmodels that have been developed
to assess the dose according to the fraction of
exposed lymphocytes, i.e., Qdr and Dolphin’s
models. Both models have been validated in vitro by
mixing irradiated and unirradiated blood in different
Atom Indonesia
proportions and have also been tested in vivo in accident situations, with promising results [3,5].
Several studies have been conducted to estimate the radiation dose that is received partially
by radiotherapy patients. Silva-Barbosa et al., study
showed that chromosomal aberrations and
micronuclei (MN) quantification in lymphocytes from peripheral blood of cervical uterine cancer
patients before and after receiving 0.08 Gy and 1.8 Gy was a potentially advantageous methodology
of dose assessment especially in partial body exposure to ionizing radiation [6]. Another study,
conducted by Senthamizhchelvan et al., revealed
that biological dosimetry using micronuclei (MN) assays was applicable for dose estimation in therapeutic irradiation of cancer patients in acute high dose partial body irradiation [7].
Biological dosimetry (biodosimetry) is an investigation of biological effects (bioindicators) induced by radiation in order to correlate them with the radiation dose. Scoring of unstable chromosome aberrations (dicentrics, rings, and fragments) is considered as the most reliable method for evaluating individual exposure, and is specific to radiation exposure [8-10]. Another well known bioindicator of radiation damage is MN in peripheral blood lymphocytes [11]. Micronucleus are chromosome fragments that lag behind during anaphase and are not included in the main nucleus during telophase. They appear as small nuclei and can be identified during cell binucleation in the division of mitogen-activated human lymphocytes by blocking cytokinesis [5-7].
In this study, an assessment of partial-body exposures using MN assay was conducted, including the estimations of partial-body dose and
fraction of irradiated blood. An optimal D0 value has
also been determined in this study to estimate the the partial-body dose exposures using MN assay, we only used three samples that consisted of one male and two females without history of smoking habit and ionizing radiation exposure beyond routine diagnostic exposures. The reason that both male and female samples were used in this study was that it was decided that it was necessary to know whether the gender factor influenced the predicted dose value in partial-body exposure. Peripheral blood
samples from all donors were collected in heparinized vacutainers. The characteristics of the donors are presented in Table 1. The blood samples
were irradiated in vitro at the Secondary Standard
Dosimetry Laboratory at Center for Radiation Safety Technology and Metrology, National Nuclear Energy Agency of Indonesia. Blood samples were exposed to X-ray (YXLON MG325) at 122 kV using additional filters of 1.66 mm Cu and 1 mm Al with an HVL of 2.52 mm Cu at 2 Gy with a dose rate 0.17 Gy/min. The radiation dose used in this study was 2 Gy because this is commonly used as a radiotherapy dose fractionation. After irradiation, the blood samples were maintained at 37 °C for one hour to enable repair of chromosomal damages. To simulate partial-body exposures the irradiated blood was mixed with non-irradiated blood to final proportions of 5, 10, 15, 20, and 30 %.
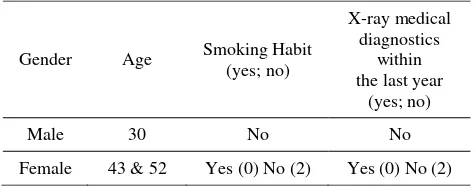
Table 1. Characteristics of the donor samples.
Gender Age Smoking Habit X-ray machines were applied for irradiating blood samples using an NE Technology type 2570 Farmer dosimeter and a type 2571 ionization chamber. Measurement of air kerma was done in the air at the source-to-sample-center distance of 100 cm, and the radiation field was 10 cm. The air kerma from X-ray track was calculated using the equation given in IAEA Technical Reports Series No. 277.
Blood culture
cold hypotonic solution (0.075 M KCl) to lyse red blood. The fixative consisting of methanol:acetic
acid (10:1) diluted with Ringer’s solution (NaCl,
KCl, CaCl2) should be added to replace the
hypotonic solution. Then, the supernatant was washed with fixative solution twice or three times until the cell suspension is clear. The cells were then resuspended gently and the suspension dropped onto clean glass slides and allowed to dry. The slides were then stained with 4 % Giemsa's solution in a potassium phosphate buffer (pH 7.3) and allowed to dry overnight. The slides were mounted with cover slip and allowed to dry completely before scoring. The slides were then analyzed, and identification of MN was conducted according to the scoring criteria in IAEA publication [5]. At least 2000 binucleated cells with well-preserved cytoplasm were scored for the MN frequency.
Statistical Analysis
The dispersion index (σ2/y) and also the
normalized unit of this index (U) were calculated
for each proportion of blood using Dose Estimate 5.1 software. The fractions of irradiated cells were
also calculated for the estimated dose (D) using
several different D0 value (2.7; 3.8; 5.4) using
Chromosome Aberration Calculation Software (CABAS) version 2.0.
RESULTS AND DISCUSSION
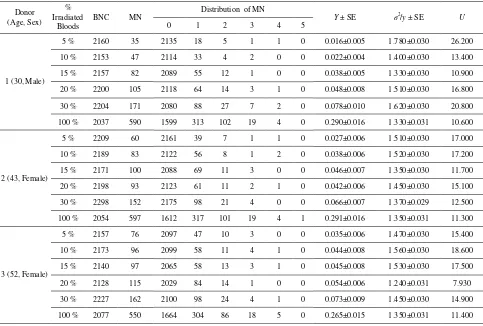
The MN frequencies and distributions in all proportions of irradiated blood tested were presented at Table 2. It was clearly seen that in all
proportion of irradiated bloods the u values were
significant overdispersion (u > 1.96). Value of u
varies from 7.93 to 26.2. In dicentric analysis it was well known that to determine the type of radiation
exposure can be seen from u value evaluation.
In case of whole body exposure the u value
commonly follow Poisson distribution. A significant overdispersion is suggestive of partial irradiation for dicentric analysis and can be used to differentiate
the homogeneously exposed samples from
heterogeneously exposed samples [12]. In contrast
for MNs assays the u values commonly overdispere,
as it can be seen in table 2 even at control group
(100 %) the u value still overdispere. The proportion
of irradiated cells and estimated dose (D) with
several different D0 values (2.7; 3.8; 5.4) using
CABAS 2.0 were presented at Table 3. It can be
seen that D0 value at 5.4 gave a results closest to the
real proportion of irradiated bloods (Fig. 1).
Table 2. The MN frequencies and distributions in all proportions of irradiated blood.
Donor (Age, Sex)
% Irradiated
Bloods
BNC MN
Distribution of MN
Y ± SE σ2/y ± SE U 0 1 2 3 4 5
1 (30, Male)
5 % 2160 35 2135 18 5 1 1 0 0.016±0.005 1.780±0.030 26.200
10 % 2153 47 2114 33 4 2 0 0 0.022±0.004 1.400±0.030 13.400
15 % 2157 82 2089 55 12 1 0 0 0.038±0.005 1.330±0.030 10.900
20 % 2200 105 2118 64 14 3 1 0 0.048±0.008 1.510±0.030 16.800
30 % 2204 171 2080 88 27 7 2 0 0.078±0.010 1.620±0.030 20.800
100 % 2037 590 1599 313 102 19 4 0 0.290±0.016 1.330±0.031 10.600
2 (43, Female)
5 % 2209 60 2161 39 7 1 1 0 0.027±0.006 1.510±0.030 17.000
10 % 2189 83 2122 56 8 1 2 0 0.038±0.006 1.520±0.030 17.200
15 % 2171 100 2088 69 11 3 0 0 0.046±0.007 1.350±0.030 11.700
20 % 2198 93 2123 61 11 2 1 0 0.042±0.006 1.450±0.030 15.100
30 % 2298 152 2175 98 21 4 0 0 0.066±0.007 1.370±0.029 12.500
100 % 2054 597 1612 317 101 19 4 1 0.291±0.016 1.350±0.031 11.300
3 (52, Female)
5 % 2157 76 2097 47 10 3 0 0 0.035±0.006 1.470±0.030 15.400
10 % 2173 96 2099 58 11 4 1 0 0.044±0.008 1.560±0.030 18.600
15 % 2140 97 2065 58 13 3 1 0 0.045±0.008 1.530±0.030 17.500
20 % 2128 115 2029 84 14 1 0 0 0.054±0.006 1.240±0.031 7.930
30 % 2227 162 2100 98 24 4 1 0 0.073±0.009 1.450±0.030 14.900
Table 3. Predicted fraction of irradiated cells and estimated dose (D) with several different D0 values (2.7; 3.8; 5.4).
Donor (Age, Sex)
% Irradiated
Bloods
D0 = 2.7 D0 = 3.8 D0 = 5.4 Estimated %
Irradiated
Estimated Partial Dose (Gy)
Estimated % Irradiated
Estimated Partial Dose (Gy)
Estimated % Irradiated
Estimated Partial Dose (Gy)
1 (30, Male)
5 % 10.16 4.3237 6.66 4.3237 4.86 4.3237
10 % 14.27 2.8037 10.99 2.8037 9.04 2.8037
15 % 23.27 2.8037 18.36 2.8037 15.32 2.8037
20 % 26.48 3.4517 19.96 3.4517 16.02 3.4517
30 % 37.33 4.1589 27.66 4.1589 21.69 4.1589
2 (43, Female)
5 % 16.74 3.1624 12.55 3.1624 10.10 3.1624
10 % 22.56 3.0624 17.36 3.0624 14.22 3.0624
15 % 27.52 2.7504 22.07 2.7504 18.62 2.7504
20 % 24.62 3.1127 18.98 3.1127 15.55 3.1127
30 % 35.34 3.0624 28.28 3.0624 23.72 3.0624
3 (52, Female)
5 % 20.76 3.3090 15.55 3.3090 12.47 3.3090
10 % 24.68 3.5909 18.27 3.5909 14.47 3.5909
15 % 25.26 3.5449 18.81 3.5449 14.97 3.5449
20 % 33.48 2.3592 28.13 2.3592 24.58 2.3592
30 % 36.82 3.4045 28.85 3.4045 23.74 3.4045
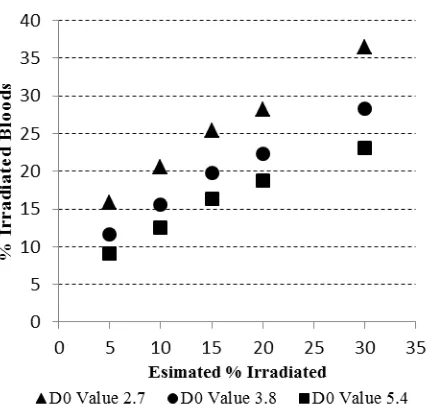
Fig. 1. Estimate of percentage (%) irradiated compared to actual
values irradiated using three different D0 values, namely 2.7 (triangles), 3.8 (circles) and 5.4 (squares).
Even though the D0 value of 5.4 gave a better
results compared to others D0 values, the predicted
proportions of irradiated cells are still
inaccurate. The factor that may have caused this phenomenon was the dose-response calibration curve used to predict the fraction of irradiated cells. In this study the dose-response calibration
curve was from Pajic et al., [13]. Since the
laboratory where this study took place did not have its own dose-response calibration curve for
MN, a calibration curve from another study is used here. Inaccuracy in fraction estimation was also
reported using several D0 value in the dicentric
assay [14].
IAEA recommended that laboratories
performing biological dose assessment using cytogenetic analysis should obtain their own dose-response calibration curve for different types and energies of radiation [5]. For that reason, and to obtain more accurate dose prediction (and prediction of proportion of irradiated cells in the case of partial body exposure) the laboratory used in this study now develops the dose-response
calibration curve for micronuclei analysis.
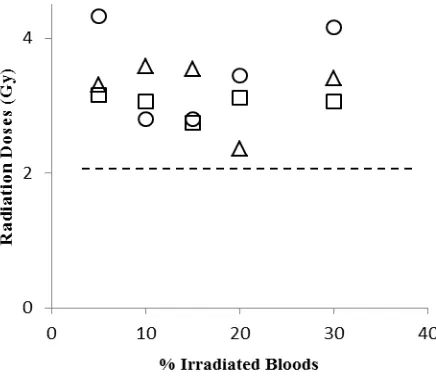
For dose estimation, the estimated doses
value from all proportions in all donors was higher compared to the actual dose of 2 Gy (Fig. 2). A factor that may contribute to this result was the dose-response calibration curve used for dose estimation not being constructed in the laboratory. From the results of this study, it was clear that the radiation dose-response calibration curve for the MN analysis should be produced in the
same laboratory. The laboratory previously
Fig. 2. Estimate of radiation dose values for all proportions of irradiated bloods from three different donors. The dashed line is the actual radiation dose of 2 Gy.
The results show that the induced MN freuencies are proportional to the percentage of irradiated lymphocytes. For example, the total number of MN for 30 % at donor 1 was 171 while for 100 % was 590. It can also be seen that most of binucleated cells contained a single MN. There are inter-individual differences among
subjects that are influenced by different
mutagen sensitivity and DNA repair capacity. It was known that MN frequency in females tends to be higher relative to males by a factor approximately 1.4. Researchers suspect that the higher MN frequency in females correlated with greater tendency of the inactive X-chromosome to be lost as an MN relative to other chromosomes, and to the fact that females have two copies of the chromosome compared to only one in males [16,17].
A study conducted by Jones et al. [18]
showed that in 19.9 % of the cells scored at least one sex chromatin-positive MN was present.
Another study by Hando et al. [19] found
that X-chromosomes present in 72.2 % of the MN scored and that a significant increase occurred with
age in the number of MNs containing an X-chromosome. The increase of MN with age is due to a combination of several factors, namely:
(i) the cumulative effect of acquired mutations in genes involved in DNA repair, and: (ii)
numerical and structural aberrations in
chromosomes caused by exposure to endogenous genotoxins, inadequate nutrition, exposure to environmental or occupational genotoxins, and a wide range of unhealthy lifestyle factors [16].
Interestingly, from our results the total MN in the male was higher compared to average of total MN from the two females. Age also did not exhibit influence in our study as can be seen that the total MN in donor 3 was lower compared to other donors. Since in this study the number of sample donors only consisted of three people, it is possible that influence of sex and age to total MN cannot be seen from this study. Further studies should be conducted to verify the effect of sex and age factors to number of MN in human peripheral lymphocytes. Here an evaluation of micronuclei for estimating the dose of radiation to lymphocytes is described. Micronuclei are only expressed in cells that proceed to complete nuclear division. This assay has emerged as one of the preferred methods for assessing chromosomal damage because they enable both chromosome loss and chromosome breakage to be measured reliably.
Moreover, this technique is useful for determining irradiation dosage by examining a large number of binucleated cells faster and using simpler techniques than chromosome aberrations. The technique is very easy to use when a large number of cells must be examined for routine monitoring of workers exposed to radiation [20,21] as MN is a good tool for cancer risk prediction as well as for studying genotoxicity and cytotoxicity as well as studies on genomic damage by chemicals in general [22].
CONCLUSION
Overall, it can be concluded from this study that biodosimetry using MN assay can be used to estimate the radiation dose in partial body exposure. However, it was not possible to distinguish between partial or total body exposures using Poisson or overdispersion distribution as the basis when conducting biodosimetry using MN
assay. An optimal D0 value was also calculated in
this study and it can be seen that from this study
that a D0 value of 5.4 gave more accurate results
compared with 2.7 and 3.8. To obtain more accurate results the laboratory used should construct the dose-response calibration curve for MN analysis in further studies.
ACKNOWLEDGMENT
REFERENCES
1. Romero, O. Garcia, A. Lamadrid et al.,
J. Radiat. Res. 54 (2013) 863. DOI: 10.1093/
jrr/rrt032.
2. T. Fernandes, D. Loyd and A. Amaral,
Brazilian Arch. Biol. Technol. 51 (2008) 97.
DOI: http://dx.doi.org/10.1590/S1516-8913200 8000700016.
3. S. Roch-Lefèvre, F. Pouzoulet, A. Giraudet
et al., Br. J. Radiol. 83 (993) (2010) 759.
DOI:http://dx.doi.org/10.1259/bjr/210225597.
4. M. Valente, J. Denis, N. Grenier et al., PLoS
One 10 (2015) 1. DOI: 10.1371/journal.
pone.0132194.
5. Anonymous, Cytogenetic Dosimetry:
Applications In Preparedness For And
Response To Radiation Emergencies,
IAEA, 2011.
6. I. Silva-Barbosa, S. Pereira-Magnata,
A. Amaral et al., Genet. Mol. Biol. 28 (2005)
452. DOI: http://dx.doi.org/10.1590/S1415-47572005000300021.
7. S. Senthamizhchelvan, G. Pant, G. Rath et al.,
Phys. Medica 25 (2009) 82. DOI:
http://dx.doi.org/10.1016/j.ejmp.2008.05.004.
8. J.M. Sullivan, P.G.S. Prasanna, M.B. Grace
et al., Health Phys. 105 (2013) 1. DOI:
10.1097/HP.0b013e31829cf221.
9. K. Rothkamm, C. Beinke, H. Romm et al.,
Radiat. Res. 180 (2013) 111. DOI: 10.1667/
RR3231.1.
10. G.T. Selvan, M. Bhavani, J. Vijayalakshmi
et al., Dose-Response 12 (2014) 498.
DOI: 10.2203/dose-response.13-060.Selvan.
11. S.W. Lue, M. Repin, D.J. Brenner et al.,
Radiat. Res. 184 (2015) 134.
12. A. Vaurijoux, E. Gregoire, S. Roch-Lefevre
et al., Radiat. Res. 178 (2011) 357. DOI:
10.1667/RR2728.1.
13. J. Pajic, B. Rakic, D. Jovicic et al., Mutat. Res.
Genet. Toxicol. Environ. Mutagen.
773 (2014) 23. DOI: 10.1016/j.mrgentox.
2014.07.009.
14. J. Barquinero, L. Barrios, M. Caballin et al.,
Int. J. Radiat. Biol. 71 (1997) 435.
15. Y. Lusiyanti, Z. Alatas, M. Lubis et al.,
Atom Indonesia 39 (2013) 124. DOI:
http://dx.doi.org/10.17146/aij.2013. 254.
16. M. Fenech and S. Bonassi, Mutagenesis 26
(2011) 43. DOI: 10.1093/mutage/geq050.
17 H. Nefic and I. Handzic, Mutat. Res. 753
(2013) 1. DOI: 10.1016/j.mrgentox.2013. 03.001.
18. K. Jones, T. York and C. Jackson-Cook,
Mutat. Res. 747 (2012) 207. DOI: 10.1016/
j.mrgentox.2012.05.004.
19. J. Hando, J. Nath and J. Tucker, Chromosoma
103 (1994) 186.
20. A. Vral, M. Fenech, H. Thierens et al.,
Mutagenesis 26 (2011) 11. DOI: 10.1093/
mutage/geq078.
21. K. Rawojc, D.M. Tarnawska, J.U. Miszczyk
et al., Nukleonika 60 (2015) 643. DOI:
10.1515/nuka-2015-0105.
22. S. Bonassi, R. El-zein, C. Bolognesi et al.,
Mutagenesis 26 (2011) 93. DOI: 10.1093/