Abstract: Recently, many facilities have completed new laboratories that may be used to
as-sess various measures of Indoor Environment Quality (IEQ) in office spaces. Also recently, a new standard, ISO 3382- 3, was released for assessing the effects of speech on IEQ in open plan offices. The aim of this report is to assess one room of the IEQ lab using the ISO 3382- 3
standard. It is expected that the data gained will be of help to researchers using the facility in the future.
Keywords: ISO 3382-3, Indoor Environment Quality, Acoustics
Introduction
In the field of acoustics, speech has al -ways been one of the subjects that has in-terested researchers, particularly speech privacy and speech intelligibility. From time to time new ideas are raised and
regulation changes affect the way that
speech descriptors and requirements can be evaluated. The current descriptors for speech privacy and speech intelligibility are stated in AS 2822, but recently they
have been specified for open plan of
-fices in ISO 3382- 3. Modern open plan offices require reasonable levels of speech
privacy between workstations,
particular-ly if the speech is of a confidential na
-ture. ISO 3382- 3 specifies methods for
the measurement of room acoustic
prop-erties in open plan offices with furnishing [1].
The objective of this report is to iden-tify the Speech Transmission Index (STI) properties of the Indoor Environment Quality laboratory (IEQ lab) and to begin development of a spreadsheet that
pro-vides the report data required by ISO 3382- 3. All the parameters and data used to assess the STI such as back-ground noise, A- weighted Sound Pres-sure Level (SPL) of speech, and SPL in octave bands of pink noise, will be dis-cussed further in this report.
Measurement Room (IEQ
Lab)
The lab used for this purpose of ex-periment has three rooms and a
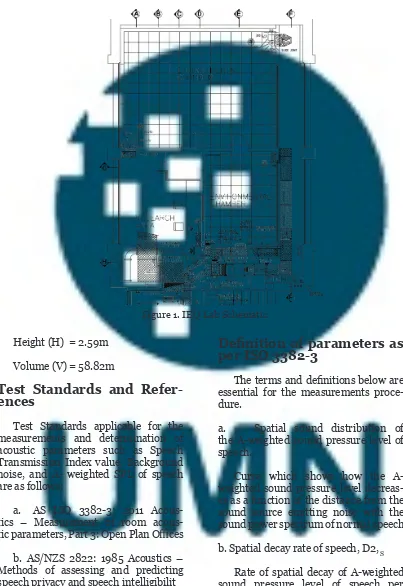
cor-ridor (see figure 1). The test room was
furnished with chairs and desks, which are essentials for the measurements according to the ISO 3382- 3, 5.2.1, Measurement conditions. For this mea-surement, Environmental chamber 1 will be used.
The Environmental Chamber 1 has the following dimensions:
Figure 1. IEQ Lab Schematic
Height (H) = 2.59m Volume (V) = 58.82m
Test Standards and
Refer-ences
Test Standards applicable for the measurements and determination of acoustic parameters such as Speech Transmission Index value, Background noise, and A- weighted SPL of speech are as follows:
a. AS ISO 3382- 3: 2011 Acous-tics – Measurement of room
acous-tic parameters, Part 3: Open Plan Offices
b. AS/NZS 2822: 1985 Acoustics –
Methods of assessing and predicting speech privacy and speech intelligibilit
Definition of parameters as
per ISO 3382- 3
The terms and definitions below are
essential for the measurements proce-dure.
a. Spatial sound distribution of the A- weighted sound pressure level of speech.
Curve which shows how the A- weighted sound pressure level decreas-es as a function of the distance from the sound source emitting noise with the sound power spectrum of normal speech b. Spatial decay rate of speech, D2, S
distance doubling
NOTE This definition in an ap -plication of DL2 defined in ISO 14257, but the spectrum of normal speech and A- weighting over the whole frequency range. The spatial decay is not deter-mined for individual octave bands. c. Wweighted sound pressure level of speech at a distance of 4 m
Nominal A- weighted sound pressure level of normal speech at a distance of 4,0 m from the sound source
NOTE: The measurement position does not need to be located at this distance from the sound source. Lp,A,S,4 m
is obtained using a linear regression line from the spatial sound distribution of the A- weighted sound pressure level (SPL) of speech.
d. Speech transmission index, STI
Physical quantity representing the transmission quality of speech with re-spect to intelligibility
[IEC 60268 – 16:2011]
e. Spatial sound distribution of the speech transmission index
Curve which shows how the speech transmission index decreases from a ref-erence sound source when distance in-creases
f. Distraction distance, rD
Distance from speaker where the speech transmission index falls below 0,50
NOTE 1 Distraction distance is ex-pressed in metres.
NOTE 2 Above the distraction distance, concentration and privacy start to improve rapidly.
g. Privacy distance, rP
Distance from speaker where the speech transmission index falls below 0,20
NOTE 1 Privacy distance is ex-pressed in metres.
NOTE 2 Above the privacy dis-tance, concentration and privacy are experienced very much the same as
be-tween separate office rooms. STI values less than 0,20 are difficult to achieve in offices with poor speech privacy or small
volume.
h. Background noise level, Lp,B
Sound pressure level in octave bands present at the workstation during work-ing hours with people absent
NOTE 1 Background noise here means all such continuous sounds, which are not caused by people, e.g. heating, ventilation, and air condition-ing (HVAC) devices, environmental
traffic noise, office equipment or a
sound- masking system.
Measurements quantities
The room parameters must be calcu-lated and measured. To determine the parameters of speech intelligibility and speech privacy, some measurements are essential as per AS ISO 3382- 3. The measurements are:
a. Sound pressure level in octave bands of pink noise, Lp, Ls ;
c. Background noise in octave bands, Lp,B;
d. Distance to the sound source, r
Measurement equipment
The following equipment was used for the measurement:
a. Sound source NTI Talkbox
The NTI Talk box is a directional sound source, which can be used to
gen-erate different types of signals, such as
pink. It also has a line input for con-necting external sound sources.
b. Sound Level Meter
Brüel & Kjær Type 2250 Sound Level Meter
The sound level meter was used to measure the background noise level and the sound pressure level of pink noise. This sound level meter is capable of pro-viding data in one- third- octave and oc-tave bands.
c. Computer Analyzer Dell Laptop with EASERA
The computer was used with EAS-ERA to generate sin wave sweep. The Edirol USB audio interface was connect-ed to the NTI Talk box line input. d. Omnidirectional Microphone Earthworks M30
This measurement microphone has
a reasonably flat frequency response. It
was connected directly to the Edirol USB audio interface
Test Procedure
General Measurement
con-ditions
Measurements in accordance with ISO 3382 shall be made in furnished rooms, but without the presence of peo-ple, except the persons needed to carry out the measurements. The HVAC de-vices and other noise source shall oper-ate on the same power as during typical working hours. If the
HVAC cannot be operated during the measurements, adjustments must be made to compensate it.
Frequency range of
mea-surement
The measurement of room acoustic
parameters for open plan offices (espe -cially SPL and STI) was measured in oc-tave bands from 125 Hz to 8,000 Hz. For this measurement, third- octave bands shall be used for the purpose of gaining more data and the frequency range of 125 Hz to 10,000 Hz were used. STI shall be determined in accordance with the
full method specified in IEC 60268- 16.
Generating sound source
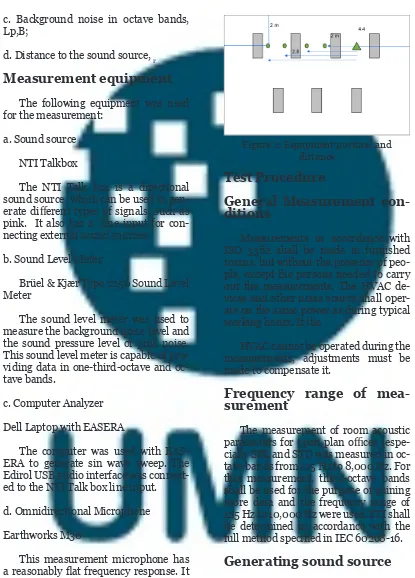
According to AS ISO 3382- 3, an Figure 2. Equipment position and
ing pink noise shall be used since people
in open plan office do not continuously speak in any fixed direction. This mea -surement used a directional sound source (NTI Talk box). The sound source was positioned at the height of 1.2 m, the av-erage head height of a seated person.
Background noise
measure-ment
Background noise level, Lp,B, is mea-sured at each measurement position in octave bands. The average background noise level of all the measurement po-sitions is determined. The background noise is measured for one minute at each measurement position.
Sound Pressure Level
mea-surement
The Sound Pressure Level shall be measured using a sound level meter in each octave band and each microphone position with integration time should be at least 10 s. The microphone shall be om-nidirectional.
Microphone and sound level
meter position
“It is recommended that the measure-ments be carried out along a line, which crosses over workstations. The preferred number of successive measurement posi-tions in the line is 6 to 10; the minimum number is 4” – et al ISO 3382- 3. Only the positions within the range of 2 m to 16 m are used for the determination of spa-tial decay rate of speech (D2, S). For this
measurement, the first position of the
microphone and the sound level meter is 2.11 m from the sound source
Sound source position
The positions of loudspeaker and mi-crophone shall be at least 0.5 m from the
tables and at least 2 m from the walls and
other reflecting surfaces. At least two
sound source positions shall be used. As stated on 8.1.3, the sound source shall be placed at the height of 1.2 m above the
floor.
Measurement
Sound pressure level measurement was undertaken in accordance to ISO 3382- 3. A directional loudspeaker with pink noise output was used in the mea-surement. The sound power level of the
pink noise must be sufficiently high for
the sound pressure level to exceeds the background noise level by 6 dB at the most distant measurement point. Mea-surements were undertaken in one-third octave band frequencies at 4
different positions.
STI Measurement
The STI measurement was per-formed using the EASERA program. EASERA is able to generate a sine wave sweep that is used to calculate STI value. The omnidirectional microphone was connected to the input of the EDIROL audio interface. The output of the audio interface was connected to the line input of the NTI Talkbox. For each measure-ment position the signal was played four
times. The duration of each sweep was 43 seconds. By doing this, any artifacts that might occur during the measure-ment can be ignored.
Measurement procedure
The NTI Talkbox was positioned two metres from the two nearest walls. The sound level meter (SLM) was placed at
the first workstation, 2.11 m from the
NTI. It should be noted that each posi-tion of the microphone and the sound level meter must be at least 2 m apart from the wall. Figure 2 shoes the room layout and the location of the source and receiver positions.
The background noise was measured at each of the positions for one minute by using the sound level meter in one- third octave band mode. The ceiling HVAC was running during all measure-ments.
The measurement of the Sound Pres-sure Level of pink noise is identical to the procedure used when measuring background noise. The NTI Talk box, is
used to generate pink noise pink noise. This is measured using the SLM giving
us data in 1/3 octave bands.
STI measurements were taken at teach receiver position using the method stated in 8.4.
It should be noted that the procedure we used does not fully comply with ISO 3382- 3. We used a directional sound source instead of an omnidirectional sound source. We had limited time in the lab to take the measurements and as a result we were only able to take on line of measurements instead of the two lines required.
We attempted to take another set of measurements using a compact omnidi-rectional sound source and a swept sin wave signal. However, due to major on-going issues with the computer and soft-ware system we were unable to get any usable results.
Results and calculations of
parameters
The results were calculated in Excel using the formulas provided by the ISO 3382- 2 standard. Table 1 shows a summary of the results as required by the standard.
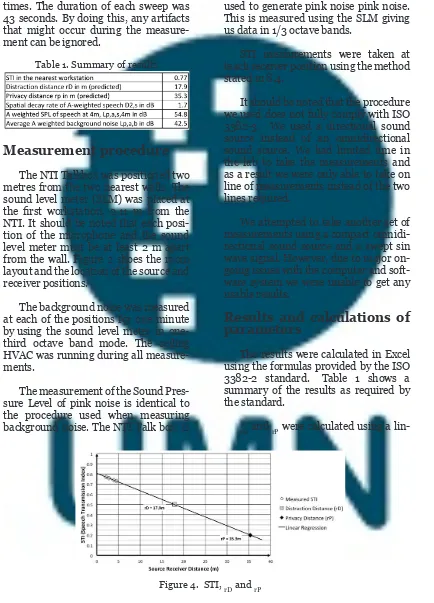
rD and rP were calculated using a
ear regression line determined from the
mea-sured STI values graphed in Excel (See figure
4). The formulas used to determine rD and rP are;
rD = (0.5 – Intercept)/Slope rP = (0.2 –
In-tercept)/Slope
Where 0.5 is the STI value at rD and 0,2 is the STI value at rP. Slope and Intercept values were calculated in Excel using the appropri-ate functions.
D2, S and Lp,A,S,4 m
The sound power level of the NTI Talk-box in octave bands was calculated using SPL measurements taken in the anechoic cham-ber. This allowed us to calculate
Lp, Ls, 1m for each octave. The formulas provided by the standard in section 6.2 were used to calculate the A- weighted sound pres-sure level of speech (Lp, A, S, n) at each mea-surement location. The levels and distances were used to plot a graph in Excel and linear regression was used to determine D2, S and Lp,A,S,4 m (see Figure 5).
Average background noise
The average background noise was deter-mined from the noise measurements at each position. (See Figure 5 and Table 1)
Discussion
As suggested by Haka, M., Haapa-kangas, A., Keränen, J., Hakala, J., Ke-skinen, E. and Hongisto, V. (2009), STI
values of open plan offices can be quali
-fied as;
• a private office (STI = 0.10),
• an acoustically excellent open office (STI = 0.35)
• an acoustically poor open office (STI = 0.65) [4].
When the results that we obtained are compared to the ratings from Haka, M., et al, it can be seen that the IEQ lab
Chamber 1 is a rather poor office envi -ronment.
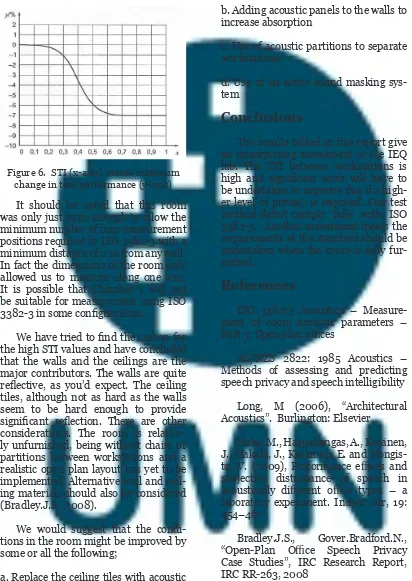
The high STI levels mean that rD and rP are outside the room’s bound-aries. ISO 3382 includes a diagram that
shows the effect of high STI values on worker productivity. (figure 6) The task
performance of anyone working in this room would be very poor and they would not have any speech privacy. Chamber 1
requires significant improvement to be an effective workspace while maintain -ing the same number of workstations.
It should be noted that this room was only just large enough to allow the minimum number of four measurement positions required by ISO 3382- 3 with a minimum distance of 2 m from any wall. In fact the dimensions of the room only allowed us to measure along one axis. It is possible that Chamber 1 will not be suitable for measurement using ISO
3382- 3 in some configurations.
We have tried to find the reason for
the high STI values and have concluded that the walls and the ceilings are the major contributors. The walls are quite
reflective, as you’d expect. The ceiling
tiles, although not as hard as the walls seem to be hard enough to provide
significant reflection. There are other
considerations. The room is relative-ly unfurnished, being without chairs or partitions between workstations and a realistic open plan layout has yet to be implemented. Alternative wall and ceil-ing materials should also be considered (Bradley.J.S., 2008).
We would suggest that the condi-tions in the room might be improved by some or all the following;
a. Replace the ceiling tiles with acoustic
b. Adding acoustic panels to the walls to increase absorption
c. Use of acoustic partitions to separate workstations
d. Use of an active sound masking sys-tem
Conclusions
The results tabled in this report give an unsurprising assessment of the IEQ lab. The STI between workstations is
high and significant work will have to
be undertaken to improve this if a high-er level of privacy is required. Our test method didn’t comply fully with ISO 3382- 3. Another assessment meets the requirements of the standard should be undertaken when the room is fully fur-nished.
References
ISO 3382- 3 Acoustics – Measure-ment of room acoustic parameters –
Part 3: Open plan offices
AS/NZS 2822: 1985 Acoustics –
Methods of assessing and predicting speech privacy and speech intelligibility
Long, M (2006), “Architectural Acoustics”. Burlington: Elsevier
Haka, M., Haapakangas, A., Keränen, J., Hakala, J., Keskinen, E. and
Hongis-to, V. (2009), Performance effects and
subjective disturbance of speech in
acoustically different office types – a
laboratory experiment. Indoor Air, 19: 454–467
Bradley.J.S., Gover.Bradford.N.,
“Open- Plan Office Speech Privacy
Case Studies”, IRC Research Report, IRC RR- 263, 2008